
Why Bitcoin Is Stuck Near $84,000 While ETF Money Keeps Arriving

Intro
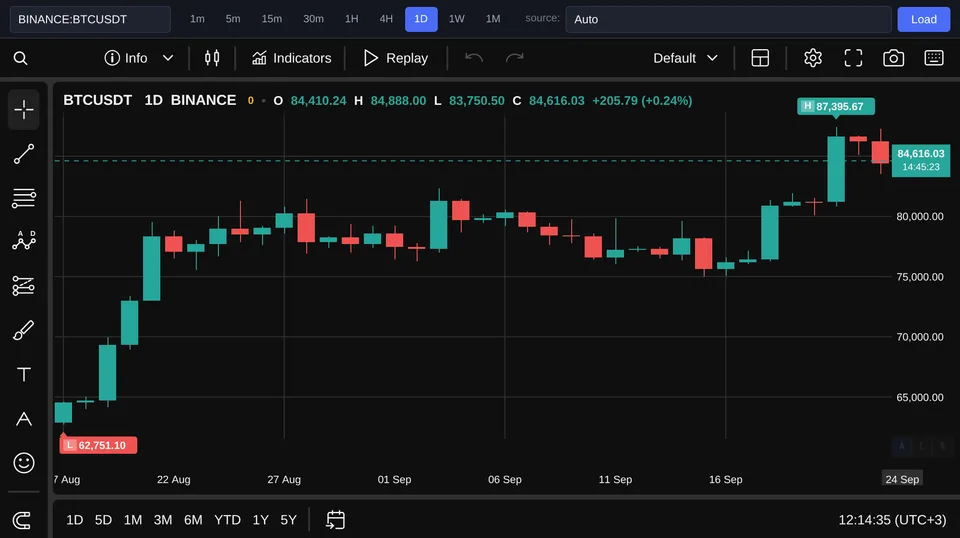
Bitcoin presents an apparent contradiction. On September 24, spot Bitcoin ETFs recorded approximately $190.7 million in net inflows, but Bitcoin is still trading at 84,409, with a daily change of -0.00%. Ether provides useful market context without changing the central question: it stands at 2,691 and is up just +0.10% for the day. The question is not whether ETF demand exists, but why that demand has not lifted Bitcoin decisively above the $84,000–$85,000 area. The most plausible answer is that ETF purchases are supporting the spot market while two stronger short-term forces—an unfavorable macroeconomic backdrop and the unwinding of leveraged futures positions—are limiting any advance.
What the confirmed facts actually show
Four observations define the current setup. Spot Bitcoin ETFs received about $190.7 million in net inflows on September 24; Bitcoin trades at 84,409 with a daily move of -0.00%; estimated crypto-futures liquidations reached $462 million over 24 hours; and higher yields and oil prices are weighing on risk appetite. These facts can coexist because they describe different parts of the market rather than one unified order book. ETF inflows represent net demand through a specific group of investment products. They do not reveal every sale by miners, funds, long-term holders, market makers, or investors trading through other venues. Likewise, liquidations mainly describe forced position closures in derivatives, where a relatively small amount of collateral can control a much larger exposure. The verified data therefore show genuine institutional buying alongside significant forced deleveraging. They do not prove that ETF demand is weak, nor do they prove that every dollar entering an ETF immediately becomes an equivalent upward impulse in the quoted Bitcoin price. The market is absorbing several flows at once, and their timing is rarely polite enough to form a neat chart for observers.
Three competing explanations for the stalled price
The first explanation is simple arithmetic: $190.7 million of net ETF inflows may be insufficient to overwhelm selling elsewhere. Existing holders can use stronger ETF demand as liquidity for reducing exposure, while miners or other large participants may sell for operational or portfolio reasons. Under this interpretation, the price near 84,409 is evidence of balanced flows, not evidence that ETF purchases have failed. The second explanation focuses on macro conditions. Rising yields increase the relative appeal of interest-bearing assets and can reduce investors’ willingness to pay for assets that generate no contractual cash flow. Higher oil prices may also revive inflation concerns, reinforcing expectations that monetary conditions will remain restrictive; ETF demand may consequently prevent a decline without being strong enough to inspire buyers to chase the market higher. The third explanation is the derivatives shakeout. About $462 million in daily crypto-futures liquidations indicates that leveraged positions were being closed forcibly rather than patiently reconsidered. Such selling can pressure prices even when underlying spot demand remains intact, because leverage behaves wonderfully on the way up and suddenly remembers gravity on the way down. The limitation of this explanation is that liquidation pressure should eventually diminish once vulnerable positions have been cleared.
The strongest working hypothesis
The best working hypothesis combines the macro and leverage explanations. ETF inflows are creating a floor under spot demand, but elevated yields and oil prices are discouraging broader risk-taking, while futures liquidations are adding mechanical selling. This combination explains why Bitcoin can remain comparatively resilient around $84,000 without producing a convincing rally. In this framework, ETFs are acting as a safety net rather than an elevator. Their purchases matter because the price might otherwise have fallen further under the combined weight of macro caution and forced position reductions. Flat performance at 84,409 can therefore contain information: new demand may be offsetting pressure that is not visible in the headline ETF number. This remains a probability-based editorial conclusion, not a confirmed causal chain. Public flow and liquidation figures cannot identify every seller, and the same price outcome could also reflect a large holder distributing coins into ETF demand. Still, the combined hypothesis explains more of the available evidence than the claim that ETF inflows should automatically produce a rally, because it accounts for spot buying, derivatives stress, and the macro environment at the same time.
Why $85,000 is the test—and what could falsify the view
JPMorgan estimates that the area around $85,000 is close to Bitcoin’s mining cost. If Bitcoin returns above that level and remains there, pressure on miners to sell coins to cover costs may ease, improving the supply-demand balance. A sustained move above $85,000 would therefore be more informative than a brief intraday touch. Several observable conditions would support the working hypothesis. ETF flows would need to remain positive, the volume of forced liquidations would need to decline, and Bitcoin would need to establish itself above $85,000 rather than repeatedly falling back below it. Easing yields or oil prices would add confirmation by removing part of the macro restraint on risk appetite. The hypothesis would weaken if ETF inflows persisted, liquidations subsided, macro conditions improved, and Bitcoin still could not hold above $85,000. That outcome would point toward substantial hidden supply from miners, long-term holders, or other large sellers. It would also be challenged if ETF inflows quickly reversed into outflows, because the supposed spot-market support would then have been temporary rather than structural.
Conclusion
Bitcoin’s lack of progress despite ETF buying is not necessarily a paradox. The confirmed figures—84,409 for Bitcoin, a -0.00% daily change, roughly $190.7 million of ETF inflows, and about $462 million of futures liquidations—are consistent with a market where institutional spot demand is offsetting macro pressure and forced deleveraging. The concise answer is that ETF purchases are probably supporting Bitcoin near $84,000, not yet propelling it higher. A sustained break above $85,000, accompanied by continued inflows and fewer liquidations, would validate that interpretation. Failure under improved conditions would instead signal that an important source of supply remains hidden behind the aggregate numbers.