
Why Calm US Indices Are Hiding a Weaker Market Beneath the Surface

Intro
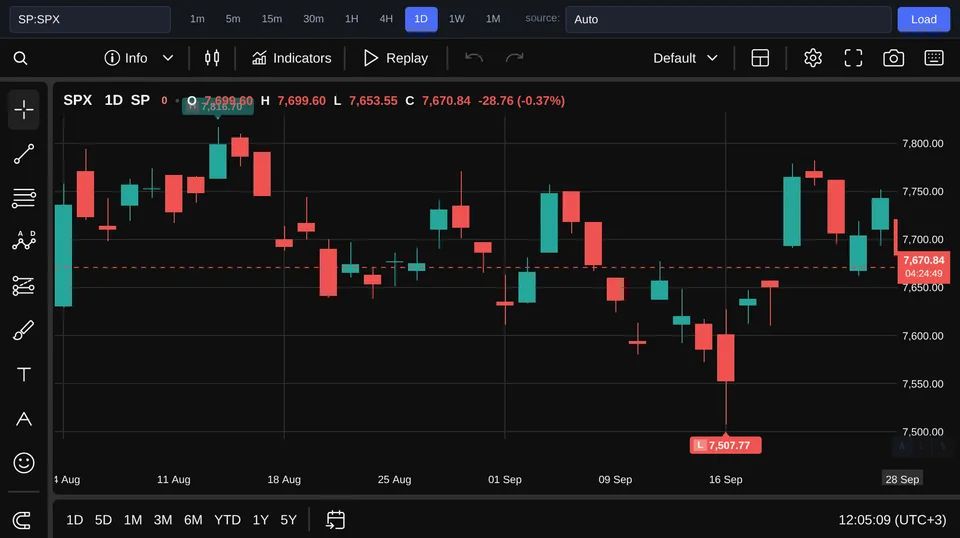
The headline numbers look almost uneventful. The S&P 500 stands at 7,671, down 0.17% for the day, while the Nasdaq 100 is at 30,339 and has gained 0.21%. Yet reports from inside the market show a less comfortable picture: only about one quarter of S&P 500 stocks remain above their 50-day moving averages, Treasury yields are near multi-year highs, and even Nvidia failed to preserve an earlier advance during the referenced session. That creates the day’s central question: why does the US market appear fragile when its largest indices have barely moved? The most plausible answer is that capitalization-weighted indices are concealing a broad repricing caused by expensive money. Caution before inflation data may be intensifying the move, but weakening breadth suggests something more substantial than an ordinary quiet day on Wall Street.
What the index level does—and does not—tell us
The confirmed facts must be separated from their interpretation. Treasury yields have reached multi-year highs, major US indices finished the referenced session under pressure, and Nvidia surrendered an early gain. At the current reading supplied for this article, the S&P 500 is down 0.17% at 7,671, whereas the technology-heavy Nasdaq 100 is up 0.21% at 30,339. Those figures are not contradictory. An index weighted by market capitalization can remain stable, or even rise, when a handful of its largest constituents perform well enough to offset losses across many smaller components. The Nasdaq 100’s positive daily change therefore demonstrates resilience among influential technology shares, but it does not establish that demand is healthy throughout the market. The breadth estimate provides the missing information. If only about a quarter of S&P 500 members are trading above their 50-day averages, most constituents have already lost short-term momentum even though the benchmark itself remains close to its elevated level. The index is measuring the weight of winners, while breadth is counting how many winners still exist. This divergence matters because a rally supported by fewer companies has less room for disappointment. When leadership is concentrated, weakness in one or two very large stocks can suddenly become weakness in the entire benchmark. For the moment, the megacaps are carrying much of the furniture; the concern is not their strength, but how little help they are receiving.
Three explanations for the deterioration in breadth
The first explanation is benign sector rotation. Under this interpretation, capital has not left US equities; it has merely moved from cyclical, smaller, or less profitable businesses into large technology companies with strong balance sheets and dependable cash generation. That would explain why the Nasdaq 100 can gain 0.21% while the broader S&P 500 slips 0.17%. Rotation alone, however, is an incomplete explanation. Healthy rotation usually produces new leadership elsewhere rather than leaving roughly three quarters of S&P 500 stocks below their 50-day averages. If demand is becoming steadily narrower instead of passing from one broad group to another, the process looks less like rotation and more like investors raising the quality threshold for owning equities. The second explanation is temporary risk reduction before inflation data. Investors know that an inflation surprise can rapidly change expectations for interest rates and bond yields, so trimming positions beforehand is rational. This version would imply that weak breadth is mainly a short-lived positioning effect and should reverse once the statistical uncertainty has passed. The third explanation is more structural: multi-year-high Treasury yields are compressing equity valuations. Government bonds set a competing return and influence the discount rate applied to future corporate earnings. When the available risk-free yield rises, investors require stronger profits or lower share prices to justify taking equity risk. That pressure is particularly uncomfortable for indebted companies, businesses needing fresh financing, and stocks whose valuations depend heavily on profits expected far in the future.
Why expensive capital is the strongest working hypothesis
Our editorial conclusion is probabilistic rather.
What would confirm or disprove the hypothesis
Several observable conditions would strengthen the expensive-capital interpretation. The first would be a further decline in the proportion of S&P 500 members above their 50-day averages while Treasury yields remain near their highs. The second would be an expanding number of stocks reaching new lows, showing that weakness is progressing beyond a technical loss of short-term momentum. A third confirmation would be persistent underperformance by an equal-weighted version of the S&P 500 relative to the capitalization-weighted benchmark. That comparison reduces the disproportionate influence of the largest companies. Continued weakness in mid-cap shares and economically sensitive sectors would add evidence that investors are avoiding businesses most exposed to financing costs and the economic cycle. The hypothesis would be weakened if breadth improved sustainably rather than bouncing for a single session. More S&P 500 constituents would need to reclaim their 50-day averages, participation would need to extend into cyclical sectors and medium-sized companies, and index advances would need to occur without relying almost exclusively on megacaps. A genuine broadening of leadership while Treasury yields remain high would show that earnings confidence can overcome the valuation pressure.
Conclusion
The small headline moves are understating the market’s internal strain. The S&P 500’s 0.17% decline to 7,671 and the Nasdaq 100’s 0.21% rise to 30,339 show that large technology companies can still stabilize the benchmarks, but the estimate that only about one quarter of S&P 500 stocks remain above their 50-day averages points to much weaker participation. The strongest working explanation is that multi-year-high Treasury yields are raising the return required from equities and pressing valuations outside a narrow group of highly profitable leaders. Pre-inflation caution likely reinforces that pressure, while ordinary sector rotation explains only part of the divergence. This is not yet proof of a major reversal, but it is an early warning that the market has become more concentrated and therefore more vulnerable. The decisive evidence will come from breadth: either participation recovers across sectors and company sizes, or the headline indices eventually acknowledge the weakness already visible underneath them.