
Smart TLAP Indicators for Finding Forex Entry Points

Many beginner Forex traders start their market analysis by looking at the price chart. They search for support and resistance levels, candlestick patterns, or indicator signals before deciding whether to enter a trade.
However, this approach does not always provide the full picture of what is happening in the market.
Before searching for an entry point using technical analysis, it helps to understand where it actually makes sense to look for a trading opportunity. This is where data from one of the world's largest Forex brokers, OANDA, becomes valuable. OANDA publishes anonymous aggregated data showing what thousands of its clients are doing—where they open positions, place stop-losses, and set limit orders.
This is the data that TLAP indicators are built on.
It is important to understand that TLAP indicators are not a replacement for technical analysis. Instead, they help identify price zones where the probability of a significant market move is higher than usual. Once these high-potential areas have been identified, traders can turn to the price chart and look for confirmation using support and resistance levels, candlestick patterns, trend lines, or any other technical analysis tools they prefer.
A Smart Approach to Using TLAP Indicators
The process can be divided into two simple steps:
Identify high-probability price zones using TLAP indicators.
Find the optimal entry point using technical analysis.
Following this sequence helps filter out low-quality trading opportunities, reduce random entries, and make your trading approach more consistent and disciplined.
Stage 1. Determine the Overall Market Sentiment
The first step is to analyze the open positions indicator. It shows the ratio of long and short positions held by OANDA clients, allowing you to quickly assess the prevailing market sentiment.
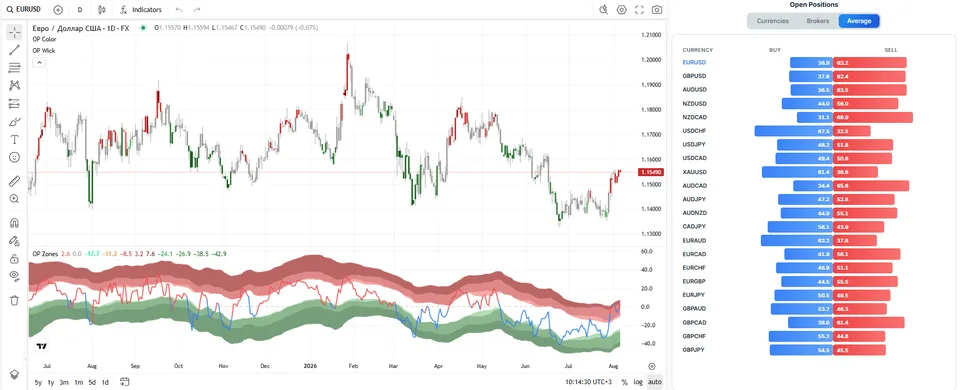
For example, if most traders are holding long positions, the overall market sentiment is bullish. If the majority are holding short positions, sentiment is bearish.
However, experienced traders don't focus only on the long-to-short ratio itself—they pay close attention to its extreme readings. When an overwhelming majority of market participants are positioned in one direction, the market often becomes vulnerable to a move in the opposite direction. This is because many traders may eventually be forced to close their positions, creating additional momentum for a reversal.
The traders in profit indicator complements this analysis by showing what percentage of OANDA clients currently have profitable open positions.
This provides additional insight into the market. When an unusually large percentage of traders are already in profit, the current trend may be approaching exhaustion as traders begin to lock in gains. Conversely, when only a small percentage of positions are profitable, the market may still have room to continue its current move.
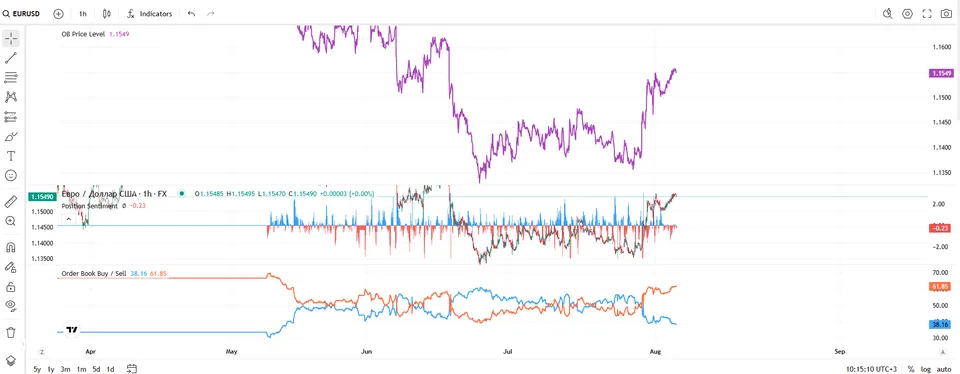
Using these two indicators together provides a more complete view of market sentiment. The Open Positions indicator shows which side of the market the majority of traders are on, while the Traders in Profit indicator reveals how successful those positions currently are.
Viewed together, they help you determine whether the crowd is merely committed to one direction or is also sitting on substantial unrealized profits. This additional context makes it easier to assess the current market balance and identify high-probability areas before moving on to technical analysis and searching for a precise entry point.
Stage 2. Finding Liquidity Zones
The next step is to identify areas where the most active price movement may occur. Two tools are used for this.
The first is the crowd stop-loss indicator. It shows where a large number of traders have placed protective orders.
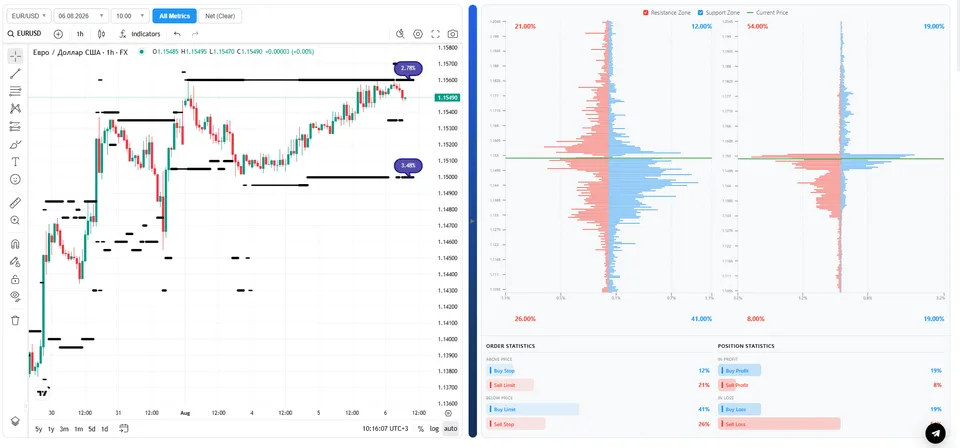
Such zones often become a source of increased liquidity. When these levels are reached, the execution of a large number of stop-losses can accelerate price movement.
The second tool is the limit orders indicator. It displays areas where market participants have placed buy or sell orders in advance. These are the exact zones that often become potential support and resistance levels.
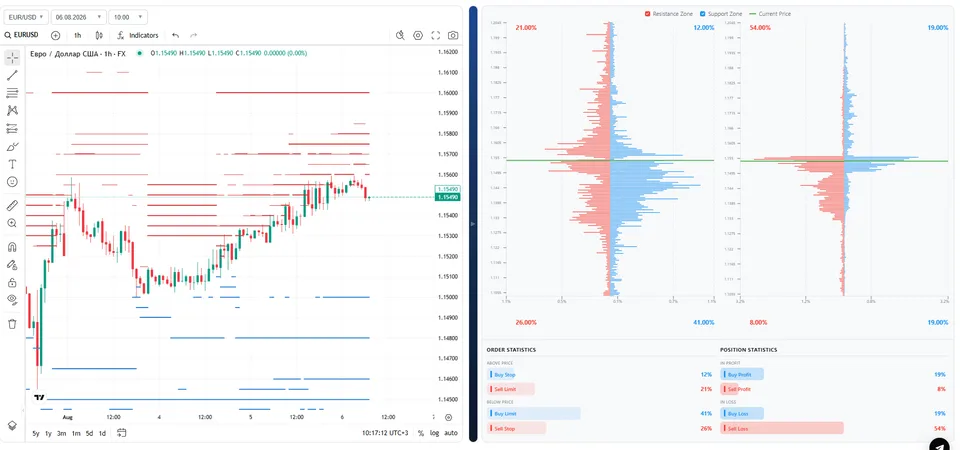
After analyzing these indicators, the trader already understands:
where liquidity is concentrated;
where movement is likely to accelerate;
which price areas may trigger a market reaction.
Stage 3. Check Data Relevance Through the Order Book
The market is constantly changing, so it is important to make sure that the identified zones remain relevant. The Order Book is used for this. It shows the current structure of limit orders and helps assess whether large volumes are still present near the level of interest.
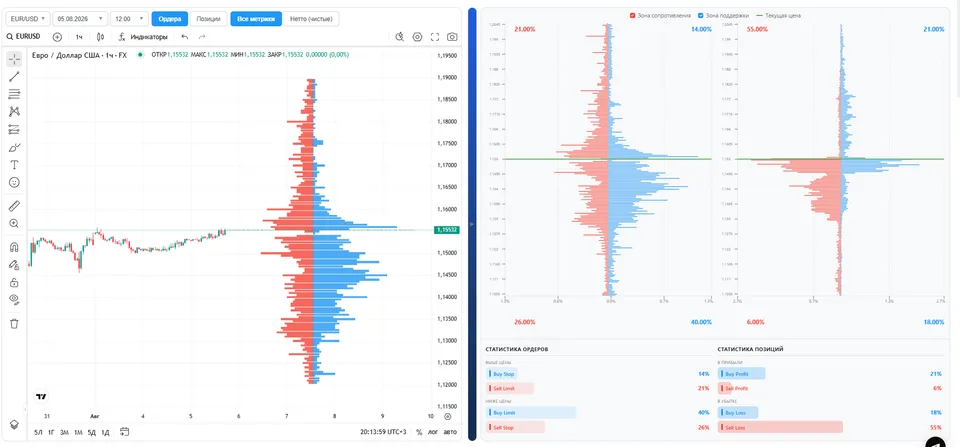
When analyzing it, it is worth paying attention to several points:
whether large orders remain in place;
whether new volumes appear;
whether limit orders are removed before price approaches;
whether the imbalance between buyers and sellers remains.
If liquidity begins to disappear, the initial trading scenario may lose relevance.
Stage 4. Confirm the Strongest Zones Using MAGMA
The final stage of analysis is the MAGMA indicator. It combines data on open positions, stop-losses, and limit orders, automatically highlighting the most significant areas on the chart.
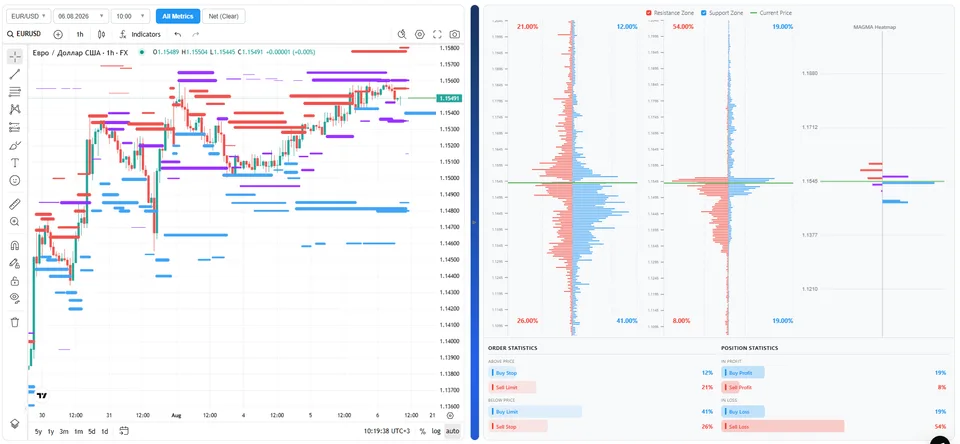
MAGMA helps quickly filter out less interesting levels and focus on those market areas where the probability of a strong reaction is highest. Each level is assigned its own strength score. The higher the value, the more factors confirm the importance of this price zone.
The most important innovation highlighted by the MAGMA indicator is tracking potential breakout zones. This does not exist anywhere, or almost anywhere else.
An experienced Forex trader can start using this indicator right away. But to apply it fully, it is necessary to learn how to interpret its data separately.
Stage 5. Move on to Technical Analysis
After analyzing the TLAP indicators, the second stage of work begins. Now the trader opens the price chart and looks for confirmation of the trading idea. For this, you can use:
support and resistance levels;
trend lines;
candlestick patterns;
chart patterns;
trend and momentum indicators;
multi-timeframe analysis.
If technical analysis confirms the scenario, the probability of a successful trade becomes higher than when using only one analysis method.
Example of Step-by-Step Analysis
Suppose that on the EUR/USD currency pair, most traders are holding long positions. A large cluster of sellers' stop-losses is located near the current price. Nearby there is a zone of large limit orders. The Order Book shows that large volumes remain near this level. MAGMA highlights this area as one of the strongest.
In the image below: MAGMA with two technical analysis indicators, SuperTrend and MACD.
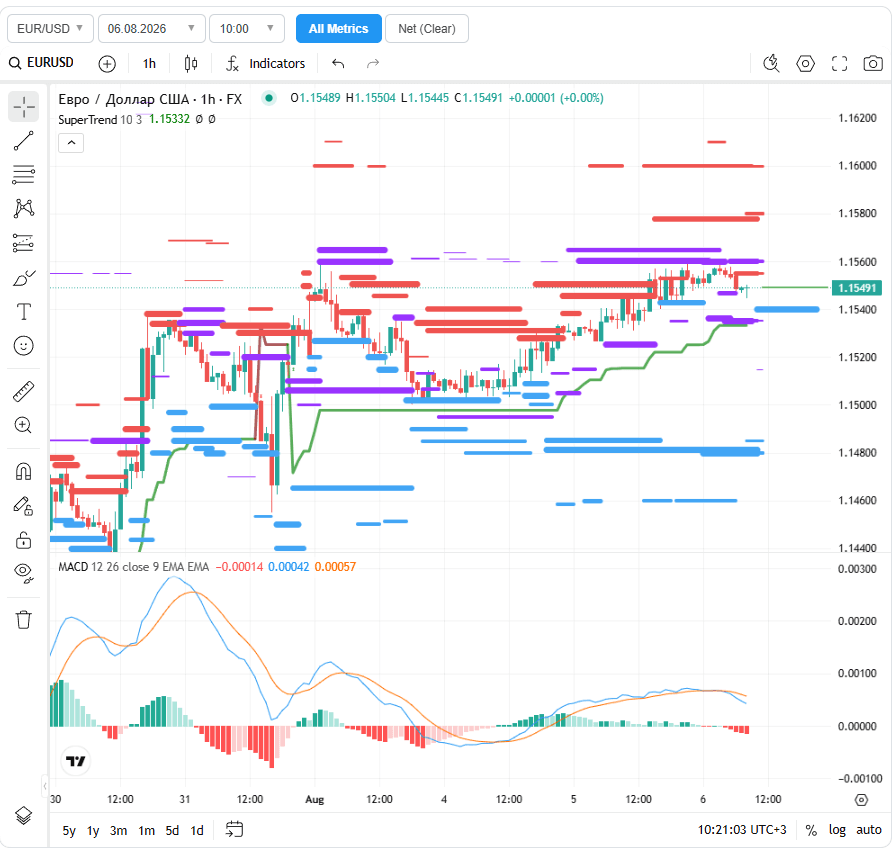
In addition to the cluster of short limits, the MAGMA indicator shows the presence of a potential breakout zone literally just above the current price.
At the same time, the price is above SuperTrend, which indicates a likely continuation of the upward movement, possibly through a small correction.
MACD is above the zero line. This indicates that the medium-term momentum remains bullish. Moreover, the MACD line is above the signal line. This means that buyers still retain control over the movement.
The MACD histogram is positive, confirming the presence of upward momentum. The latest histogram bars are low, and the distance between the MACD and Signal lines is small. This suggests that upward momentum remains, but it is no longer as strong as at the beginning of the movement.
After qualitative analysis, the trader moves on to analyzing the candlestick pattern. The current formation hints that the trend may continue.
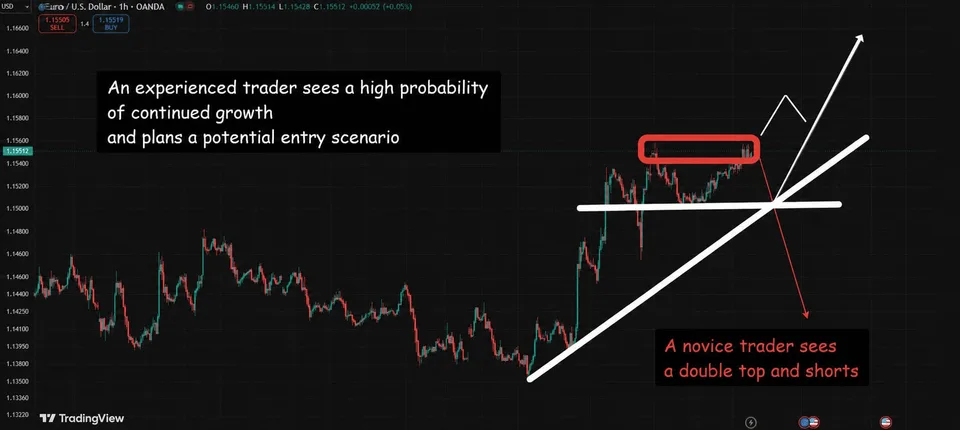
Thus, an experienced trader will think three times about whether he should look for a sell from the double top. And maybe even four times.
While a beginner starts shorting from the double top, an experienced speculator will wait either for a breakout and look for buys on the breakout test, or will check the ascending trend line (right here is also the SuperTrend indicator line).
Common Mistakes Beginner Forex Traders Make
One of the most common mistakes beginners make is searching for an entry point based solely on candlestick patterns or technical signals without first understanding the broader market context. Another common mistake is relying on a single indicator—for example, entering a trade simply because most traders are long or because a large cluster of stop-loss orders has formed.
No single tool provides a complete view of the market. Each indicator highlights a different aspect of market behavior, and the highest-probability trading opportunities emerge when multiple sources of information point to the same conclusion. Combining market positioning data with technical analysis helps filter out weaker setups and leads to more informed trading decisions.
FAQ

What Does the Open Positions Indicator Show?
The indicator displays the ratio of buyers and sellers in the market. It helps assess market sentiment, determine possible extremes, and use them as an additional filter when searching for an entry point.
Why Analyze Other Traders' Stop-Losses?
Stop-losses show areas of liquidity concentration. When such zones are reached, price often accelerates its movement due to the mass execution of protective orders.
How Do Limit Orders Differ from Stop-Losses?
Limit orders are requests to buy or sell at a preset price. They often form potential support and resistance levels. Stop-losses, on the contrary, become market orders after a certain price level is reached.
What Does Order Book Show?
Order Book displays the current structure of limit orders and helps assess market depth. With its help, you can see whether new large volumes are appearing or, conversely, liquidity begins to disappear before a price move.
What Is the MAGMA Indicator Needed For?
MAGMA combines data on open positions, stop-losses, and limit orders into a single system. The indicator automatically highlights the most significant price zones and helps find potential entry points faster.
Can You Open a Trade Based on Only One Indicator?
It is not recommended. The most reliable signals appear when several tools confirm the same trading idea. For example, open positions show market sentiment, stop-losses show liquidity zones, Order Book shows the presence of volumes, and MAGMA confirms the strength of the level.
Are OANDA Data Suitable for Beginner Traders?
Yes. Even without a deep understanding of market microstructure, OANDA data help you see where the positions and orders of market participants are concentrated. This allows you to make more informed trading decisions.
Tasks for Beginner Forex Trader
Understanding and Review
Write a brief summary of the six key takeaways from the FAQ, using your own words (one takeaway for each question).
Create a quick reference table titled "What Each Tool Shows" with the following columns:
Tool
What It Shows
Why It Matters for Trading
Include these tools:
Open Positions
Stop-Losses
Limit Orders
Order Book
MAGMA
Create a Reverse FAQ by turning each FAQ answer into a question. Use the original FAQ questions afterward to check whether your new questions cover the same ideas.
Analysis and Critical Thinking
Build a cause-and-effect chain for the following trading scenario:
Extreme Long/Short Ratio → Stop-Loss Cluster → Price Acceleration → Order Book Reaction → MAGMA Confirmation
Explain each step in one or two sentences, describing why one event leads to the next. The goal is to understand how these tools complement one another.
Find three places in the text where the principle of not relying on a single trading signal is emphasized. For each example, describe a realistic trading setup where multiple signals work together to support a trading decision. The goal is to reinforce the importance of confluence.
Separate the statements in the text into Facts and Recommendations.
Facts describe what a tool technically displays or measures.
Recommendations explain how traders should use the tool in practice.
Present your findings as two separate lists with a brief explanation for each item.
Practical Application
Model a situation in which different tools produce conflicting signals. For example, OANDA data shows an extreme Long bias, while MAGMA does not identify the area as a strong level.
Write a 3–4 step action plan explaining how a trader should respond. The goal is to learn how to deal with conflicting market signals.
Describe two common beginner mistakes that contradict the principles explained in the FAQ. For each mistake, explain how it could result in a losing trade. The goal is to reinforce the correct methodology through counterexamples.
Write a short market analysis (5–7 sentences) for EUR/USD. First, describe the market using TLAP indicator data (market sentiment, liquidity, and key price levels). Then explain how technical analysis (support and resistance, candlestick patterns, or trend structure) either confirms or challenges that view. The goal is to connect market positioning with traditional technical analysis.