
RSI and MACD Divergences in Trading: A Simple Guide to a Reliable Tool

Divergence in trading occurs when price and momentum begin to contradict each other. Price is still moving in the same direction, but the speed and strength of its movement are already changing.
Traders most often use divergences to identify a possible reversal, correction, or trend continuation. Experts particularly emphasize that divergence should be considered in the context of price action, market structure, and support and resistance levels.
The most popular indicators for identifying divergences are RSI and MACD: they are time-tested and available in every trading terminal.
Note that the appearance of divergence between price and an indicator does not guarantee a reversal. During a strong trend, an oscillator may show several divergences before price changes direction.
Types of RSI Divergence in Trading

Technical analysis distinguishes four main types of divergence: regular bullish, regular bearish, hidden bullish, and hidden bearish.
The main difference between the various types of divergence in trading is easy to remember:
Regular divergence signals a possible reversal.
Hidden divergence indicates a possible trend continuation.
Professional Western traders often use the Class A, Class B, and Class C classification to distinguish divergences by how pronounced they are.
Now let us briefly discuss the types of divergence.
Bullish Divergences

Regular Bullish Divergence
If price makes a new low, while the RSI indicator shows a higher level relative to its own low, a classic bullish divergence forms.
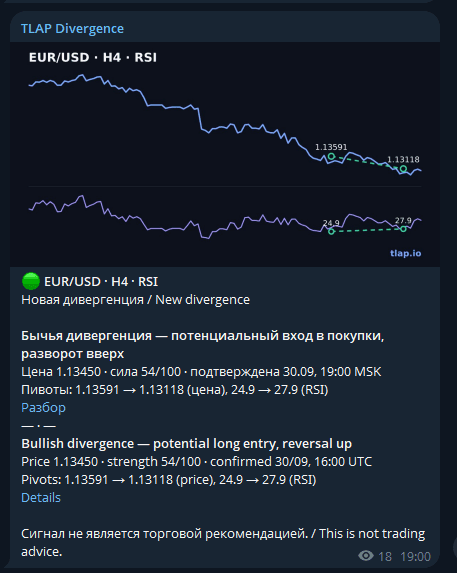
This configuration of price and indicator behavior means that downward momentum is weakening. In this case, bullish divergence is used to identify a potential upward move.
Hidden Bullish Divergence
Price establishes a higher low without making a new low, while the indicator makes a new low. Traders usually view hidden bullish divergence not as a reversal signal but as an opportunity for the uptrend to continue after a correction.
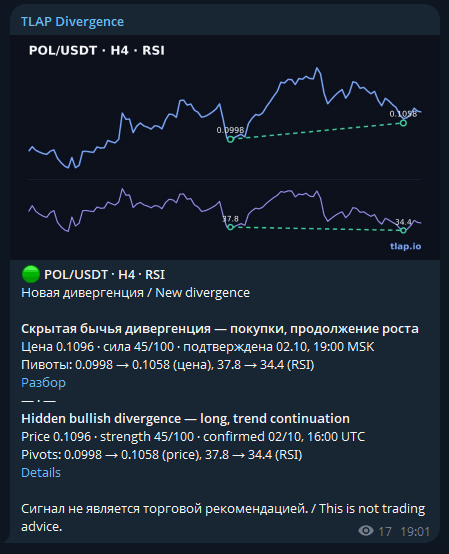
Within a hidden bullish divergence, a sharp indicator pullback accompanied by the formation of a local reversal pattern may suggest that the pullback is likely ending.
Bearish Divergences

Regular Bearish Divergence
If price makes a new high while the indicator—RSI, MACD, or any other—shows a lower level, a bearish divergence forms. What does this look like?
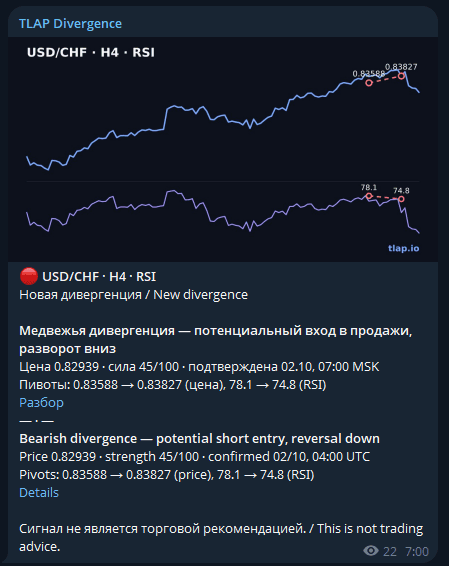
Price establishes a new high, while RSI or MACD signals a lower high. This means buyers managed to push the price higher, but the current upward momentum does not confirm the new extreme.
This is a typical sign of bearish divergence and may indicate an impending correction or downward reversal.
Hidden Bearish Divergence
Price creates a lower high, while the indicator creates a higher one.
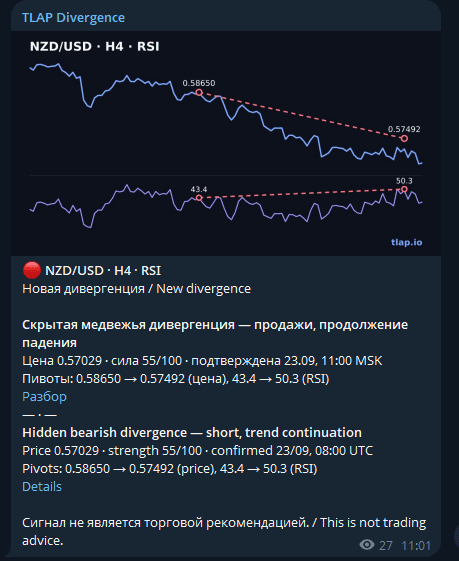
This divergence is typical of a correction within a downtrend and helps determine whether the decline will continue.
Extended Divergence
Extended divergence is a type of discrepancy between price movement and a technical indicator.
Its key feature is that similar highs or lows at the same level form on the price chart, creating a pattern such as a “double top” or “double bottom,” while the indicator’s extremes successively decline or rise.
Extended bearish divergence: price-chart highs are at approximately the same level, while the indicator’s extremes successively decline. This suggests that selling pressure is weakening and price will probably continue to fall.
Extended bullish divergence: price-chart lows are at approximately the same level, while the indicator’s extremes successively rise. This indicates weakening selling pressure, and price will probably continue to rise.
RSI Divergence: How to Identify and Trade the Signal
RSI is a momentum oscillator created by J. Welles Wilder. The standard RSI period is 14. This indicator fluctuates from 0 to 100. Values above 70 are usually considered the overbought zone, while values below 30 are considered the oversold zone.
RSI divergence becomes particularly interesting near significant levels. For example, bullish divergence at daily support has a different meaning from a similar configuration in the middle of a broad sideways range.
How to Trade Classic RSI and Price Divergence
Novice traders often make the mistake of opening a trade immediately after a divergence appears.

A better approach is to follow this process:
Identify an RSI divergence.
Wait for confirmation from price.
Open a trade.
Set a stop-loss.
Determine the target.
This approach will help reduce risks and improve trading effectiveness.
How Do You Open a Long Position on Bullish RSI Divergence?
First, price must create two lows, with the second low below the first. At the same time, RSI must form a higher low.
After that, it is advisable to wait for confirmation on the price chart itself. This could be:
A breakout of the local high between the two lows.
A breakout of the local downward trend line.
The appearance of a reversal candlestick pattern.
Price holding above the nearest resistance level.

The stronger this confirmation is, the later you will enter the trade. However, the probability of buying during an ongoing decline will also be lower.
Where should you place a stop on bullish RSI divergence?
For a long position, the stop is placed below the second price low. This level is an important threshold. A breakout of the low invalidates the original bullish-divergence scenario.
The stop does not have to be placed exactly below the extreme. During high volatility, market noise should be considered to avoid the position closing prematurely because of a random breakout—a liquidity sweep of buyers.
How Do You Open a Short Position on Bearish RSI Divergence?
With bearish divergence, price reaches a new high while RSI forms a lower one.
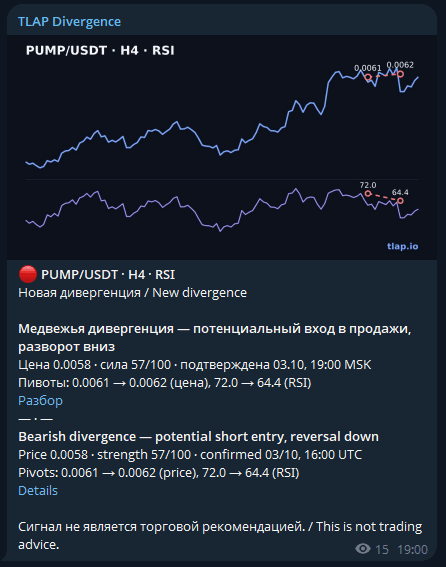
After the second extreme, it is advisable to wait for:
a breakout of local support;
a bearish reversal candle;
a breakout of the local upward trend line;
or another signal that the short-term structure has changed.
The stop-loss is placed above the second high.
This method allows divergence to be used as a filter and price as the signal for entering a trade.
Hidden RSI Divergence and Trend Trading
Unlike classic divergence, hidden divergence does not signal a trend reversal but indicates its continuation.
With hidden bullish divergence, price makes new highs while RSI falls. After the correction, the uptrend continues to form higher lows, while RSI drops more deeply.

In this case, you can wait for price to reverse upward and break the nearest local high before entering a long position.
The stop-loss is placed below the latest higher low.
With hidden bearish divergence, price falls while RSI rises. After the correction ends, the downtrend continues to form lower highs, while RSI rises higher.
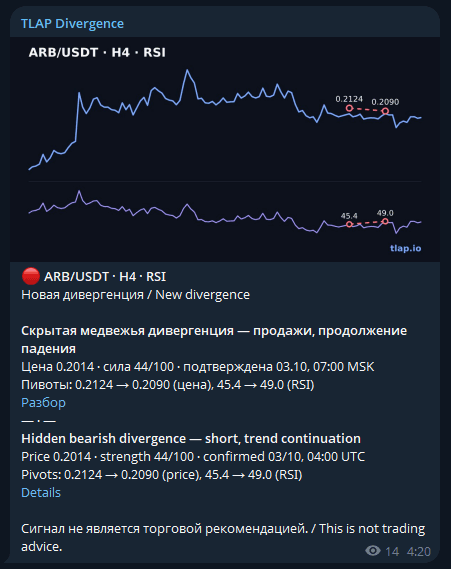
You can look for a short entry after the corrective rise ends.
The stop-loss is placed above the latest lower high.
It is important to understand the direction of the higher-timeframe trend before using hidden divergence in trading.
How to Trade Extended RSI Divergence Properly
Extended divergence is common in modern markets. This refers to double and triple tops.
Extended divergence does not indicate an immediate price reversal. It signals a retest of the same level but with different momentum. Therefore, it should be used not as a standalone signal but in combination with other elements:
Extended divergence
Level
Price confirmation
This is particularly important because divergences can persist for a long time despite a strong trend.

Extended Bullish RSI Divergence
Suppose price approached support twice:
Bottom 1 = 100
Bottom 2 = 99.8
Structurally, these levels are almost identical. At the same time, RSI shows:
Low 1 = 24
Low 2 = 34
Price tests support again, but RSI no longer shows the same strength from sellers.
Where to look for a long entry
Trading extended divergence can be divided into three levels of aggressiveness:
1. Aggressive entry.
Buy on the second test of support when confirmed divergence appears. This is an attempt to catch the reversal.
Advantage: a small stop-loss.
Disadvantage: price has not yet shown that it is reversing.
2. Moderate option.
Wait for a reversal candle near the second low:
bullish engulfing pattern;
pin bar;
strong bullish candle;
false breakout of support followed by a return above it.
Only then do we open a long position.
3. Conservative option.
The most interesting option for systematic trading. It works as follows.
Price forms a second bottom, while RSI shows divergence. We then wait for a breakout of the intermediate high, which is the buy signal. After the intermediate high is broken, it can sometimes be more advantageous to look for an entry on a retest of the broken level than to buy the first large candle.
Why is it necessary to wait for a breakout of the local high between the two lows? Because until it is broken, this may simply be sideways movement.
The breakout confirms not only the divergence but also a change in the short-term structure.
Where should you place a stop on extended bullish divergence? The basic principle is that the stop should be placed below the lower of the two price extremes.
If the first low = 100 and the second = 99.8, the stop should be below 99.8, not below the first low.
A small buffer below the level is also needed because price may make a false break through the double bottom.
Extended Bearish RSI Divergence

Here we see the mirror image. Price shows two practically equivalent price highs, while RSI shows a lower high at the second price extreme.
For example: prices at the double top are 120 and 120.3, while RSI values are 78 and 66.
This is a clear situation in which price has failed to overcome resistance, while RSI indicates declining momentum.
How do you open a short position, and where should you place the stop? The same logic as for a double top is used here, but with a bearish reversal pattern taken into account.
Does RSI Below 30 or Above 70 Strengthen a Divergence Signal?
The 30/70 zones are not required for divergence. However, RSI below 30 at the first low makes the bullish scenario more attractive, while RSI above 70 at the first high strengthens the case for a bearish scenario.
Nevertheless, you should not blindly follow the rules “sell when RSI is above 70” and “buy when RSI is below 70.” During a strong uptrend, RSI may remain in the overbought zone for a long time. Similarly, a strong downtrend may keep RSI near or below 30 for a long time.
RSI has a fixed scale of 0–100, allowing the analysis to be refined.
For long positions, it is particularly important when the first RSI low is near 30 or below and the second is significantly higher. For example, RSI values of 24 and 37 while price forms a reversal. The same applies to selling: RSI values of 78 and 65 while price shows a double top.
But this is an additional filter, not a mandatory condition. RSI can also show divergence at values of 45–55.
MACD Divergence: How to Identify the Signal
MACD is an indicator created by Gerald Appel.
MACD is a lagging indicator. In sideways markets, it often produces false signals. Experienced traders therefore recommend filtering its signals using other methods: volume, levels, or other oscillators such as RSI.

The indicator’s standard settings include the parameters 12/26/9.
The MACD line is calculated from the difference between fast and slow exponential moving averages (EMAs). The signal line is a smoothed MACD value. The MACD histogram shows the distance between the MACD line and the signal line.
Unlike RSI, MACD does not have a fixed range of 0–100 and is not primarily intended to identify overbought or oversold conditions. Its strength lies in analyzing momentum dynamics and the interaction of moving averages.
Bullish MACD Divergence
Price falls to a new low while MACD shows a higher one. This indicates that sellers are weakening: price is declining, but negative momentum is losing strength.

It is best to buy when the following occurs:
MACD turns upward.
Local resistance is broken.
We buy.
For an aggressive entry, focus on the price reaction near the second low.
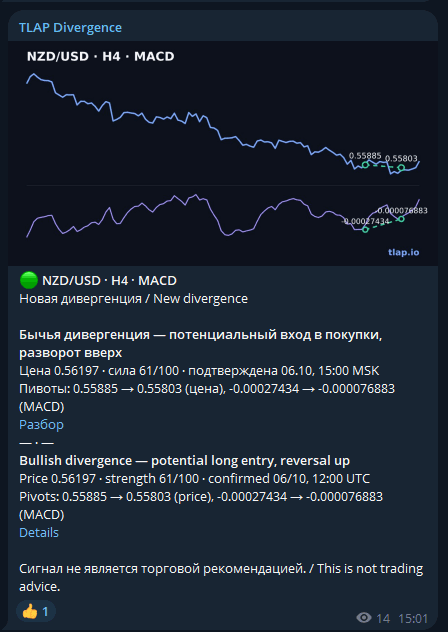
A conservative approach involves waiting for a breakout of the intermediate high. An upward crossover of MACD and the signal line provides an additional signal.
The stop-loss can be placed below the second price low.
Bearish MACD Divergence
Here the situation is reversed.
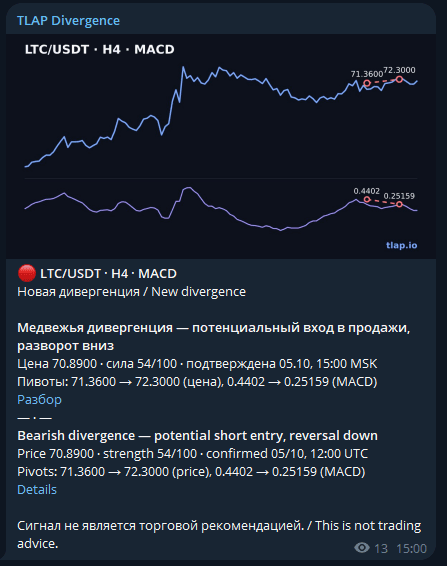
Price has reached a high, but MACD does not confirm it. For a short entry, it is better to wait for price to weaken and break the nearest support level. A downward crossover of MACD and the signal line may provide an additional signal.
We place the stop-loss above the second price high.
Hidden Divergences

In addition to classic divergence, where price reaches a new extreme but the histogram does not, indicating weakness, hidden variants also exist.
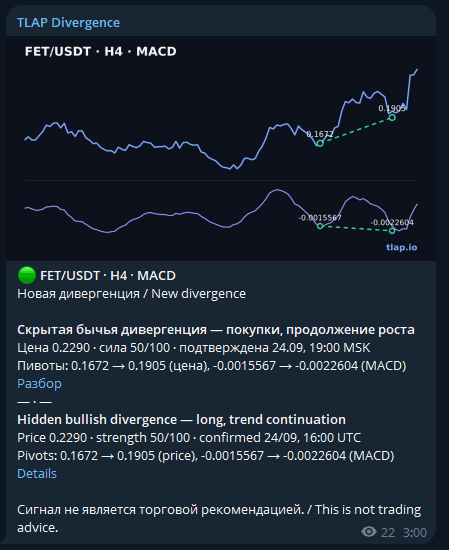
Hidden bullish divergence occurs when price lows rise during an uptrend while MACD histogram lows decline. This is not a reversal signal but confirmation that the trend will continue.
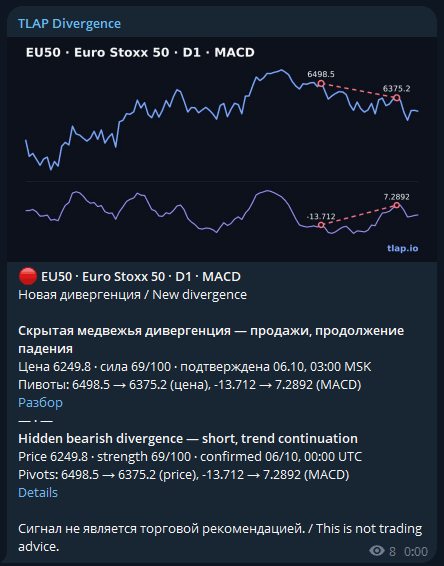
Hidden bearish divergence appears during a downtrend when price highs decline while MACD histogram highs rise. This also indicates continuation of the move.
Peak-Trough Divergence
The key here is the presence of clearly defined extremes (peaks or troughs).
Bullish version: the MACD line moves lower, creating a new low. Meanwhile, the MACD histogram rises, showing a higher low.
Bearish version: the MACD line moves higher, forming a new high. The MACD histogram falls, showing a lower high.
For a reliable trough signal during an uptrend or peak signal during a downtrend, it is important that these points be clearly visible. The clearer these points are and the longer the divergence lasts, the stronger the signal.
Peak-trough divergence usually forms over longer intervals—for example, from a couple of weeks to several months on a daily chart—than slant divergence, which occurs more often over shorter periods.

Slant Divergence
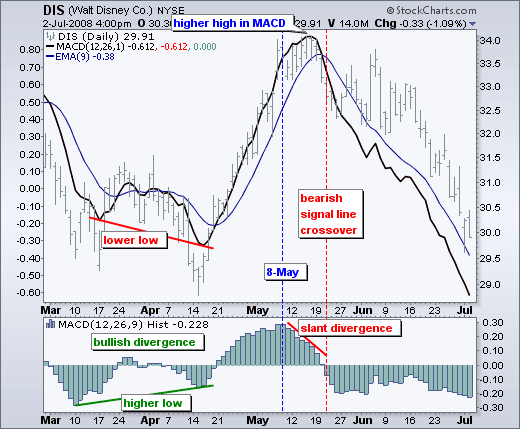
In this case, there are no clearly defined peaks or troughs. Instead, you see a smooth, sloping trend in one direction—up or down—that creates the divergence with price.
Bullish (upward) slant. The MACD line moves downward and forms a lower low, while the histogram narrows and shifts toward the zero line (upward).
Bearish (downward) slant. The MACD line moves upward and draws a higher high, while the histogram narrows and moves downward away from zero.
Essentially, this slant reflects convergence between the MACD line and the signal line—momentum is weakening.
Slant-divergence signals are considered slightly less reliable than peak-trough divergence signals.
Zero-Line Crossover
When the histogram bars move from the negative zone into the positive zone—from bottom to top—this may indicate strengthening bullish momentum. Conversely, crossing the zero mark from top to bottom is often interpreted as a sign of increasing bearish momentum.
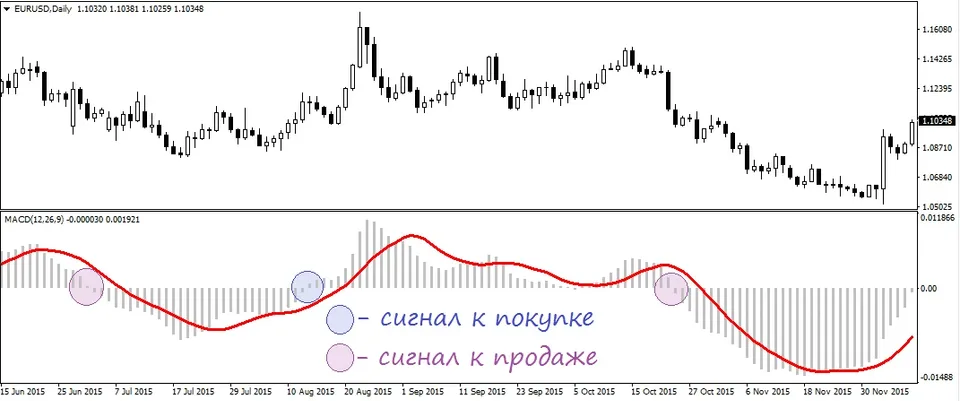
However, it is worth remembering that the crossover itself is a fairly lagging signal. It is best used in combination with other indicators, such as the trend direction on a higher timeframe.
MACD Histogram Contraction Near the Zero Level
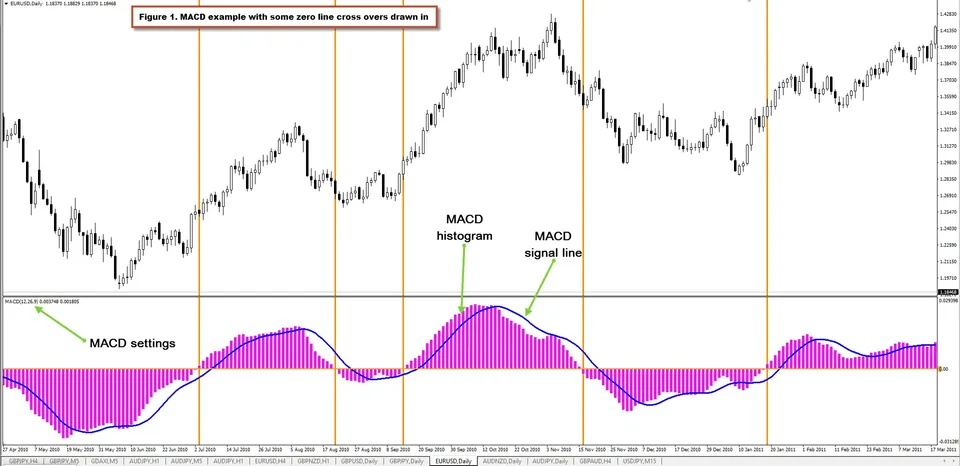
In this case, the MACD histogram shows the difference between the MACD line and the signal line. When it narrows toward zero, the MACD line and signal line are approaching each other and the gap between them is shrinking.
Because the MACD line reflects the difference between two moving averages—fast and slow—its convergence with the signal line indicates weakening momentum in the current trend.
If the histogram narrows and approaches zero from above—that is, the MACD line was above the signal line but is now beginning to decline—this is often interpreted as a slowing uptrend. Bullish momentum may be weakening.
If the MACD line drops below the signal line and then rises, this may indicate that the downtrend is weakening.
It is important to understand that histogram contraction is not a trend-reversal signal. It is merely a sign that current momentum is weakening.
Traders often treat narrowing as a signal to examine the chart: the lines may cross or change direction soon. However, relying only on a narrowing histogram to enter a trade is risky. It is better to wait for additional confirmation, such as candlestick patterns, support and resistance levels, or signals from other indicators.
Local Histogram Extremes
Pay attention to peaks and troughs on the chart.
If the histogram forms a local low while remaining above zero, this may indicate that the uptrend is weakening. Similarly, the appearance of a new local high in the negative zone, closer to zero, is sometimes interpreted as a weakening downward move.
However, if the chart reverses after such an extreme and rises again in the positive zone or falls in the negative zone, this may signal that the trend is resuming.

Bar-Height Dynamics
Watch for changes in the bars.
If the height of the bars rises successively in one direction, this indicates strengthening momentum.
If the height of the bars gradually decreases, even if they are still in the positive or negative zone, this is a sign that momentum is weakening.
RSI or MACD: Which Divergence Is Better?
RSI and MACD are indicators that measure price-related momentum, but they do so in different ways.
MACD is a lagging indicator. In a sideways market, it often produces false signals. Strictly speaking, RSI is also lagging, like MACD. In practice, however, it is considered more “leading.” This makes sense, but RSI has a drawback: because of its greater sensitivity, it produces errors more often. Sharp price movements can quickly send the RSI line into an extreme zone even if the trend has not yet changed.
It is impossible to say categorically that RSI divergence is better than MACD divergence or vice versa.
A more interesting situation occurs when RSI and MACD simultaneously show divergence during the same price move. This coincidence can serve as an additional filter, but it does not guarantee twice the probability of success because both indicators are calculated from price and are not completely independent sources of information.
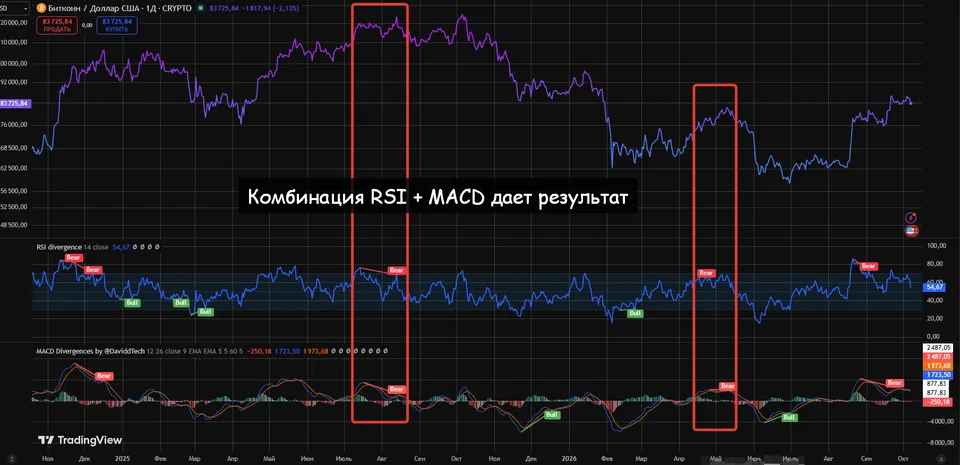
In other words, combining RSI and MACD divergences reinforces their respective signals and makes it possible to identify an entry point more reliably.
RSI (14) reacts faster to changes in movement —this is useful for assessing extreme values and identifying signals early.
MACD (12/26/9), by contrast, smooths movement more strongly and accounts for the trend component of moving averages, which can delay the signal.
One way to combine the signals is to rely more on RSI signals when a pullback within an impulse is likely ending, while MACD is reliable for confirming momentum and opening additional trades in the direction of the impulse.
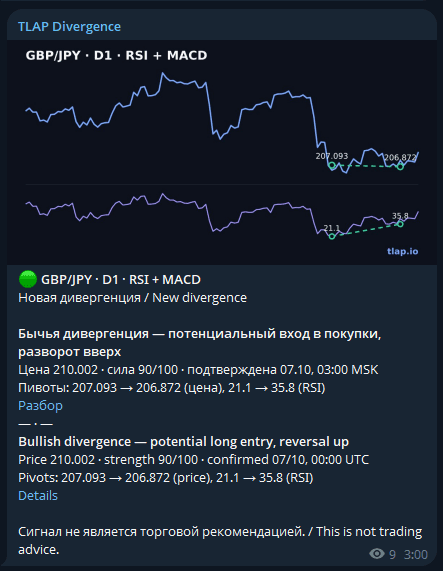
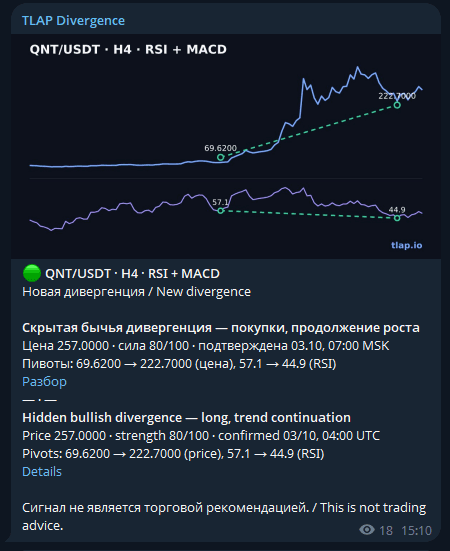
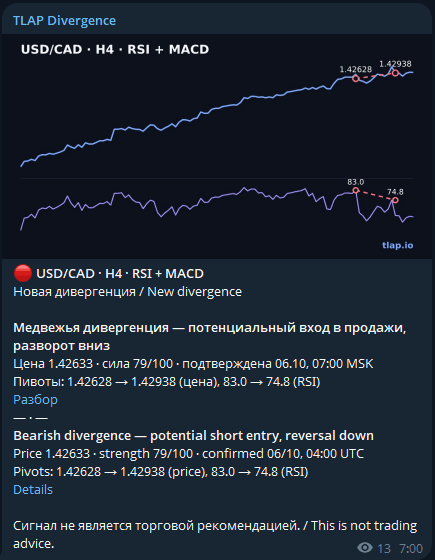
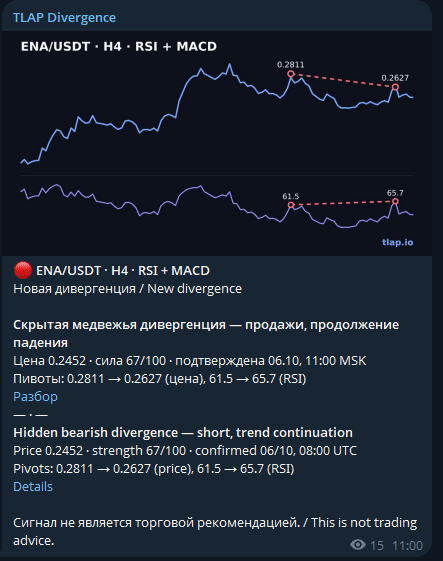
For most trading systems, it is sensible to separate signal detection from the moment of entry. We have already discussed above where to look for entry points in different situations. But let us highlight the main rules:
The more significant the pivots, the more useful the signal. To confirm significance, monitor the higher timeframe, trend, support and resistance levels, current volatility, and the nearest important news.
Divergence near a strong support or resistance level is considerably more interesting than the same divergence in the middle of a range.
Entering while divergence is forming is dangerous. It is better to obtain an additional signal: a structural breakout, reversal candle, or breakout of a trend line or important level.
The nearest reasonable target should be sufficiently far from the entry point. The practical TLAP system uses a benchmark of no worse than 1:2: potential profit should be at least twice the risk taken. A good risk/reward ratio does not make a trade profitable by itself, but it helps filter out situations where there is too little room for movement.
Divergence is not a permanent signal. The farther price moves from the signal entry point, the worse the ratio between risk and potential profit becomes.
Where Can You View RSI and MACD Divergences?
Both RSI and MACD are included in the standard indicator package of virtually every trading terminal.
However, many traders find it easier to view TradingView charts, which offer not only classic oscillators but also various modifications.
How Can You Automate the Search for RSI and MACD Divergences?
There are various ways to automate the search for divergences. Many terminals send signals by email or messenger. However, free versions usually limit the range of instruments available for monitoring, while paid versions are often inaccessible to novice traders.
But there is a solution.
TLAP Divergence is an online RSI and MACD divergence scanner that automatically searches the market for divergences and saves traders from having to review dozens of charts manually. It uses RSI(14) and MACD(12/26/9) for its calculations.
The TLAP Divergence indicator searches for four main types of signals: bullish divergence; bearish divergence; hidden bullish divergence; hidden bearish divergence.
The TLAP Divergence scanner checks 13 currency pairs, the 30 largest cryptocurrencies, and 10 stock indices on the H1, H4, and D1 timeframes.
Data is updated once a minute, but the signals themselves are based only on closed candles.
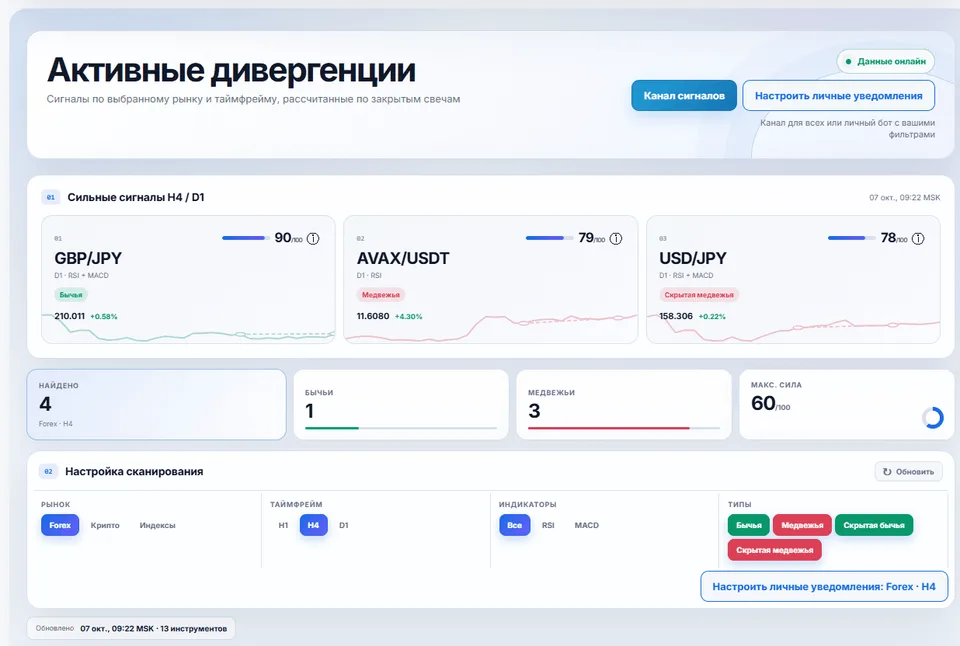
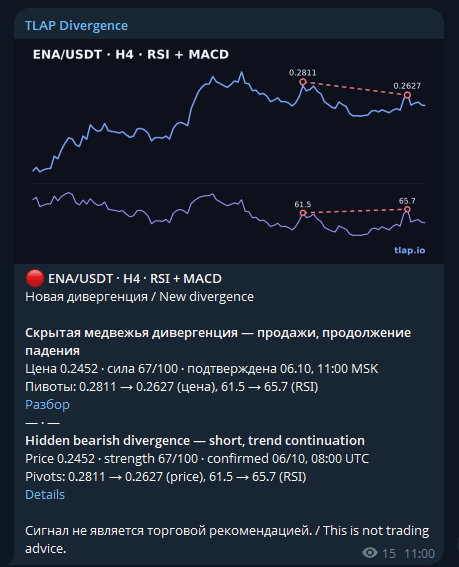
In addition to the online version of the indicator, you can subscribe to the Telegram channel. Almost all examples in the article are taken from the channel’s current feed.
Disclaimer
This material is solely for informational and educational purposes and does not constitute investment, financial, or trading advice. RSI and MACD divergences, including regular, hidden, and extended divergences, do not guarantee a price reversal, trend continuation, or profit.
Traders make all trading decisions independently, taking into account their own trading strategy, acceptable risk level, market volatility, and the characteristics of the specific financial instrument. The rules for entries, stop-loss placement, and target determination presented in the article are examples of technical analysis and do not guarantee a specific result.
Trading currencies, cryptocurrencies, CFDs, futures, and other financial instruments involves the risk of losing some or all invested capital. Historical results and the statistical properties of technical signals do not guarantee similar results in the future.
The TLAP Divergence scanner is intended to search for and perform preliminary analysis of technical signals and does not replace an independent assessment of the chart, market context, and risk management.