
Power Fuse Hybrid Indicator

The latest development by British scientists is an indicator that combines two widely known tools, Bollinger Bands and MACD. Did the authors manage to achieve synergy, and how can the hybrid Forex Power Fuse indicator be used in practice?
First of all, I should note that the process of installing Power Fuse is no different from installing any other indicator. There are no restrictions on pairs or timeframes, they can be any.
After attaching Power Fuse to the chart, we get something like this (all screenshots enlarge on click):
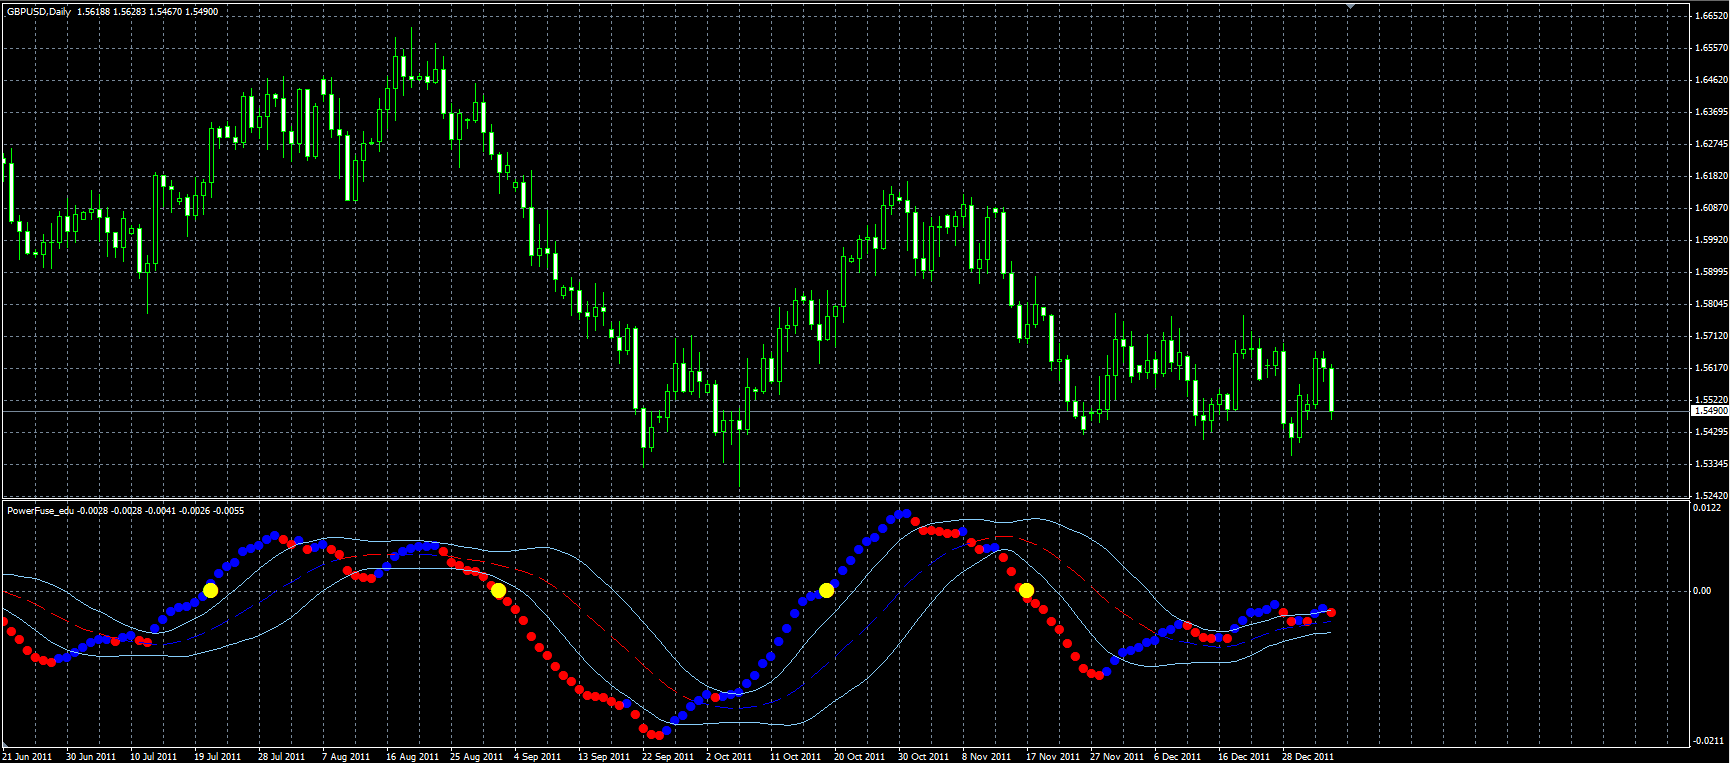
The line of blue, red, and yellow dots represents the MACD, while the two other sky-blue lines are the Bollinger Bands.
Red dots mean that MACD is falling, blue ones that it is rising. Yellow dots appear when MACD crosses the zero mark. The Bollinger Bands look and behave in Power Fuse the same way as in their standard form, which is available by default in MetaTrader 4.
So what are we supposed to do with all this? The main idea of the authors was to find the momentum of a trend, new or old, after consolidation and, accordingly, obtain a signal for a potential market entry.
So, we wait for the Bollinger Bands to narrow, and then enter the market after the MACD dots break through one of the bands. If after the narrowing the MACD breaks the lower sky-blue band, we sell; if it breaks the upper one, we buy. Examples are in the screenshot.
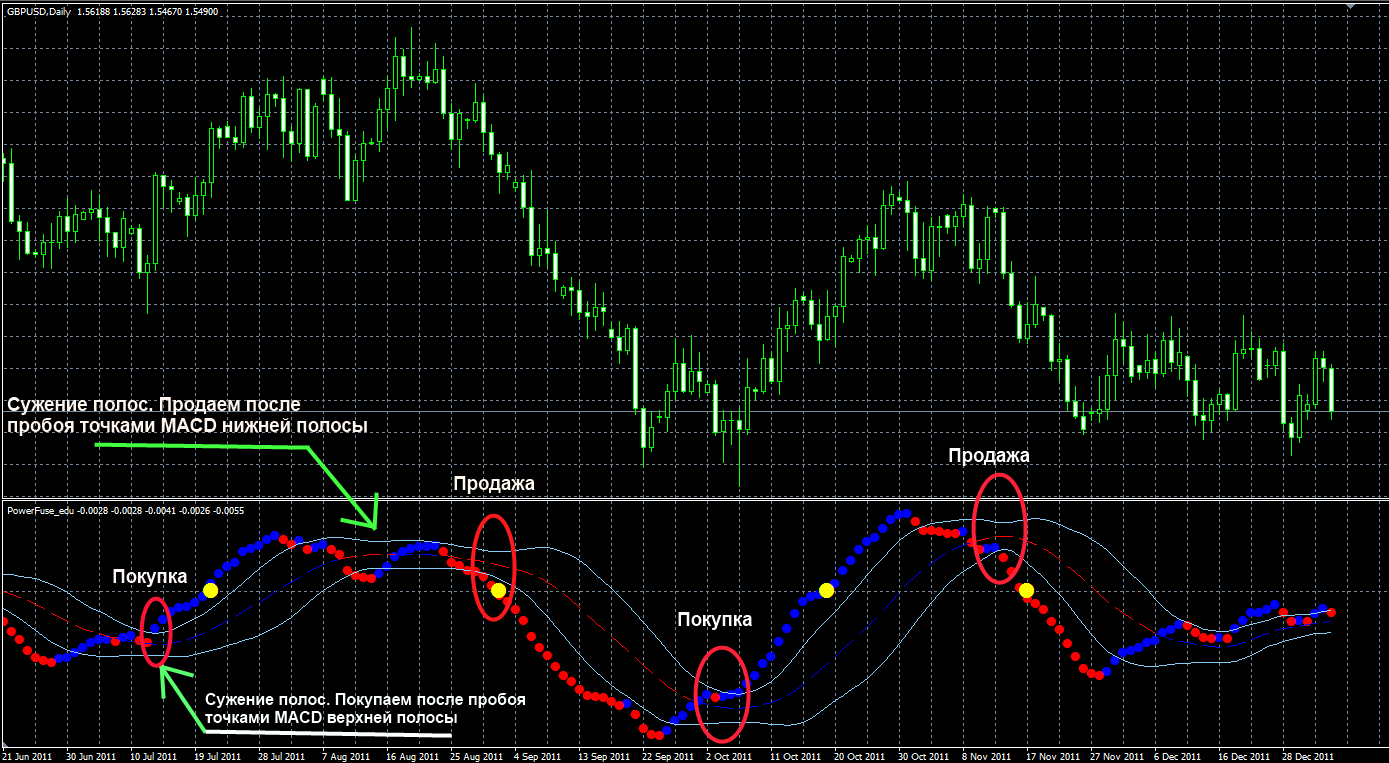
To determine targets and stops, you can use support/resistance levels. Like any indicator, Power Fuse is not a complete trading system and requires signal filtering. Do not forget that.
Download the Power Fuse Indicator

Important! Installation nuances in new builds of Metatrader 4
Best regards, Pavel
TradeLikeaPro.ru