
How to test an indicator in MetaTrader 4

Hello, friends! In build 830 of MetaTrader 4, a function appeared for testing Forex indicators in the terminal's strategy tester. That is, now you can observe the work of any indicator on historical data in "real time," that is, in visualization mode.
Why is this needed? First, to find out whether the indicator's signals "repaint," and second, to evaluate its profitability and usefulness for your strategy without the right side of the chart interfering with a sober assessment.
We will look at how to test an indicator in the instructions below.
To show you the capabilities of this function, we will first test it on a standard indicator included with MetaTrader 4, and then on a modified version of the Traders Dynamic Index indicator, since the tester can be used with standard indicators and any others installed manually.
In the screenshot below, the Traders Dynamic Index indicator:
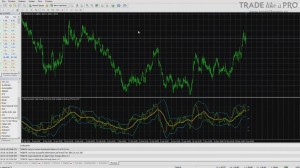
Sometimes problems arise because of bugs in the current builds. You may end up in a situation where you installed an indicator, but it does not test in the tester. At the moment it is difficult to name the main cause of the problem precisely. It probably arises either because the indicators were written before the testing function appeared in MetaTrader 4, or because of shortcomings in the terminal. Perhaps this will be fixed in future versions of the terminal. As when testing expert advisors, the first thing you need to do is load the quote history.
This is done through the menu: "Tools" - "History Center":
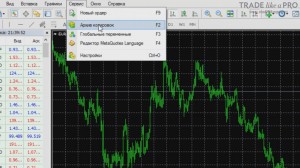
Or you can use the F2 key on the keyboard.
A menu like this with the history of currency pairs appears:
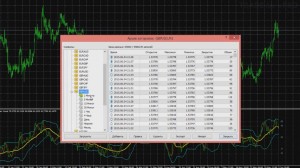
Suppose we need the GBPUSD pair.
Select minute charts to get the most accurate history, and click "Download":
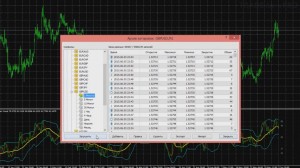
After you have loaded the history, you can close the quotes window and open the "Strategy Tester" window.
To do this, find and click the magnifying glass icon:
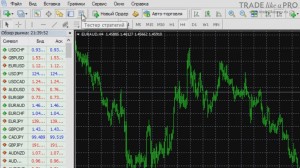
The following menu will open:
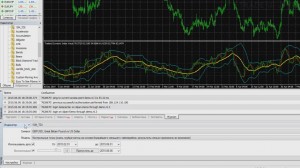
If previously, in the place marked in the screenshot, there was an option to test only expert advisors, now a selection window has appeared where you can choose the type of object to be tested:
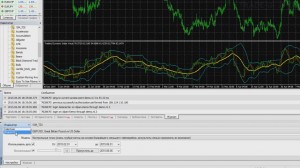
To begin with, let's run a test of some standard indicator, for example, MACD:
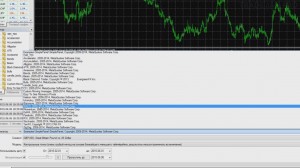
The period can be set to any value. I will set M30:
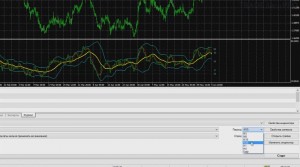
By clicking on "Indicator Properties," we will open its settings for testing:
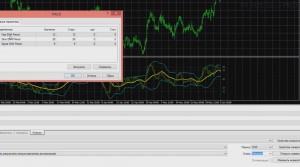
We have the standard settings set. You can change them however is convenient for you.
The "Symbol Properties" window cannot be changed:
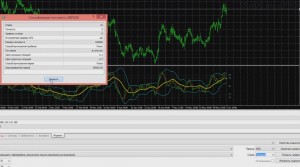
It displays spread data, stop level, swap type, and so on.
When you click the "Open chart" button, in theory, the same visualization chart as during the test should open. Nothing happens in my terminal. Most likely, this is an unfinished feature of the current terminal version. Therefore, if this function does not work for you, do not worry.
When we click "Modify indicator," its code opens:
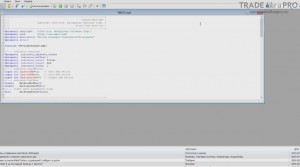
If you have knowledge of MQL programming, then you can edit the indicator. You cannot check the "Optimization" box, because this is an indicator, not an expert advisor.
The "Visualization" option is enabled by default. It cannot be disabled, because there is no point in testing an indicator if we do not see anything on the chart. Next to the "Visualization" option there is a speed slider. It is advisable to set it to a short distance, otherwise during testing the chart will run far ahead at high speed.
In the "Use date" option, check the box and select the interval on which we want to test the indicator:
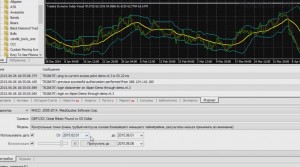
After everything is configured, click "Start":
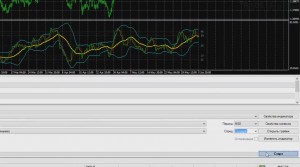
Within a few seconds, loading will complete and the chart will appear in a new window:
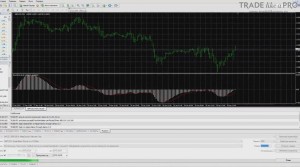
You can change the opened chart. Make it larger or smaller, switch bars to candles or vice versa, change the color scheme... You can also add some other indicator.
For our case, let us add a moving average:
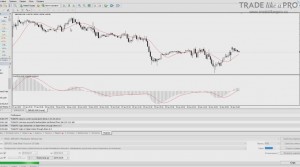
At the moment, testing will proceed slowly because we set the visualization speed slider to a short interval. If you increase the value, it will go many times faster.
Unfortunately, there is a bug in the chart playback speed. If you set the slider to 31, it will draw new bars quickly at a moderate speed, but if you set it to 32, the chart will suddenly run far ahead:
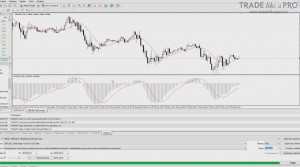
In my case, the testing had already ended because I set the value to 32.
Now let us change the modeling type by setting "All ticks of control points" and see how much slower the visualization becomes:
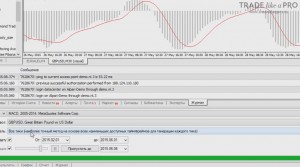
What kind of modeling type is this? This is the most accurate emulation method, based on all available time frames. For example, price movement on M30 is calculated based on M1 candle data.
The "Control points" method, which we had before, is rougher. It takes data from the nearest lower time frame. Because of this, testing speeds up. It turns out that on M30 the M15 time frame was used, since it is the nearest lower one.
After opening a new chart, the visualization speed becomes much slower, which is undoubtedly convenient for analysis:
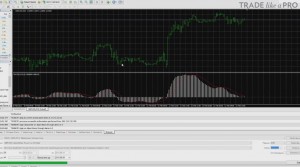
I advise you to choose the "all ticks" type, because this way it is more convenient and accurate.
Also note that the old visualization chart does not close, but remains in the tab:
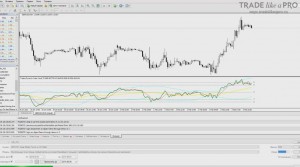
With its help, you can make some comparisons or close it so that it does not get in the way.
Now let us test the third-party TDI indicator:
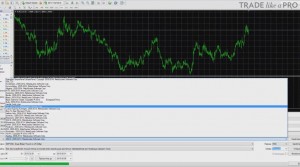
What Can We Do in the Tester?
The most important thing is that you can monitor the behavior of the indicator in real time. Suppose entry arrows appear, you can see whether they disappear after a certain number of candles or not. And if you plan to open a trade, you can make marks on the chart.
Let us imagine that with this indicator we would sell when the fast green and red lines bounced off the upper boundary of the blue indicator, and at the same time they were above level 68:
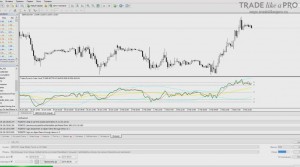
To somehow mark the entry, let us place an arrow there:
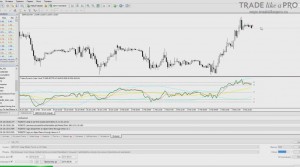
Somewhere around this place we would exit:
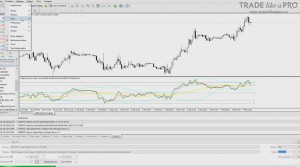
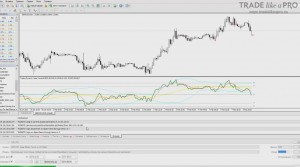
As a result, thanks to this, we will be able to obtain statistical results for analysis:
Conclusion

Keep in mind that trading based on a single indicator is an ungrateful task; the most effective use comes as part of a trading system. It is recommended to test it in order to assess its potential, strengths and weak points, as well as whether it suits you personally. It is no secret that some traders know how to make money, for example, using signals from the Stochastic indicator, while others persistently blow their accounts on the same signals.
After testing, you will not be left with a false impression of the indicator, because the chart is built in "live" mode, and you do not see what will happen next. Thanks to this, your mind will not be able to somehow misjudge the indicator's signals and its importance in successful trading.
We can conclude that the indicator testing function can be useful not only for detecting the repainting of an indicator's signals, but will also help assess its potential for your trading.
Sincerely, Pavel Vlasov TradeLikeaPro.ru
