
Global Markets in a Period of Turbulence. Part 4.

The geopolitical situation in the world is gradually heating up. While the EU has so far been making very loud statements but at the same time is actually slightly reducing its support for Ukraine, the US is already sending a third aircraft carrier to the Persian Gulf.
Against this backdrop, the markets' reaction can hardly be called nervous: speculators are already accustomed to it, while investors are demanding ever-higher government bond yields. And governments are forced to provide them.
A chart of yields as of September 30, 2026, for two-, five-, and ten-year bonds issued by the US, Germany, France, and Japan, as well as their changes over the year.
Country | 2 years | 5 years | 10 years |
|---|---|---|---|
US | 4.88% ← 3.60% (+1.28 pp / +128 bp) | 5.09% ← 3.74% (+1.35 pp / +135 bp) | 5.29% ← 4.16% (+1.13 pp / +113 bp) |
Germany | 3.24% ← 2.02% (+1.22 pp / +122 bp) | 3.36% ← 2.31% (+1.05 pp / +105 bp) | 3.64% ← 2.71% (+0.93 pp / +93 bp) |
France | 3.605% ← 2.170% (+1.435 pp / +144 bp) | 4.081% ← 2.740% (+1.341 pp / +134 bp) | 4.751% ← 3.510% (+1.241 pp / +124 bp) |
Japan | 1.939% ← ~0.95% (+~0.99 pp / +~99 bp) | 2.379% ← ~1.22% (+~1.16 pp / +~116 bp) | 3.063% ← ~1.65% (+~1.42 pp / +~142 bp) |
By late September–early October 2026, the global bond market had shifted upward. Current levels are the highest since 2008–2009.
An analysis of the situation shows that we are witnessing a global transition from a regime of very cheap long-term financing to a regime of expensive capital.
Of course, rates include a premium for elevated inflation, but in any case both inflation and high rates are significantly changing the financial and economic model.
Previously, expensive money meant a decline in the value of gold, oil, stocks, and so on. But the current situation is producing the opposite, rather unexpected effects. Let us examine how expensive money affects yellow, black, and digital gold.
Yellow, Black, and Digital Gold: Where Investors and Speculators Are Looking
Black gold—oil—is rising or at least not falling. The reason is a structural shortage of the resource itself. This means that the real cost of money, which depends not only on the central bank rate but also on government debt yields, has less influence on the price of oil.
Yellow gold is standing still and preparing to rise. Previously, the price of gold declined as the cost of debt rose.
Gold is now both a hedge against inflation and, much more importantly, is beginning to serve as protection against the systemic risk of government debt and the monetary system itself. However, there is also a shortage of the physical resource here.
Digital gold—Bitcoin—is still rising. And this is quite strange, because BTC depends more heavily than many traditional assets on excess liquidity and speculators' willingness to take risks.
There is a view that the loss of confidence in fiat money supports digital assets, although rising real rates and contracting liquidity work in the opposite direction.
However, if digital assets are substantially tied to the stock market at the current stage, then one can speak of a certain short- or medium-term flow of the most speculative capital from the stock market into the cryptocurrency market. After all, cryptocurrencies need very little money to rise on a global scale.
Now let us move on to analyzing volume positioning on global exchanges.
Gold GC
Paper gold is stuck in a range. We do not know the price of actual transactions, but the activity of central banks and funds dealing in physical metal seems to suggest that real prices may differ somewhat from exchange prices, though not as much as in the oil market.
Let us analyze what we discussed on September 12.
First, let us look at the big picture. For almost a year now, buyers in gold have formed a platform in the 3,980–4,150 range. This is where the move toward 5,400+ began.
In the second half of June and in July, the 3,980–4,150 range served as an area where buyers calmly absorbed sellers before moving directly to the 4,680–4,760 range during August.
What is the 4,680–4,760 range? It is the area where sellers were most active in March–April.
Overall, we are observing a typical balance—also known as a corridor or consolidation. If so, it is reasonable to expect some kind of test of the upper boundary of the 3,980–4,150 range, and perhaps even a speculative false breakout, but nothing more.
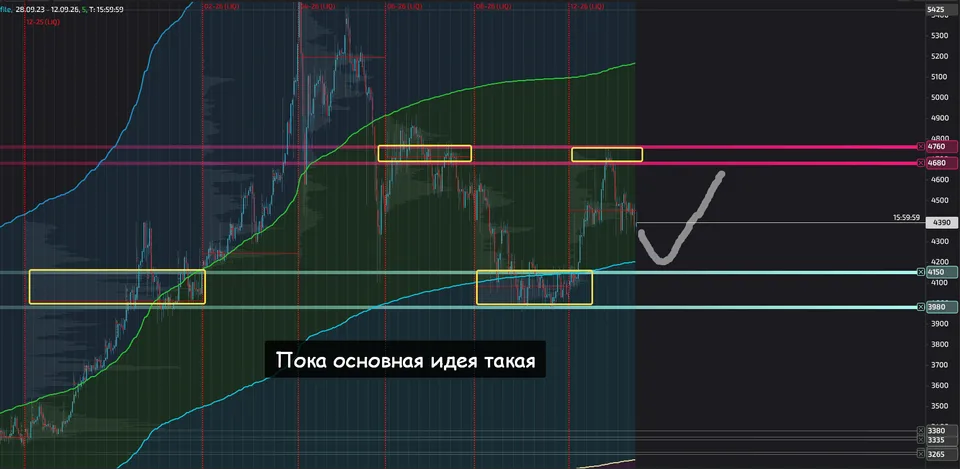
I highlighted the key point in the quote in bold. Over the past three weeks, speculators (investors work with physical metal) executed the plan. Such is the law of the auction, and there could have been no other outcome.
But enough sentiment; let us see what is happening in the market now.
Throughout last week, the price remained in balance just above 4,150. In fact, the December GC futures contract also began right there.
How are such patterns usually traded? For now, I do not expect a breach of the entire 3,980–4,150 range, but we may well see 4,080–4,085, and perhaps slightly lower; maybe we even should. In other words, some kind of truncated leg is quite likely.
What is a truncated leg? Most often, the final extension is the shortest in an impulse. And if the previous extension amounted to somewhere around 2,500 points ($0.1 per point), then the next leg, if truncated, may well amount to a 127.2% Fibonacci extension. The point of control (POC) of the previous contract and the low of the current contract are also located here.
Everything is shown in the image below.
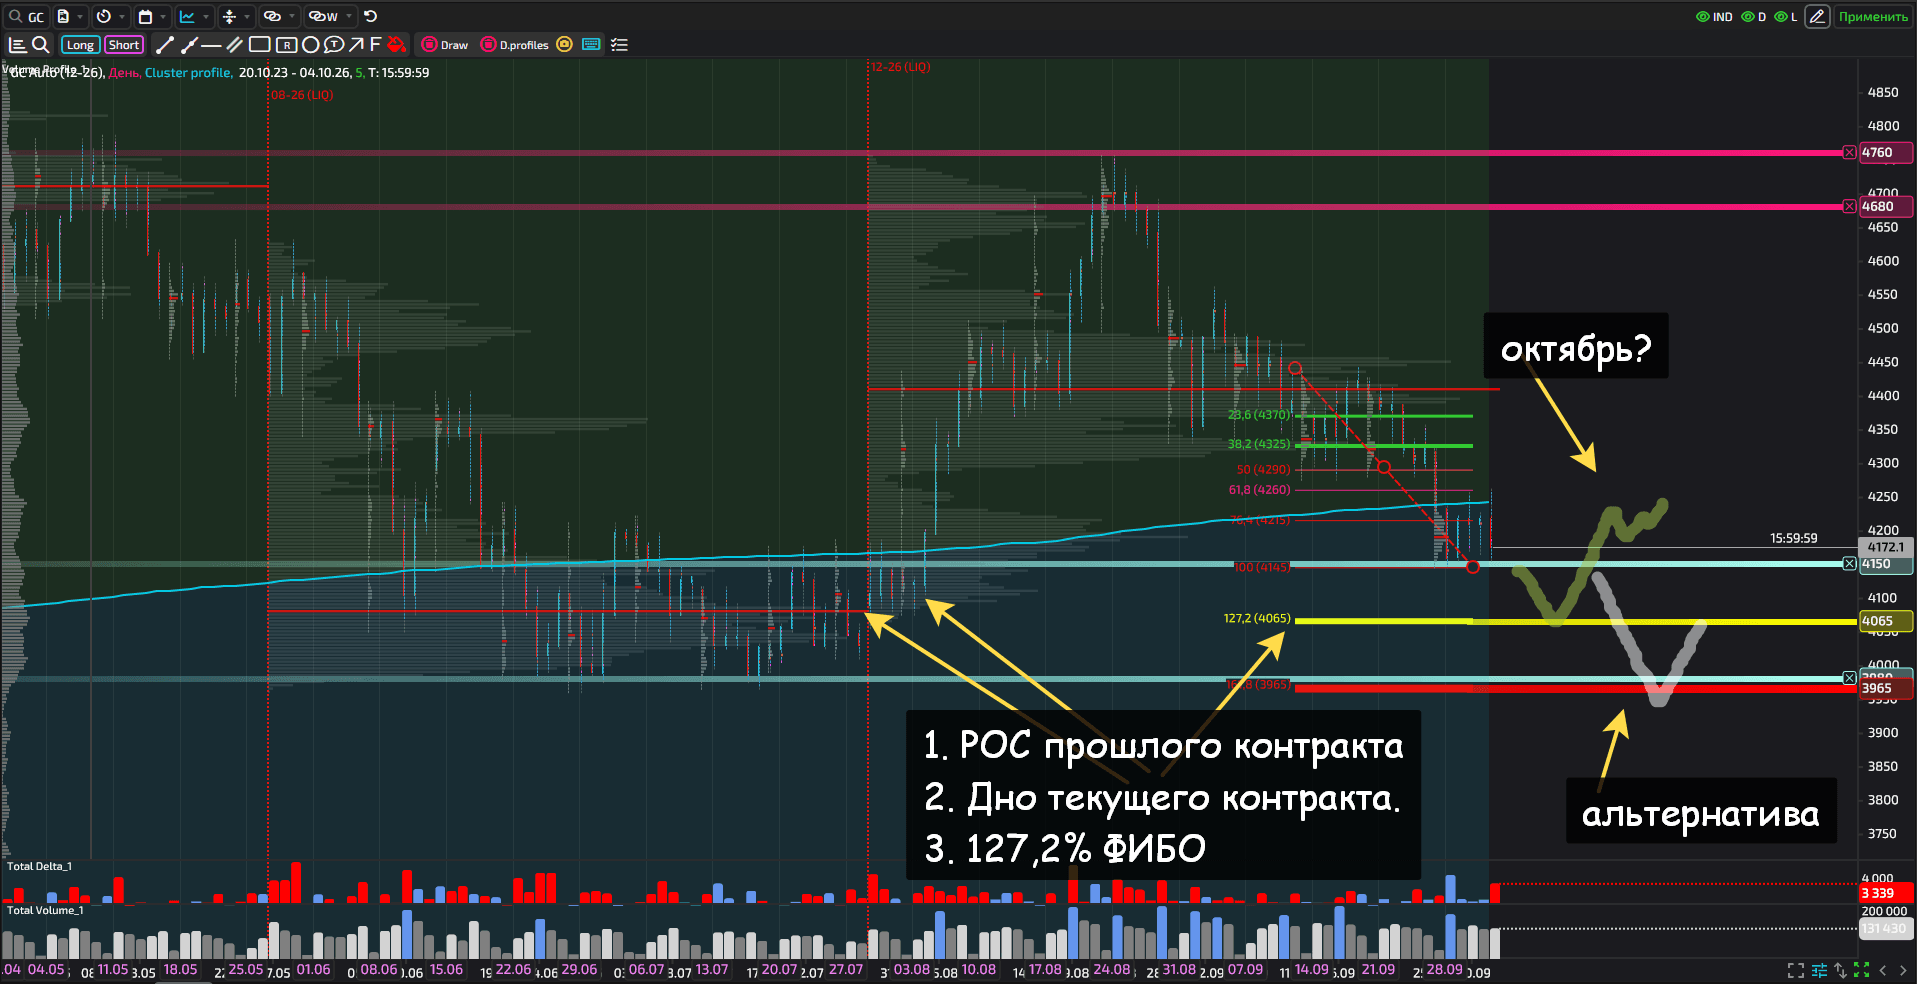
The alternative, of course, should also be noted. It is both the 161.8% Fibonacci extension and the low of the previous contract, which formed support for the medium-term balance.
This trade will take from one to three weeks, and then we will see.
At the same time, note that holding above 4,150 for another week or two would be a very strong signal of support and a reversal without any significant final move south. So stay alert.
We wish gold traders good luck and maximum risk control. After all, volatility there is, to put it mildly, off the charts. And that is fraught with danger.
Oil CL
Here, too, we will begin with a quote from the previous review. A week has just passed, and one cluster has been added to the weekly chart.
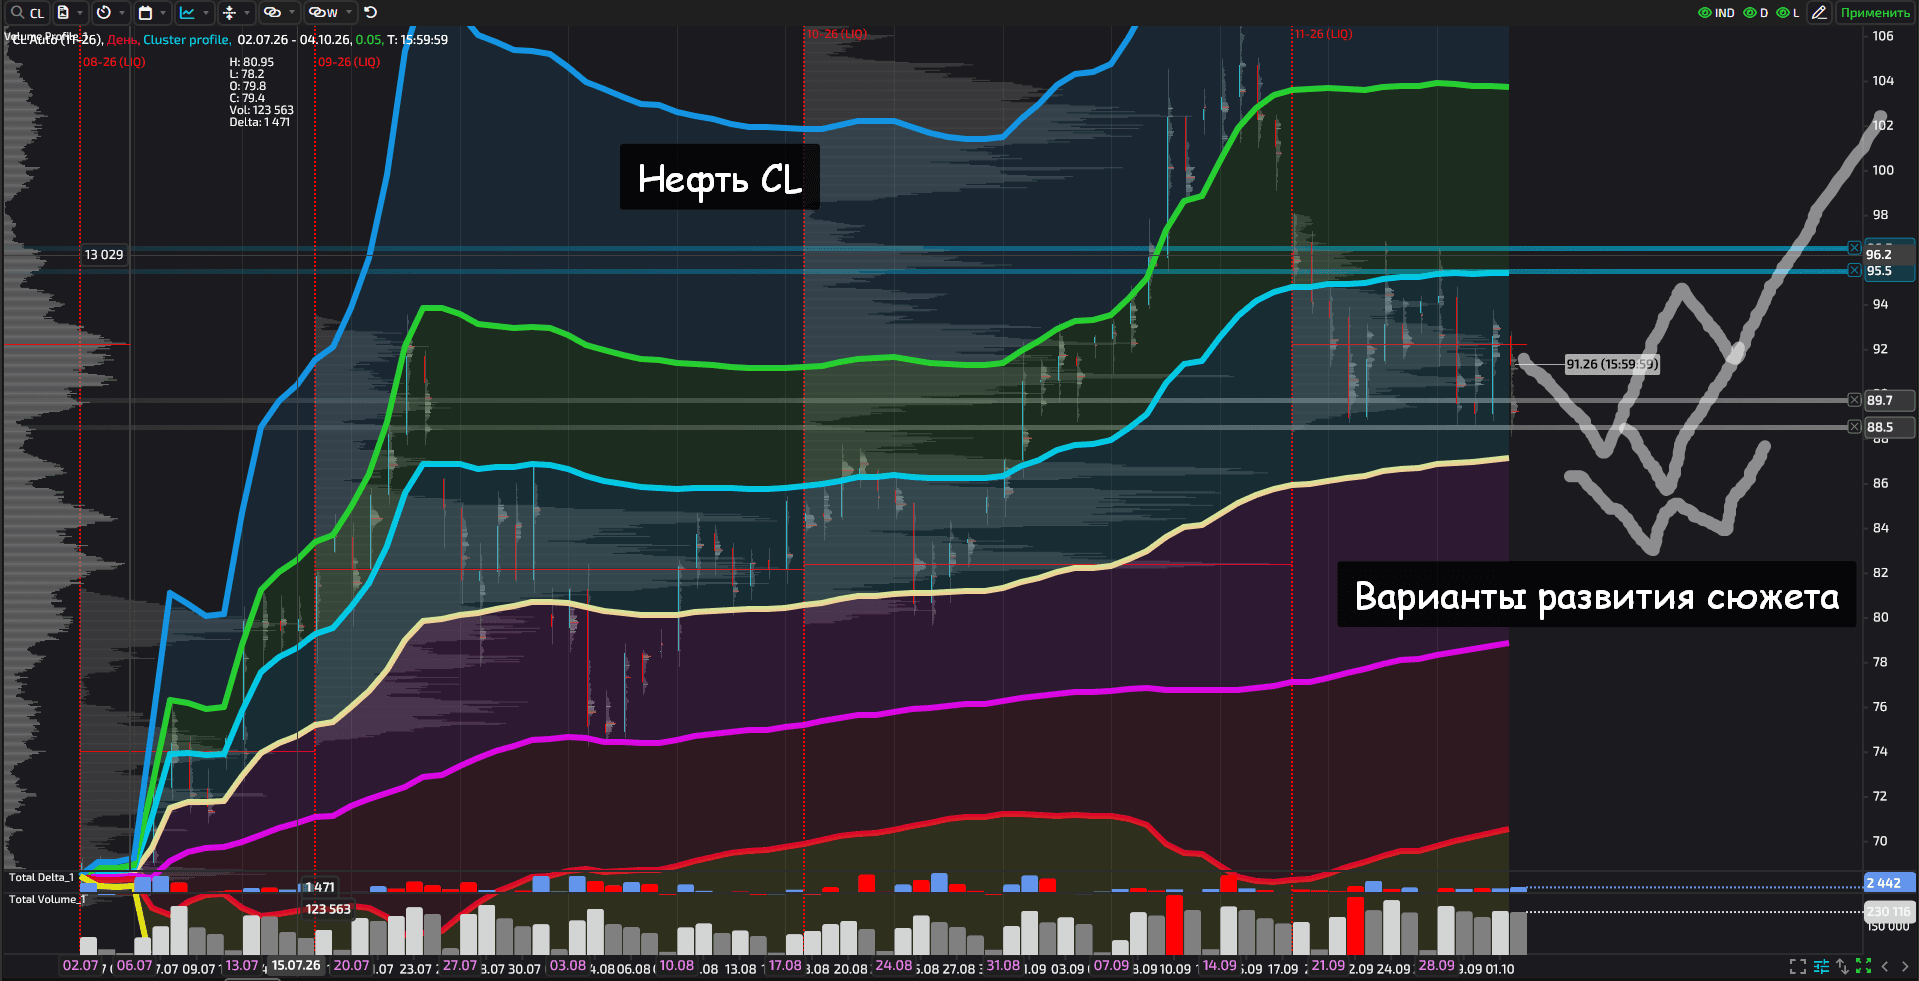
And what are the prospects? For now, we continue to hover within the value area for the entire year. We may well see 85–86.5. In any case, it is reasonable to expect some kind of downward balance until roughly the end of the first ten days of October.
That is one scenario. And then, if the Morgans are right and there are no clear developments in the Iranian and other crises, another assault on 100–105.
A third scenario can also be identified. Under this scenario, the 88.5–89.7 range may well serve as the price floor in the current phase. In this scenario, buyers need to break above 95.5–96.5 to move smoothly toward 100.
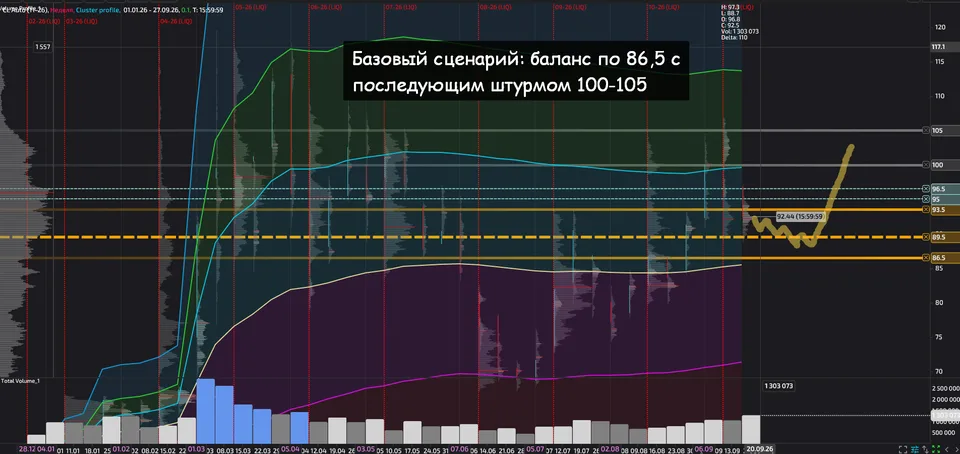
What did we see during the past week? A quite expected trade that involved holding 89.5, with a slight spike down to 88 and change.
Why such confidence that the current levels will hold?
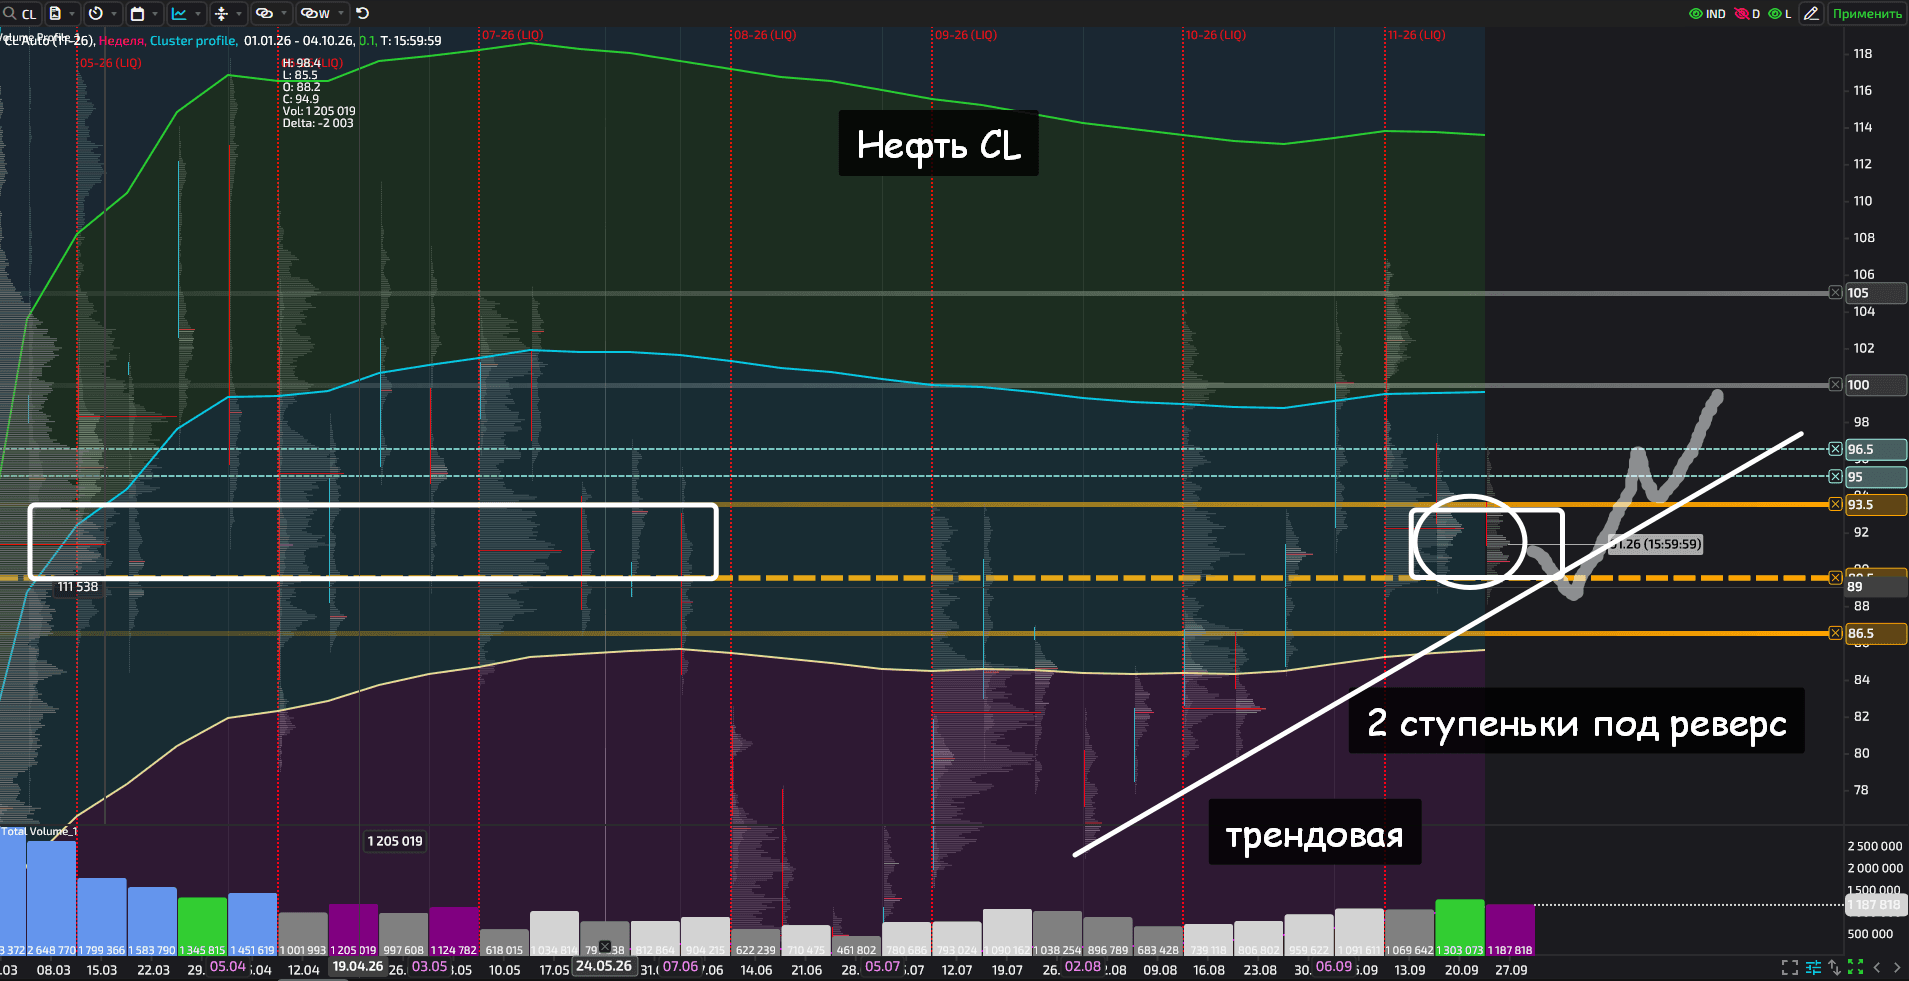
First, more than 1.3 million contracts were traded the week before last for the first time since early April. And this week, slightly fewer than 1.2 million contracts were traded, something not seen since late May.
Second, we can see that the decline is being absorbed and a two-stage reversal pattern is forming. Or perhaps a three-stage one, under which we may see a slight new low, with the week closing around $89.5–$90 per paper barrel.
Third, a trend line has taken shape quite clearly, and that is also a strong argument.
Fourth, the impulse VWAP is still below us. True, such a pattern can be traded downward, but either no lower than 86 or no lower than 81–82, as we discussed in the previous review and which for now remains a very remote alternative scenario.
And fifth, I have already mentioned the additional aircraft carrier and the decline in inventories, not only or so much of oil as of petroleum products.
Overall, in a situation like this, playing a medium-term short is dangerous, while intraday speculation is quite possible and sometimes necessary.
BTC
Digital gold is slowly but seemingly quite confidently attempting to break through the 81,500–85,300 range, which is very important for determining the market phase.
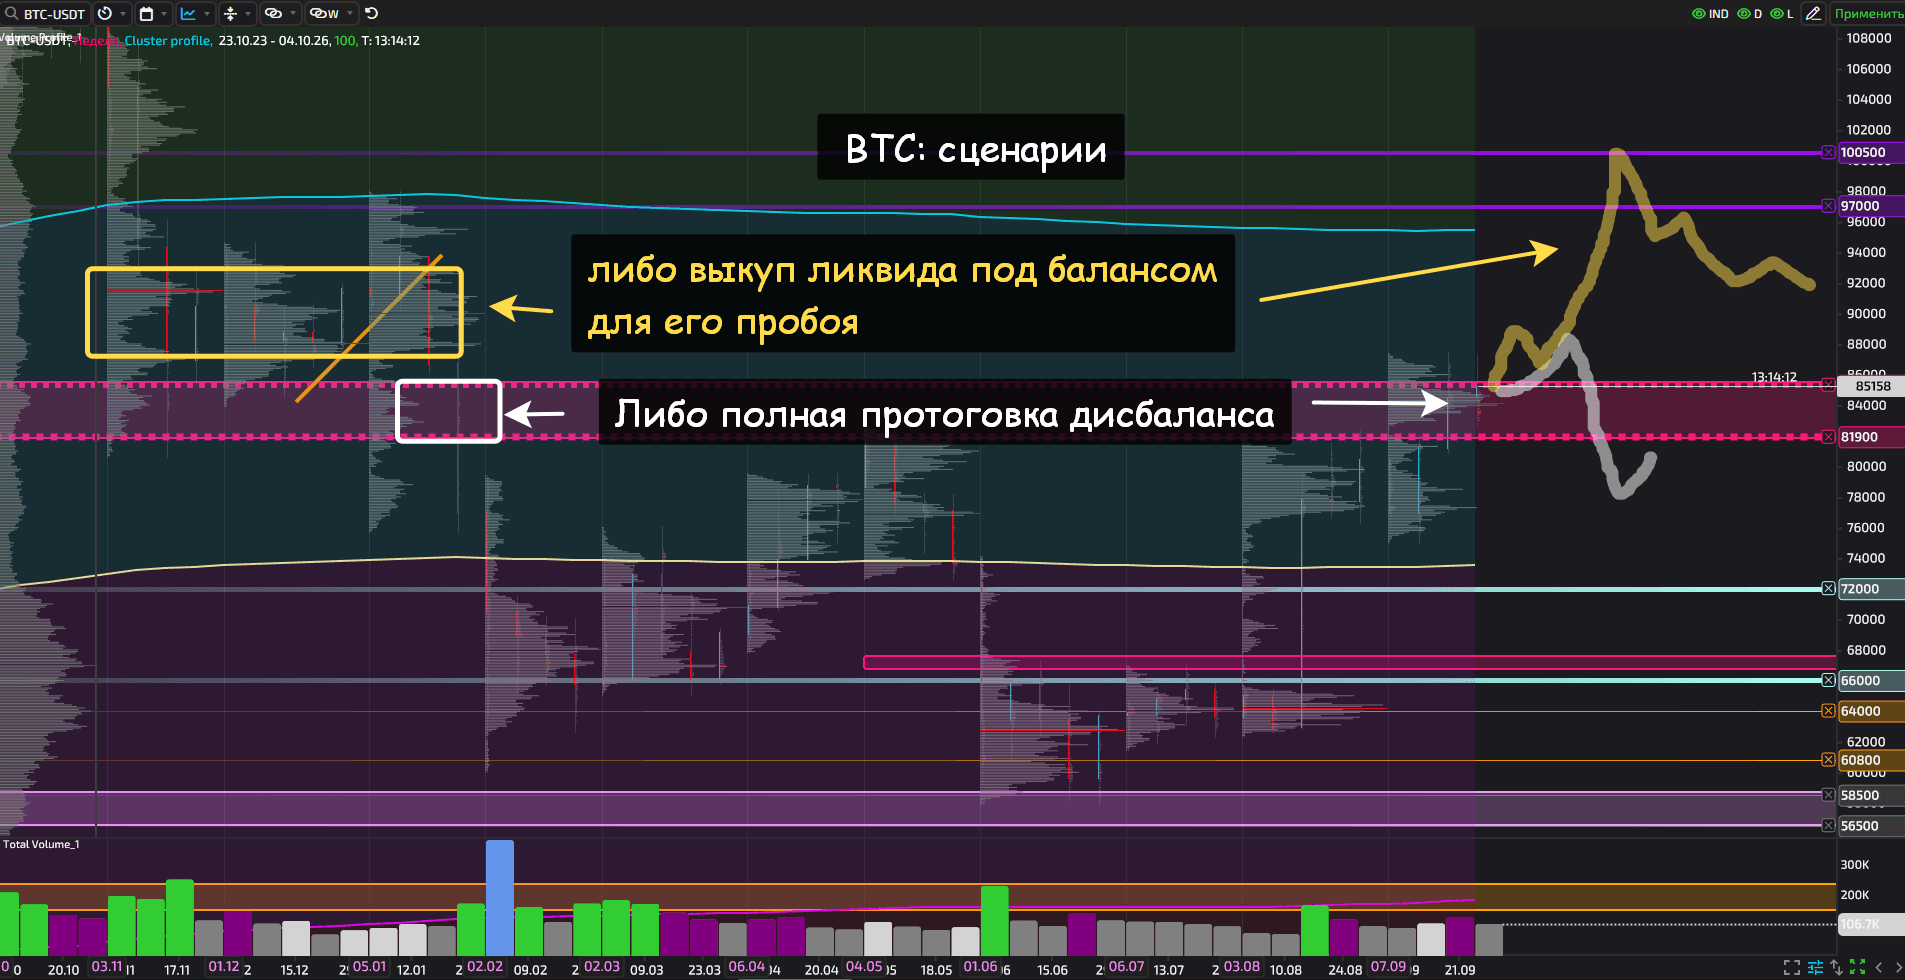
In fact, the weekly cluster chart clearly shows a point of control forming around 84,000, which may well represent liquidity accumulation for a sharp breakout as far as 100,000. That is the positive scenario.
What about the less positive scenario? Under the less positive scenario, we may see a sharp or gradual reversal from 88,000–90,000 to below 80,000.
Why these alternatives? Because we are either in a buy impulse, which remains the priority for now, or nevertheless in a broad balance with the January imbalance zone being traded through. And trading through an imbalance usually ends with a reversal just below the lower boundary of the volume zone (87,000–88,000).
Overall, we are watching the auction and keeping our fingers crossed.