
Does Technical Analysis Work on PAMM Account Profitability Charts?

Hello, fellow Forex traders and investors!
Have you ever had the idea of using technical analysis on charts of something that cannot be traded? Those who are actively engaged in PAMM investing are probably familiar with the feeling that, while looking at the profitability chart of one PAMM account or another, you involuntarily see support and resistance levels, a break of a trend line, and so on. But what if you really try applying technical analysis to PAMM charts? Will this improve an investor's returns?
We decided to look into this issue, wrote a script to transfer profitability charts into MetaTrader 4, and conducted a comparative analysis of investing based on entries from indicators. What came of it? Read our review.
Investments in PAMM accounts
What are the main parameters of an ordinary investor? Well, firstly, this is a small starting capital. As a rule, money for investment is set aside from the monthly salary, and no one keeps large savings with them. Small capital immediately cuts off many seemingly profitable types of investments, but which either require large financial investments or do not allow the use of the principle of equity participation. This may include investing in real estate and purchasing land. Even if you have the opportunity to purchase a small plot of land, low market liquidity and slow growth in price will not allow you to quickly get rich. In addition, we should not forget the recent crisis of 2007-2008 and the current one, when prices on the real estate market not only did not grow, but dropped significantly. In any case, these are long-term investments, with a payback period of 10 years or more. Therefore, in most cases, real estate is purchased for personal use rather than for resale.
This means that we must also cut off all other low-income types of investment, since in our realities they are not applicable and will not allow you to become truly rich. The first thing that comes to mind is traditional bank deposits. The income from them, although stable, is too insignificant to set the goal of the deposit to be earnings, and not the safety of funds. Moreover, it is difficult to predict the degree to which a currency will depreciate over a long period of time - inflation can simply neutralize any income received in excess of the invested amount. The same goes for investing in precious metals. There was a time when investments in gold were very relevant, but the price of gold has been growing extremely unstable in recent years and such investments have also lost the label of highly profitable investments.
Another, one might say, fundamental factor is the complexity of investments. After all, in theory, even with a fairly small capital you can start your own business, and this is already a fairly highly profitable investment. However, an ordinary hard worker has no time to learn all the intricacies of running his own business. He probably has a family, children and a permanent job - there’s no need for additional worries. The same goes for making money on stocks and the stock exchange - it’s difficult, expensive, and incomprehensible. Well, again, there are great risks of losing all investment capital, without even having time to really dream about your own yacht and island in the Pacific Ocean.
Fortunately, all is not doom and gloom in the private investing niche. With the popularization of the interbank forex market, traders have the opportunity to trade in financial markets without significant investments, and investors have the opportunity to invest in independent traders. With the advent of PAMM account services, private investors now have the opportunity to make equity investments in professional traders, which significantly expands the boundaries for people uninitiated in the subject of trading in financial markets.
What are PAMM accounts?
PAMM accounts are a cross between independent trading on the stock exchange and investing in large investment funds. But at least it's much simpler. All you need to get started is an Internet connection and a small amount of money in your account. Since the Forex market has much greater liquidity than the same stock exchange, and automatic leverage allows traders to open transactions of a much larger size than their own funds allow, sometimes they show previously unprecedented profitability indicators. Naturally, any highly profitable investment is inseparable from the concept of risks, and PAMM accounts are no exception. You'll still have to learn a few things before attempting to invest on your own. Fortunately, this is exactly what will be discussed later in this article.
Types of investment strategies in PAMM accounts

Investing in PAMM is somewhat reminiscent of investing in shares of a growing company. The most effective strategy is considered to be “buy and hold”. That is, we invest a certain amount and wait until the share price rises, and then withdraw the profit. It's simple, isn't it? Unfortunately, not all traders are truly professional market players. That is, they certainly don’t think so, but still many PAMMs blow up from time to time, losing both their own funds and investors’ money.
To protect themselves as much as possible from such a situation, many investors use various investment strategies that allow them to prevent losses in time and withdraw investments in advance. Most often, the so-called “topping strategy” is used. Its essence is to top up on drawdowns in profitability when a trader has closed a losing position or simply holds a floating loss. This reduces the payback period of the investment. Traditional toppings do not provide any advantage, since they only work in one direction. If your account is drained, you will suffer a larger loss than if you had simply invested and held the position from the beginning. That is, the strategy will only work if the price of the share is constantly growing. When a trader regularly suffers losses, the strategy only makes the situation worse. In this case, the buy and hold strategy will perform much better, since the breakeven level in most cases will be lower than the current level of funds in the PAMM account. Therefore, we immediately cut off the method with toppings.
We will try to compare the traditional method of investing in PAMMs with a fairly advanced strategy using technical analysis methods. The goal of the strategy will be to try to avoid unprofitable periods in trading by withdrawing deposits in time before large drawdowns and returning them when the situation normalizes. To do this, we will use the MA indicator, which is probably known to all traders, in other words, the simple moving average and the Stochastic.
Data preparation

Technical analysis is easiest to perform in the MT4 terminal. For this purpose, a script was specially written that downloads profitability history from the server of Alpari and displays it as a regular MT4 quote chart. The script can be downloaded at the end of this article (installing scripts in MT4).
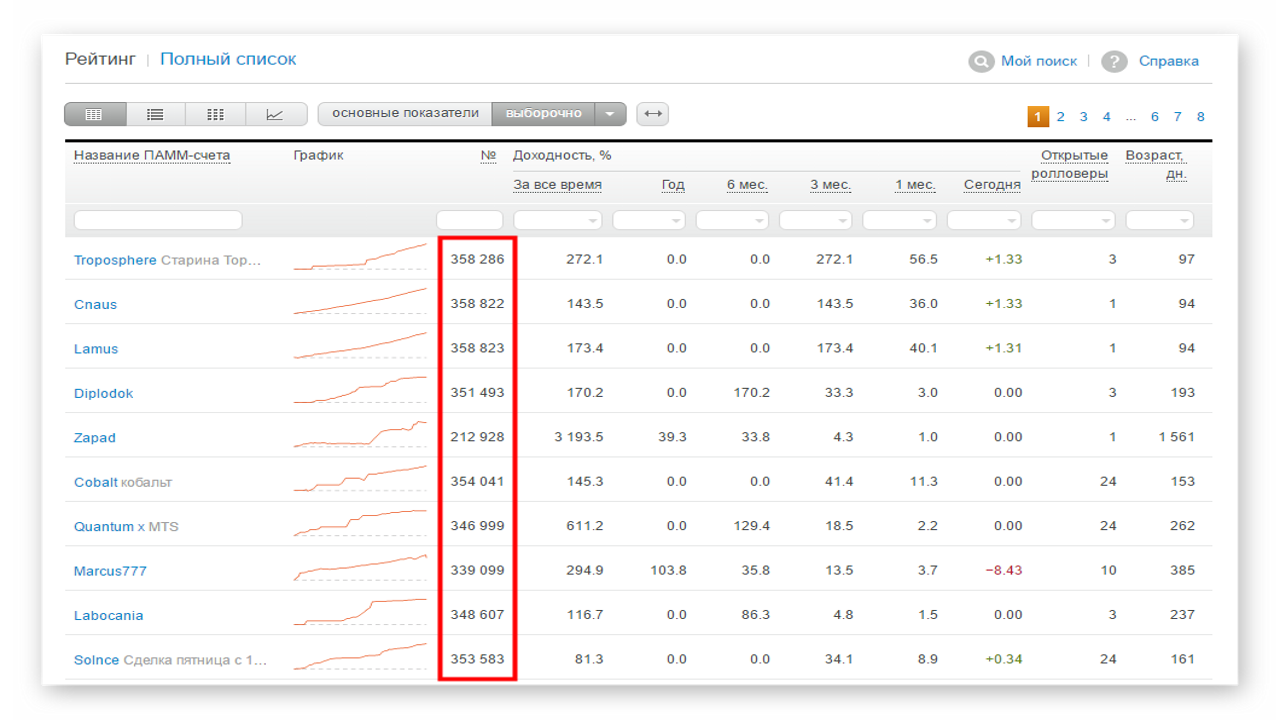
To access account data, you need to specify its number. The account number can be obtained directly from the browser address bar on the monitoring page, or you can add the corresponding column to general rating.
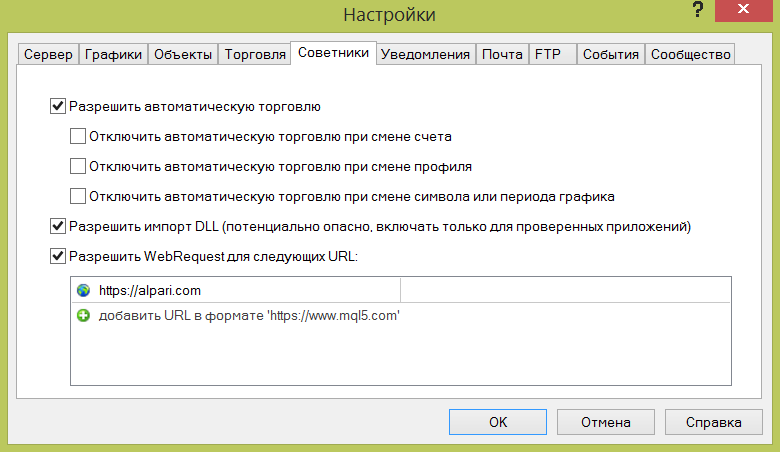
Before running the script, you need to add the address
https://alpari.forex
to the allowed list and enable DLL imports. To do this, from the main menu go to Tools -> Settings -> the Advisors tab, and enter the address into the field.
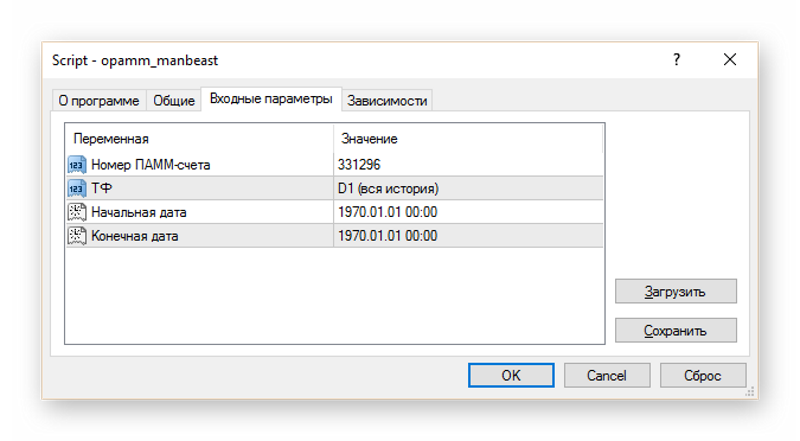
To open a PAMM chart, throw the script on any open window and indicate the account number in the input parameters. If the default options are selected, all available history will be loaded in the format of daily bars.
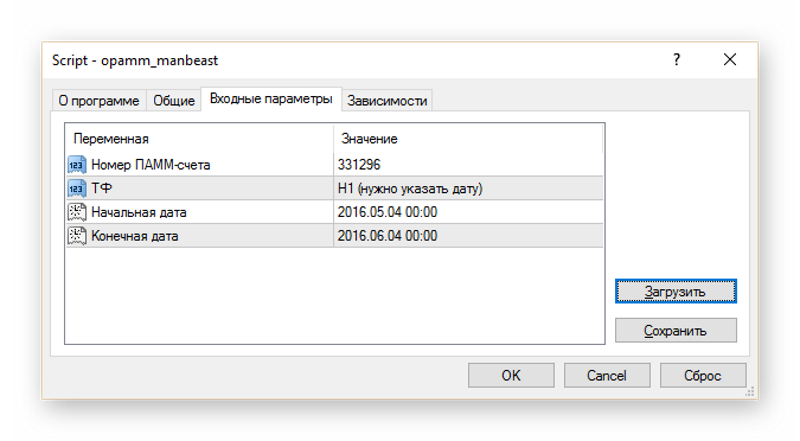
You can also load a chart with the H1 period. To do this, you need to specify the start and end date of the period. This function is intended for downloading short periods, no more than one or two months.
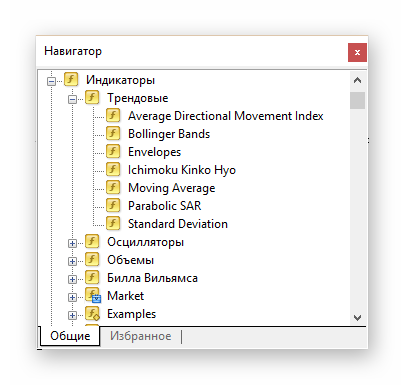
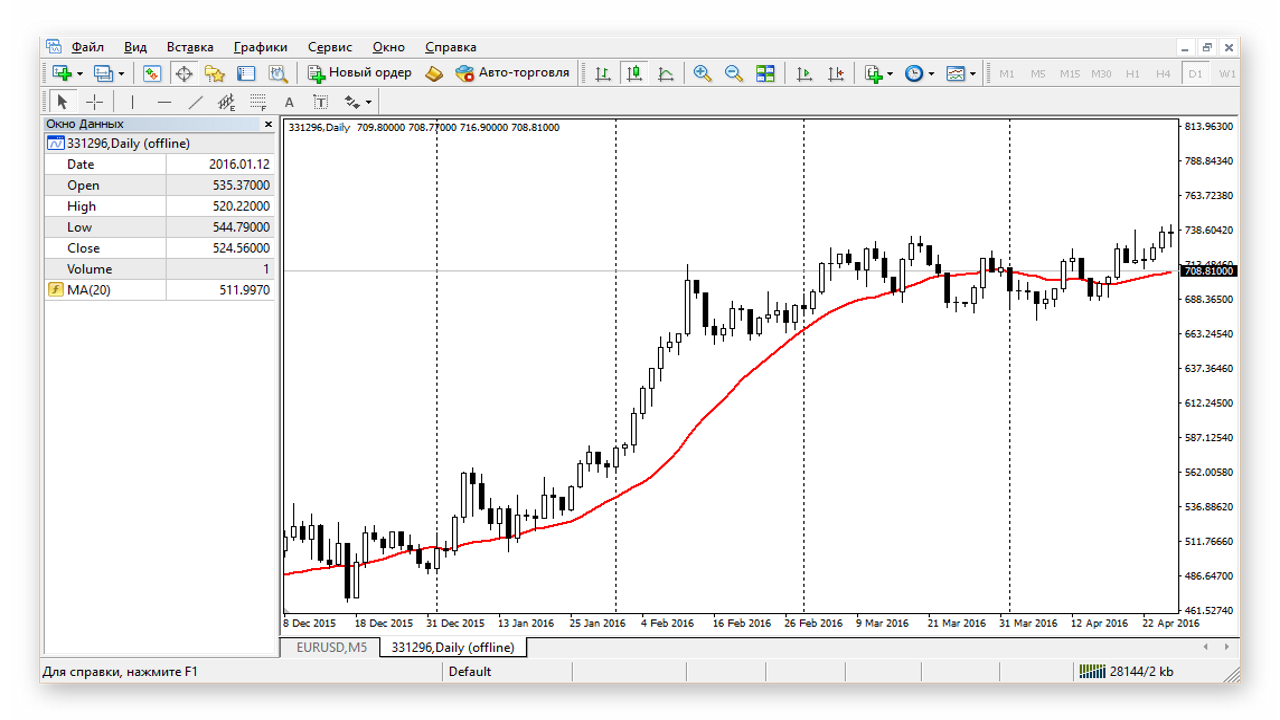
After this, the PAMM account profitability graph will automatically open in the terminal, which can be used as a basis for any technical indicator, for example, the standard Moving Average.
In practice, it will look something like this.
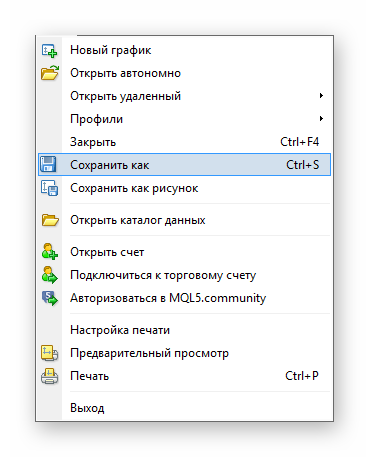
You can also easily export the chart from MT4 to Excel and other spreadsheet editors. To do this, go to the File – Save As menu, or press the Ctrl + S key combination, having previously activated the desired graph.
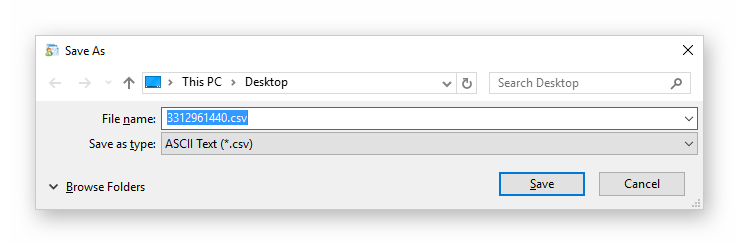
Save the file.
To display the chart in the form of price bars, select the first 4 columns of data (Open, High, Low and Close), and select the appropriate chart type in the panel.
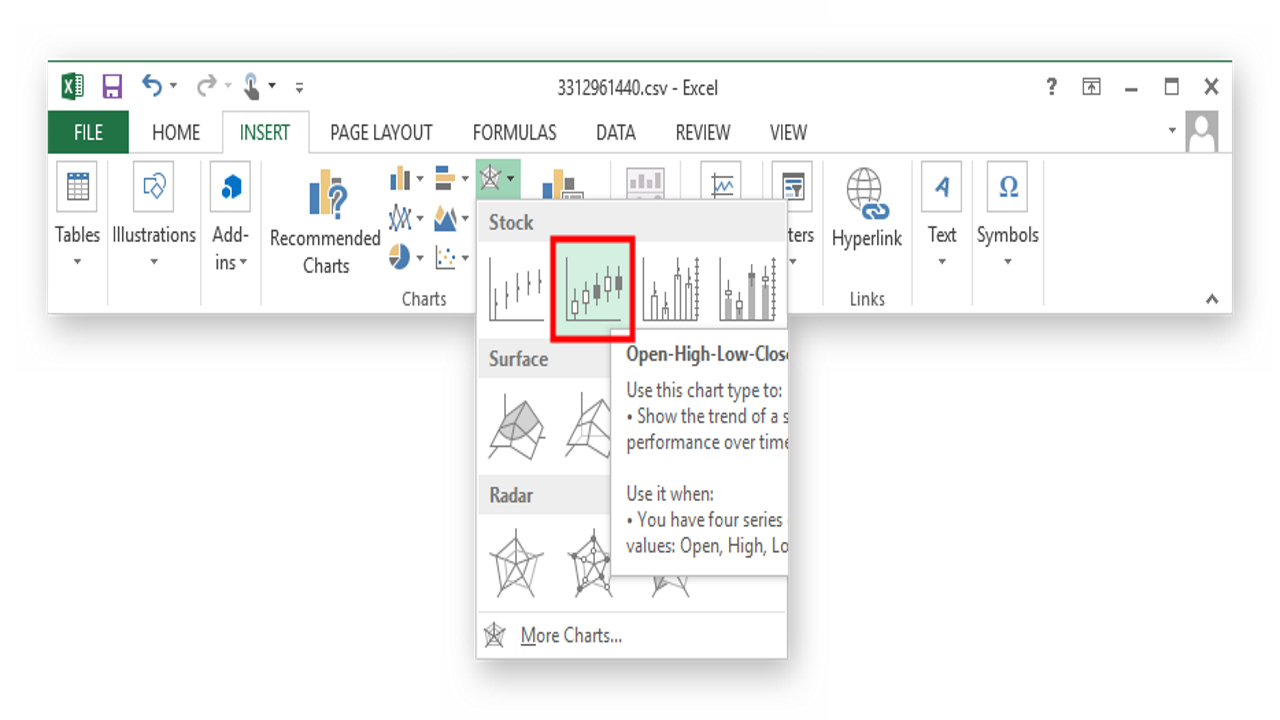
By clicking on the plotted chart, you can easily add the same moving average.
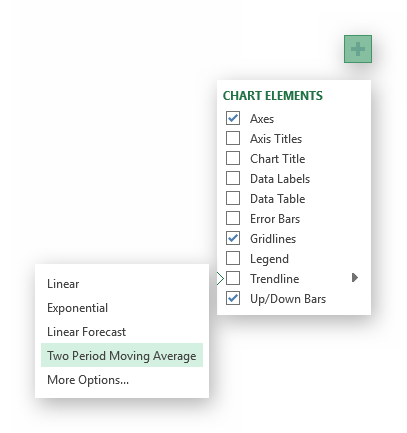
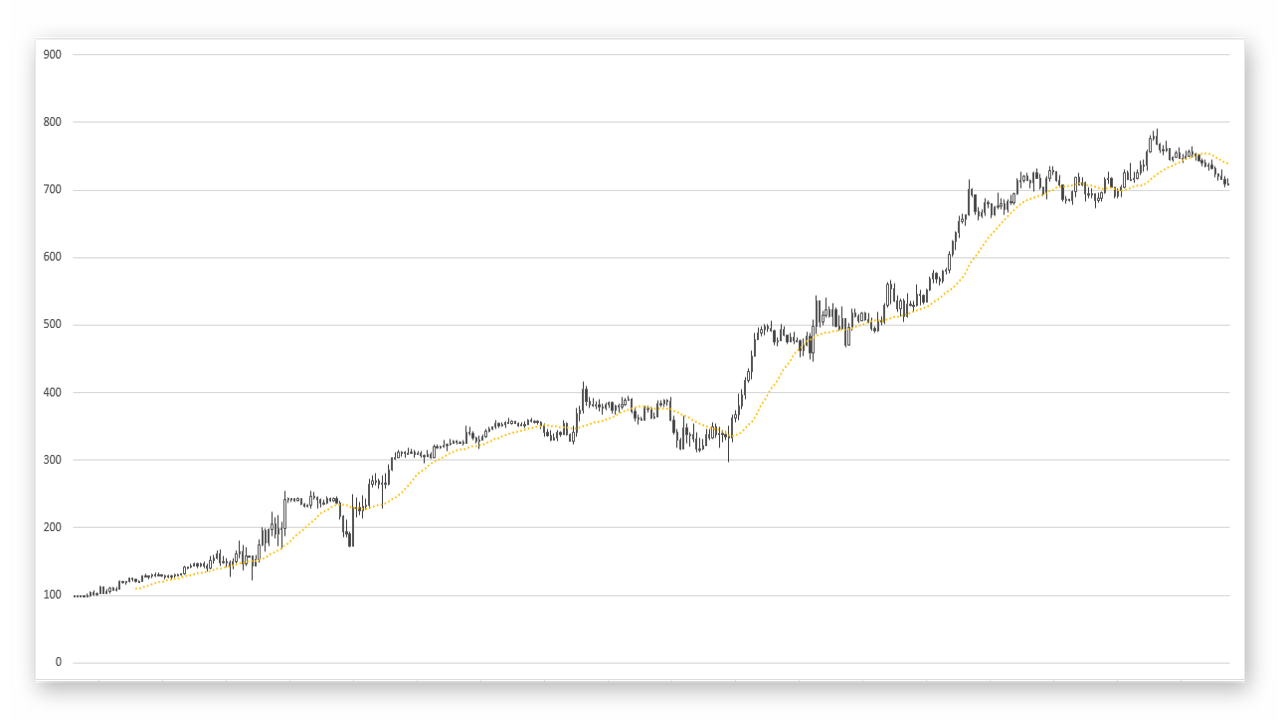
We will end up with something like this.
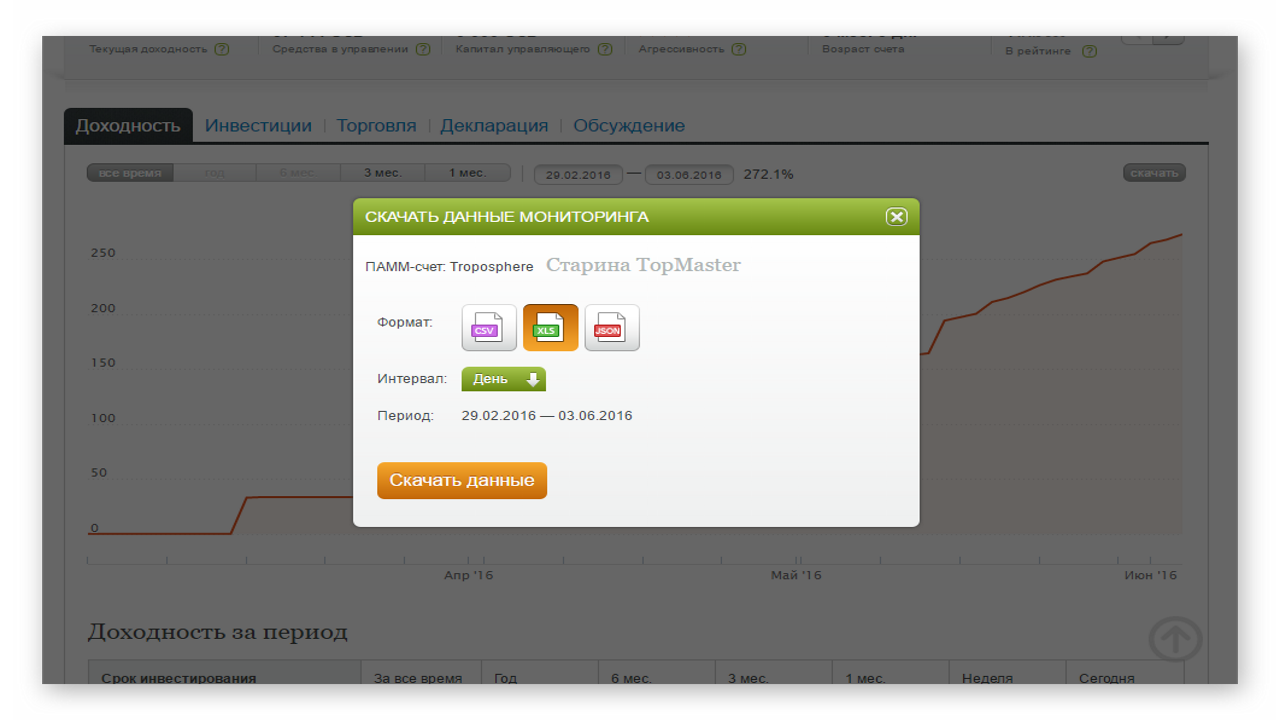
If you want to immediately export data to Excel, this can be done by bypassing MT4. There is a “download” button in the upper right corner of the monitoring graph. Click on it, select the XLS format, timeframe, period and click download.
Tests

The main criterion for selecting accounts for tests will be the age of the account - projects that are two years old or more will take part in the test. The test itself will be conducted over the period of the last two years, as a sufficient period to assess the potential strategies.
As it turns out, there are actually few such accounts, because most do not even last a year of stable work. But in order to exclude adjustment of the results, accounts will be selected blindly, without regard to rating and profitability/loss ratio. These offers will not be taken into account in the calculation; we will assume that the services are provided free of charge. Also, for the test we will take daily balance data, which in practice will correspond to daily nightly rollovers.
The most “advanced” strategy for investing in PAMMs is considered to be entry on drawdowns. Here the imagination of investors is fully revealed, and everyone will probably tell you how to actually enter drawdowns correctly. We need a unified method, so in our case we will use the most primitive trading strategy from a trader’s point of view - entry in the direction of the MA. We take the usual 20-period MA and overlay it on the PAMM profitability chart. When the MA turns upward, we make a deposit; when it turns down, we withdraw funds. All this is well illustrated in the picture below.
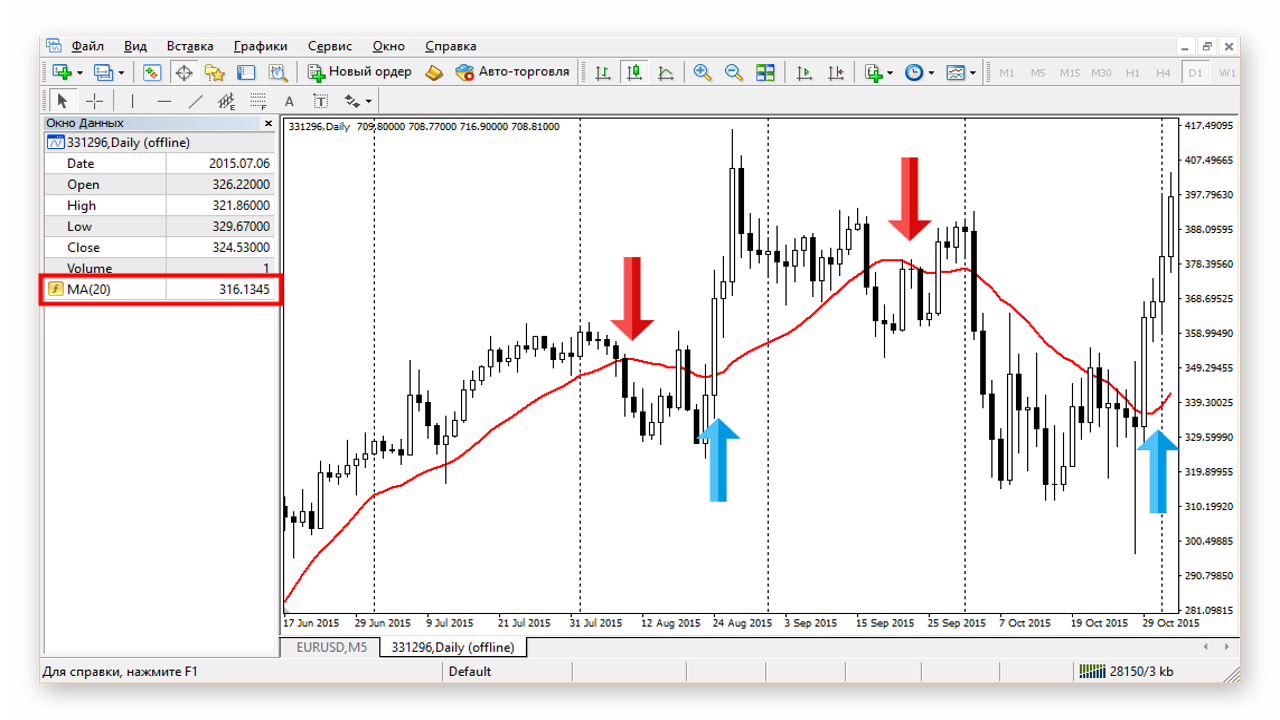
The 20 day period is chosen as a natural monthly investment cycle and will be universal for all accounts. Also, for comparison, the strategy will be usedaccording to stochasticwith parameters: 20, 5, 5. In this case, the entry will be made at the intersection of the fast and slow stochastic lines.
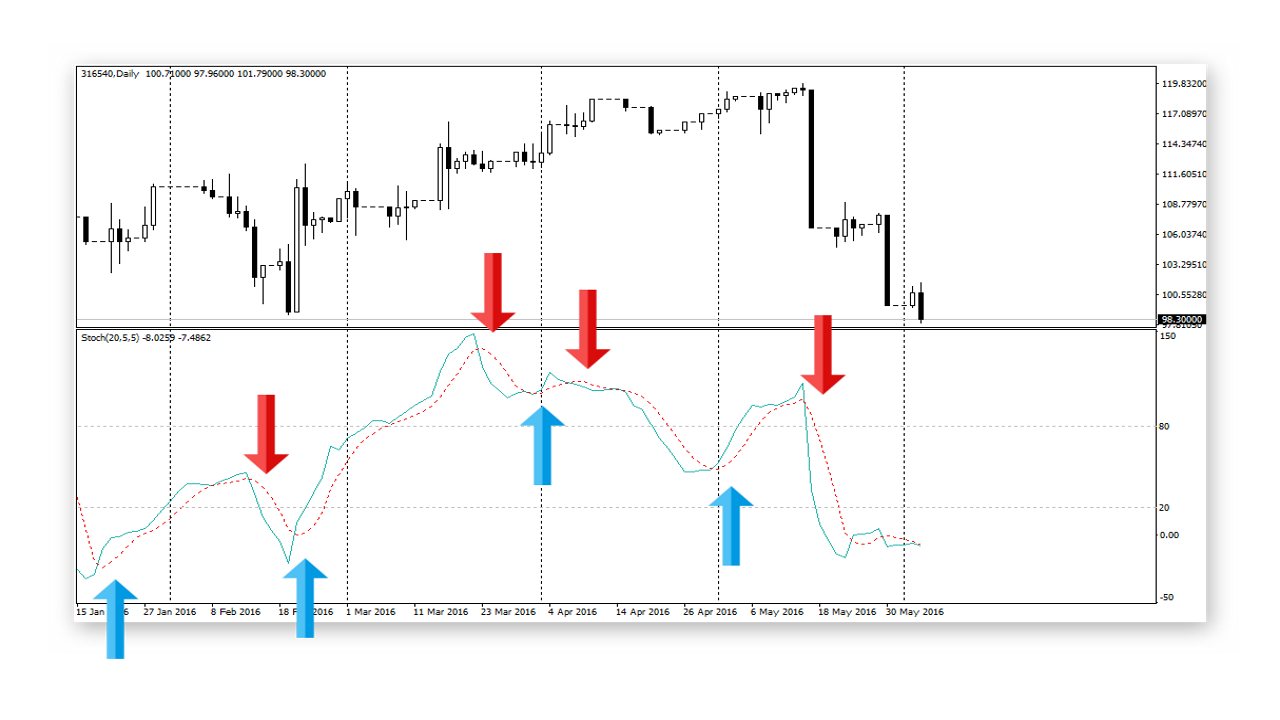
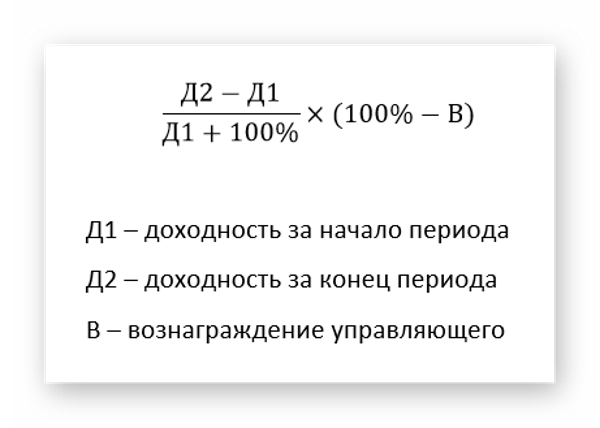
The selection consists of 20 randomly selected PAMMs, which should be enough to test the idea. For each strategy, a deposit of $1000 is allocated. To speed up the process, testing was carried out by an automatic script. The return on investment was calculated using the following formula:
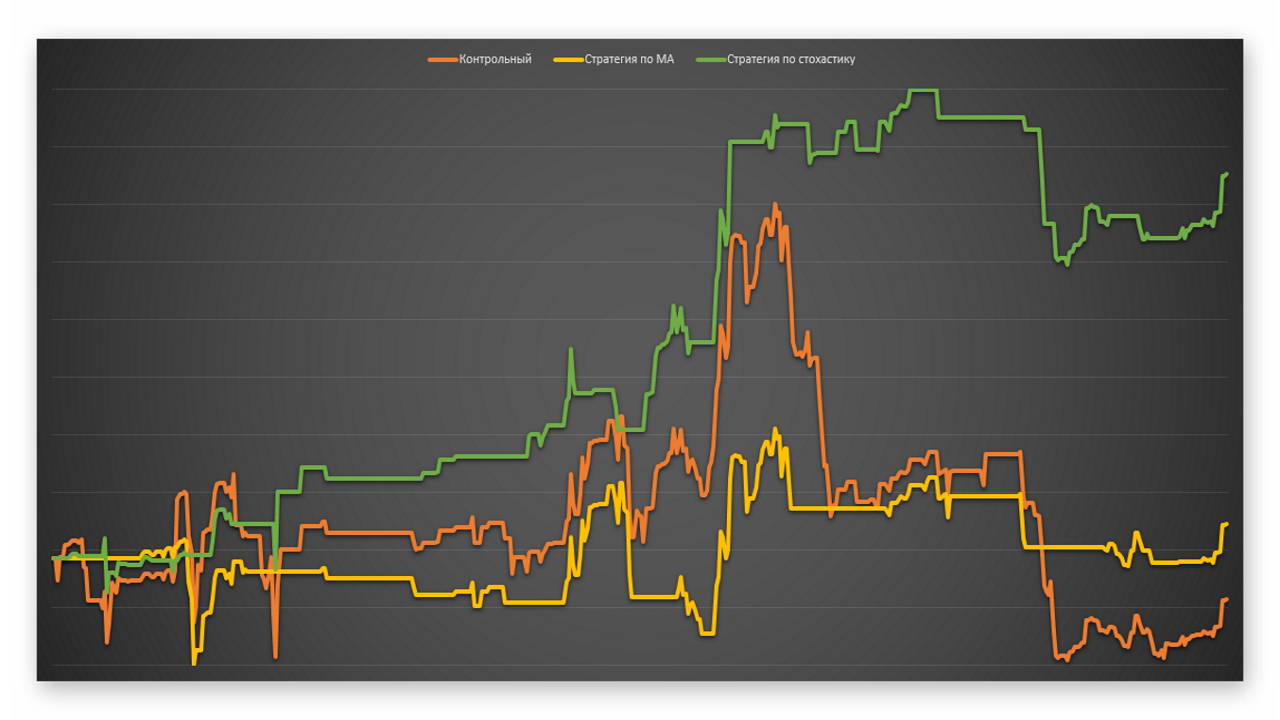
The graphs display the dynamics of investment return in the case of a one-time contribution at the beginning of the period (control balance in the screenshots), investing according to a strategy based on MA, and investing according to a strategy based on Stochastic.
- CoolMan - the manager has set himself a rather ambitious goal - 100% profit per month. The risks are a little overestimated, but the deposit load during the test did not exceed 30%. Success, however, is inconsistent, and rapid growth in profits is followed by an equally rapid decline. Based on publicly available information, one can judge from the fact that strict MM was not used - only the poor performance of the trading system is obvious. It is also worth noting that the manager had extensive trading experience, at least about 5 years.
- Control balance: $962
- Final balance on MA: $997
- Final balance on Stochastic: $1321
- COMOV is a medium-term strategy, according to the trader, with a systematic risk reduction. Practice shows the opposite; the loading of the deposit has constantly progressed over time. Again, according to the trader, the strategy was tested on a demo and real account. Unfortunately, the trader did not even have the understanding that cross rates are easily calculated from majors. In this regard, there are constant drawdowns and averaging. The report included the recovery period after the drain of most of the investor funds.
- Control balance: $166
- Final balance on MA: $869
- Final balance on Stochastic: $310
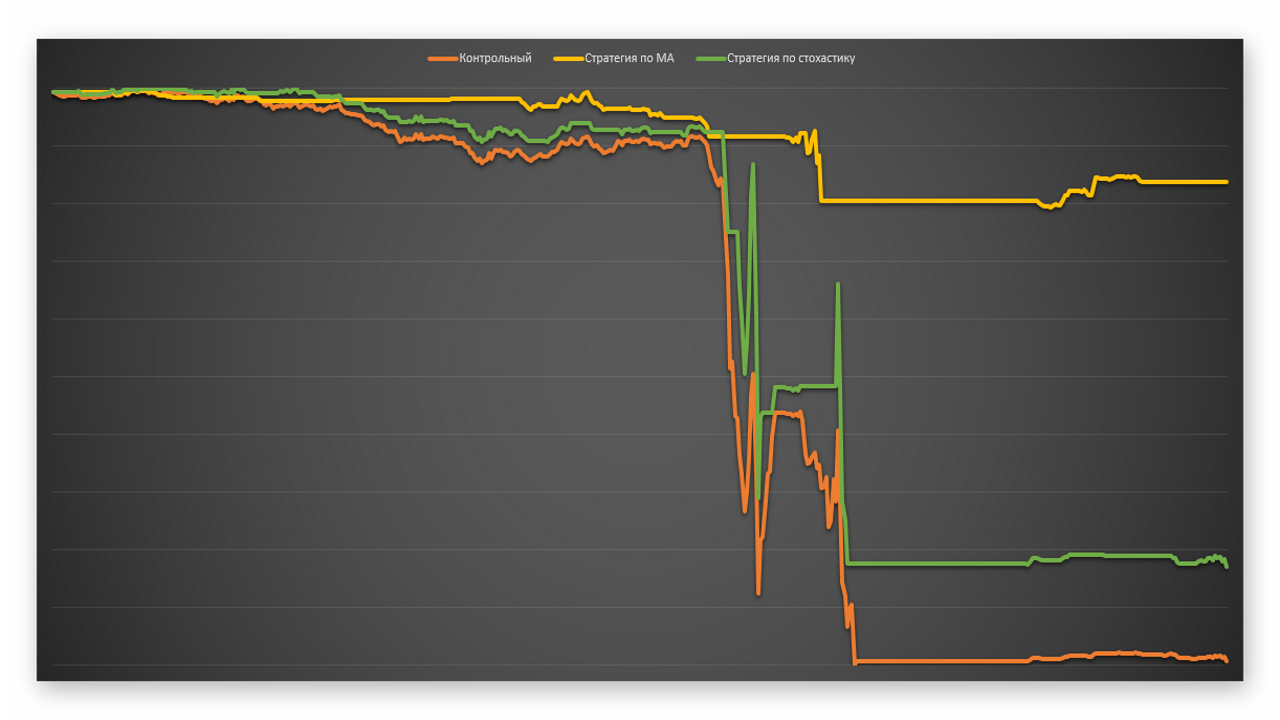
- -DAEMON- – trading hasn’t even really started. Since the date of publication of the invoice, there has been horizontal chatter with varying degrees of success. Not a word about the very principle of the strategy. But that’s why this approach was chosen - you never know what’s really on a trader’s mind. Even if you approach the selection of a PAMM project with the utmost caution, it is still possible that your account will be suddenly drained.
- Control balance: $101
- Final balance on MA: $469
- Final balance on Stochastic: $266
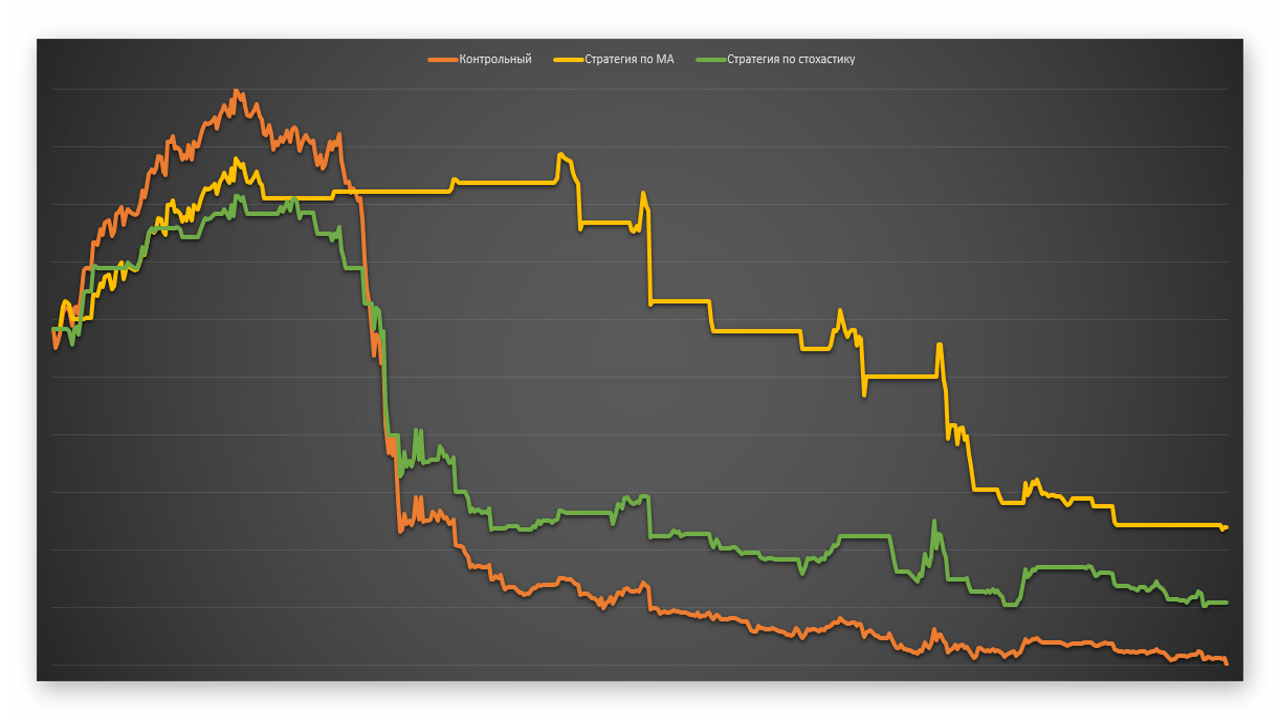
- CSForex – a mix of different strategies was used on this account, judge for yourself how successful it is. The account doubled in the first year after its creation, but this period was not included in the test. Ideally, the strategy should cut off all unprofitable periods in this case. This is partly what happens, but the result is highly dependent on the moving average period.
- Control balance: $537
- Final balance on MA: $750
- Final balance on Stochastic: $689
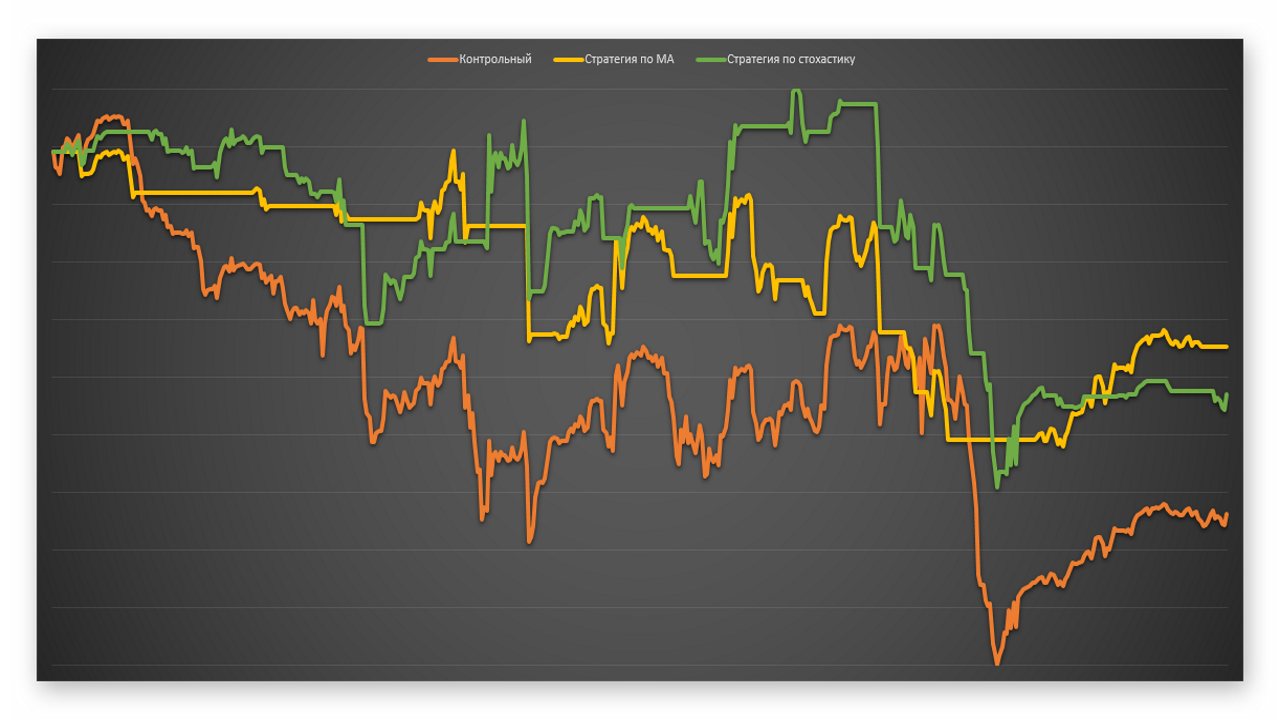
- Anzhelika – manual trading on major currency pairs. Very strict money management, but using martingale. The last drawdown is precisely due to overstaying and triggered stop loss. The strategy allowed us to cut off one large drawdown and slightly stabilized the profitability chart.
- Control balance: $1950
- Final balance on MA: $1908
- Final balance on Stochastic: $1516
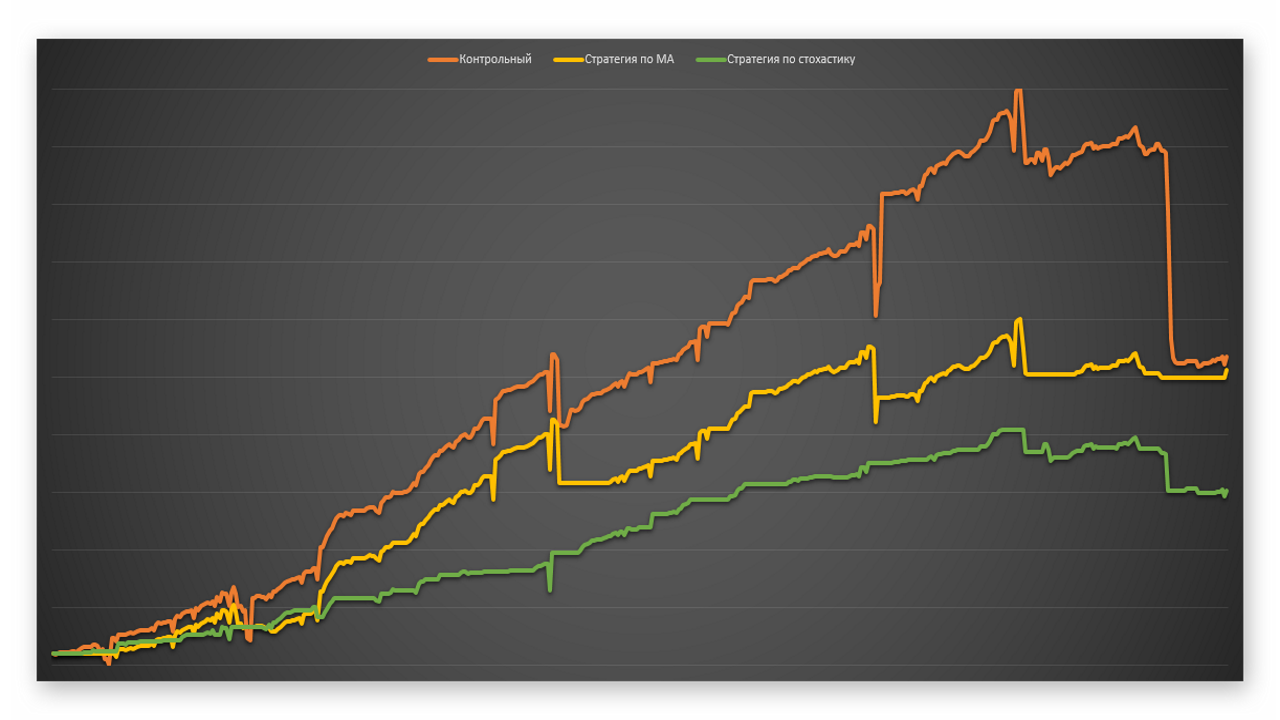
- Abeiks – this example shows where the strategy works poorly. The manager sits out losses, changes vehicles like gloves and there is no stability at all in the account. For technical analysis to work, stable trading and a smooth return schedule are required, otherwise a lot of profit will be lost due to MA lags.
- Control balance: $4626
- Final balance on MA: $1864
- Final balance on Stochastic: $4331
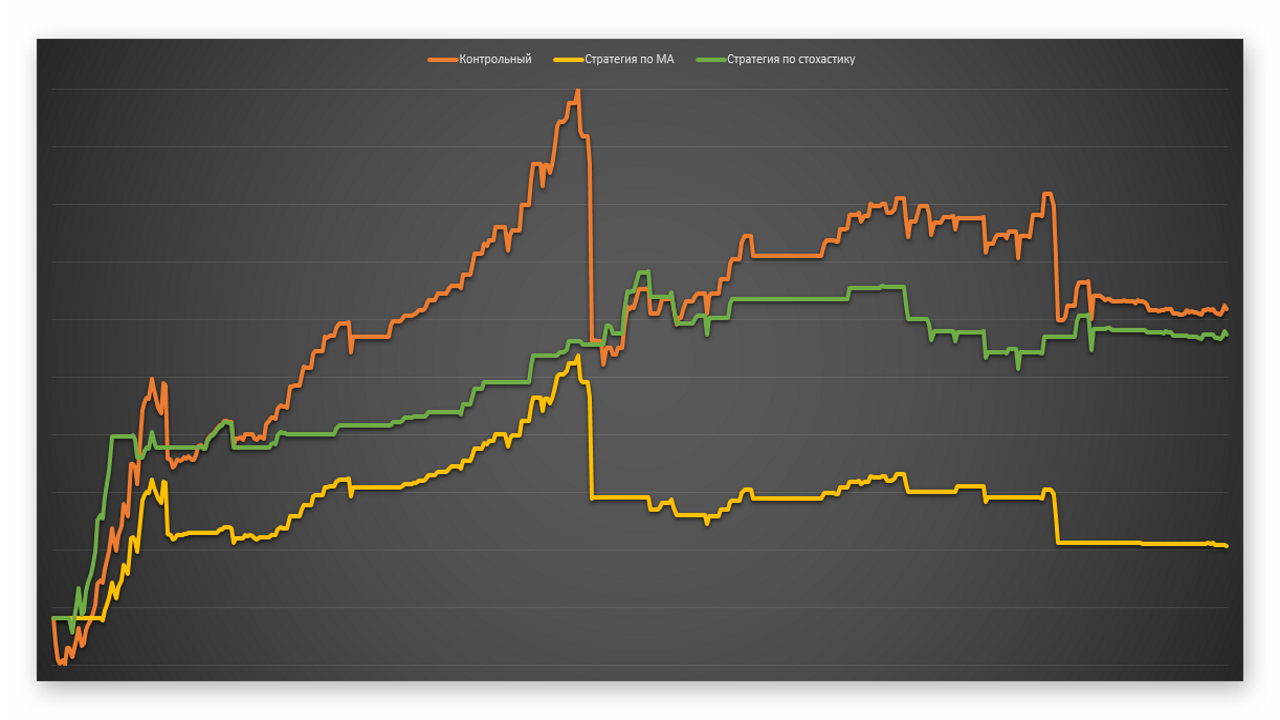
- Ahh - clear signs of an aggressive martingale - the drawdown in the middle is proof of this. The strategy does not handle such situations well, since the rollover in our case occurs once a day, and the loss on the martingale grows very quickly, in most cases, most of the deposit is lost in a day. So it turns out that by the time the drawdown is detected, it is too late to exit, and instead of cutting losses, we cut profits.
- Control balance: $1384
- Final balance on MA: $1276
- Final balance on Stochastic: $1262
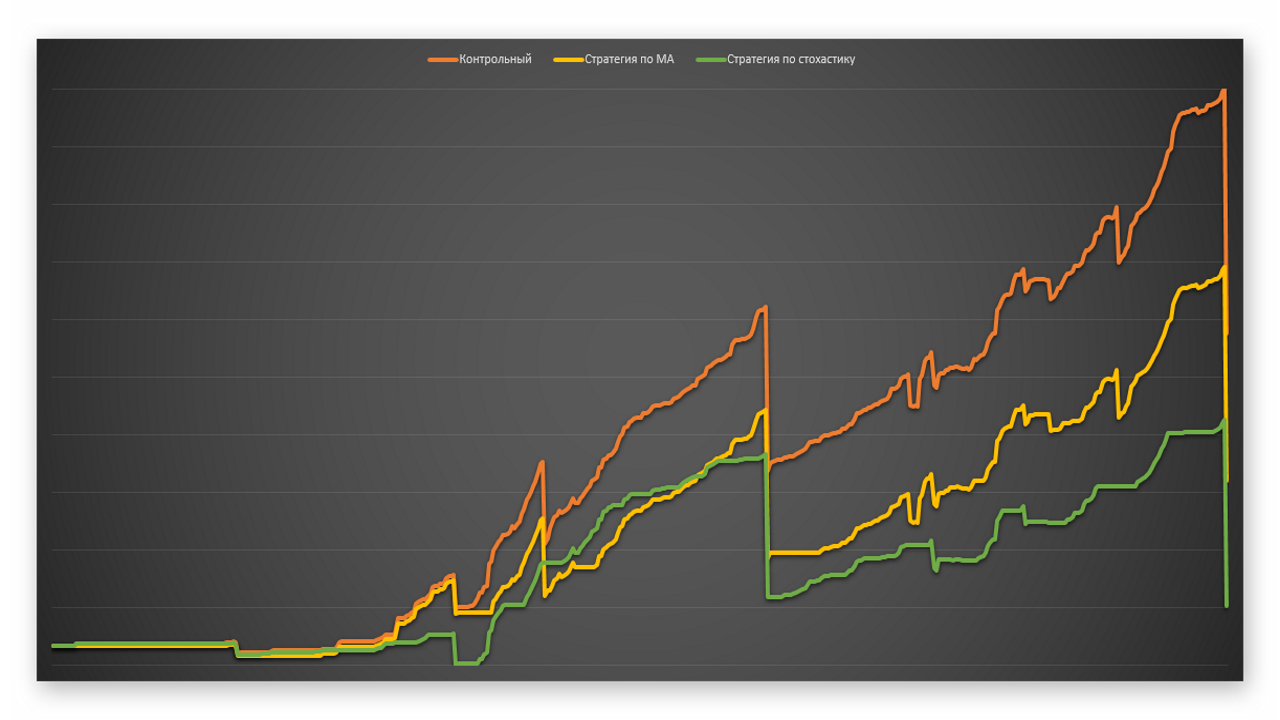
- Cuxirezo – GBPUSD is traded on the hourly timeframe, but the trend is determined by the weekly chart. The risks are average, about 15% of the deposit. To determine the entry, primitive technical analysis is used. There are few trades, all with stops (this can be seen from the chart). According to the manager, the payback period should not exceed six months. Interestingly, he also recommends using a portfolio strategy. In this case, fairly stable trading with clearly defined stops played into our hands. If there are patterns in the input data, technical analysis works well.
- Control balance: $1033
- Final balance on MA: $1119
- Final balance on Stochastic: $959
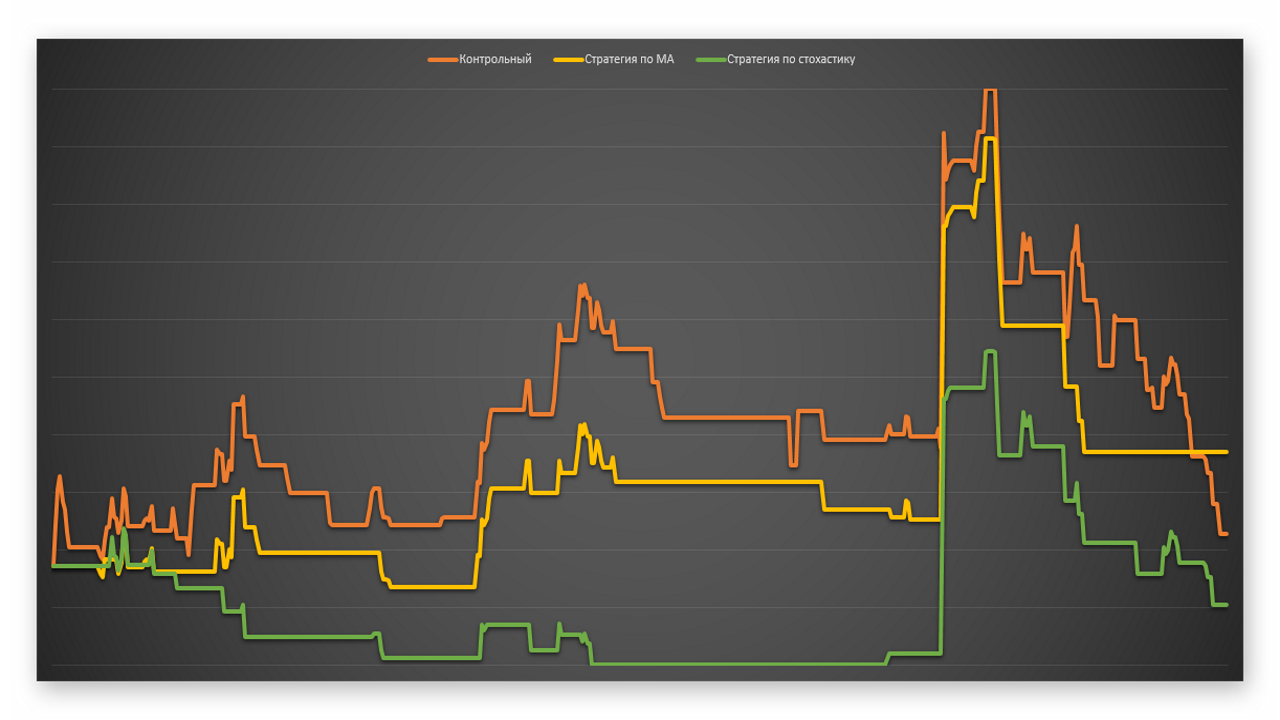
- CoolFlame - in fact, there was no profit on this account - PAMM almost immediately went into the red. The risk for each order is 5%. But, naturally, when it comes to sitting out, the risk is many times greater, and the leverage of 1:500 is used to its fullest. There is no clearly developed strategy, so investing on drawdowns does not give any impressive results.
- Control balance: $3657
- Final balance on MA: $1643
- Final balance on Stochastic: $5150
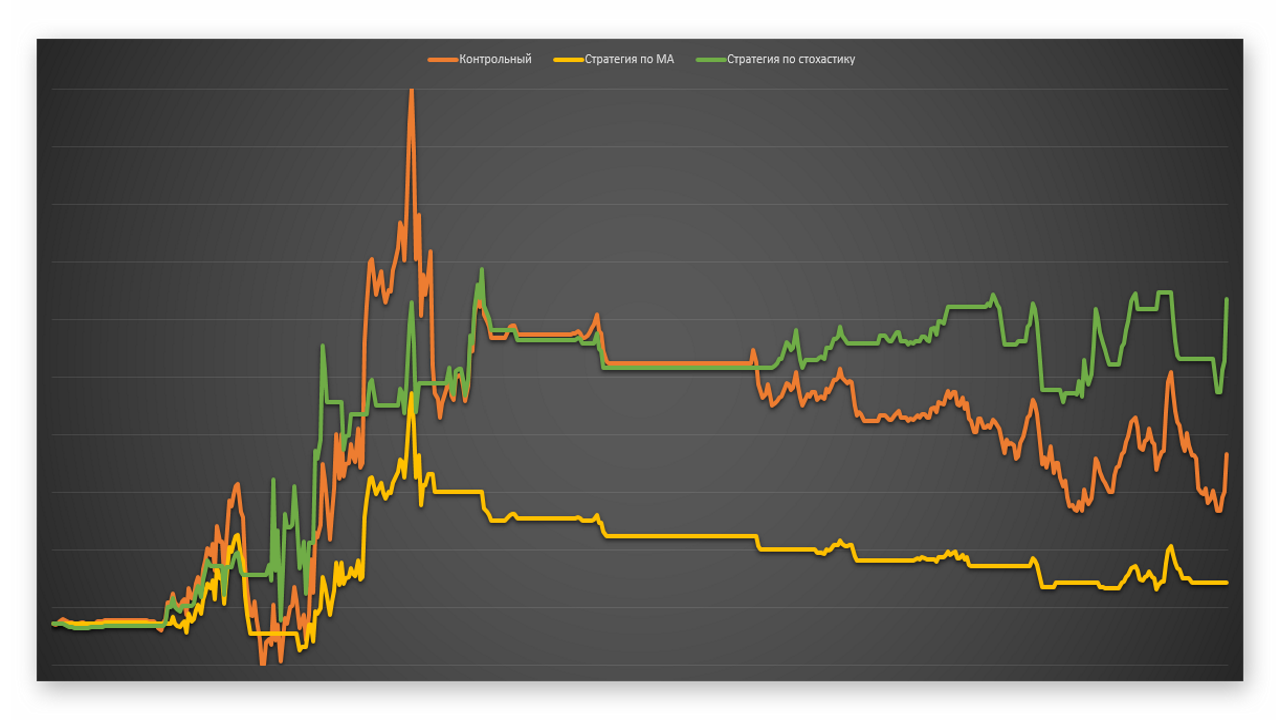
- AlexStarkov is an example of where an investment strategy really works. A strictly defined risk (for all two years the load did not exceed 10% of the deposit) and the precise operation of the automatic trading system allows you to reduce losses to a minimum. The instrument used is EURUSD, an hourly chart, which also to some extent contributes to the stabilization of trading results. In such a simple way, using one trading system you can easily increase the profits of another.
- Control balance: $800
- Final balance on MA: $932
- Final balance on Stochastic: $854
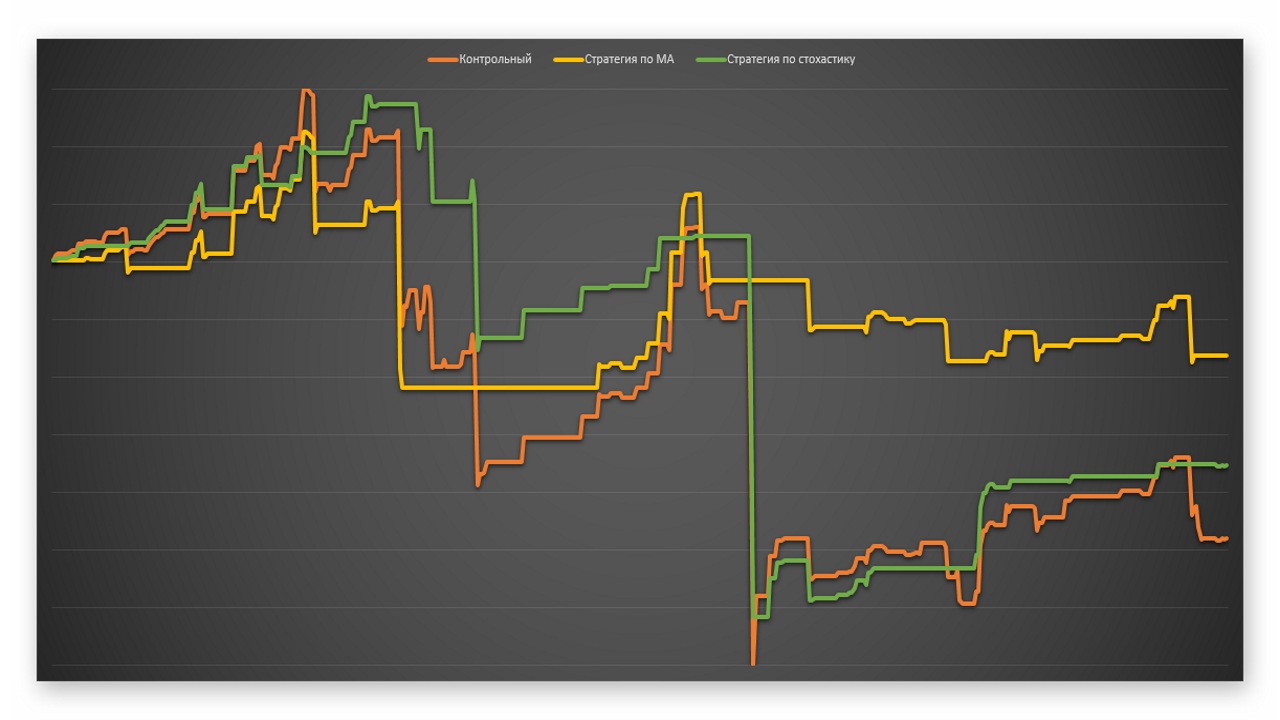
- Ametisto – the strategy worked well for the second part of the trading period. Risks have decreased and trade has stabilized and, at the same time, the results of the PAMM project have become more predictable. The flat periods on the right chart correspond to periods when investments are withdrawn from the account when the moving average of returns turns downward. When an account has periodic ups and downs and moderate volatility, this approach avoids unprofitable periods.
- Control balance: $1598
- Final balance on MA: $1670
- Final balance on Stochastic: $1073
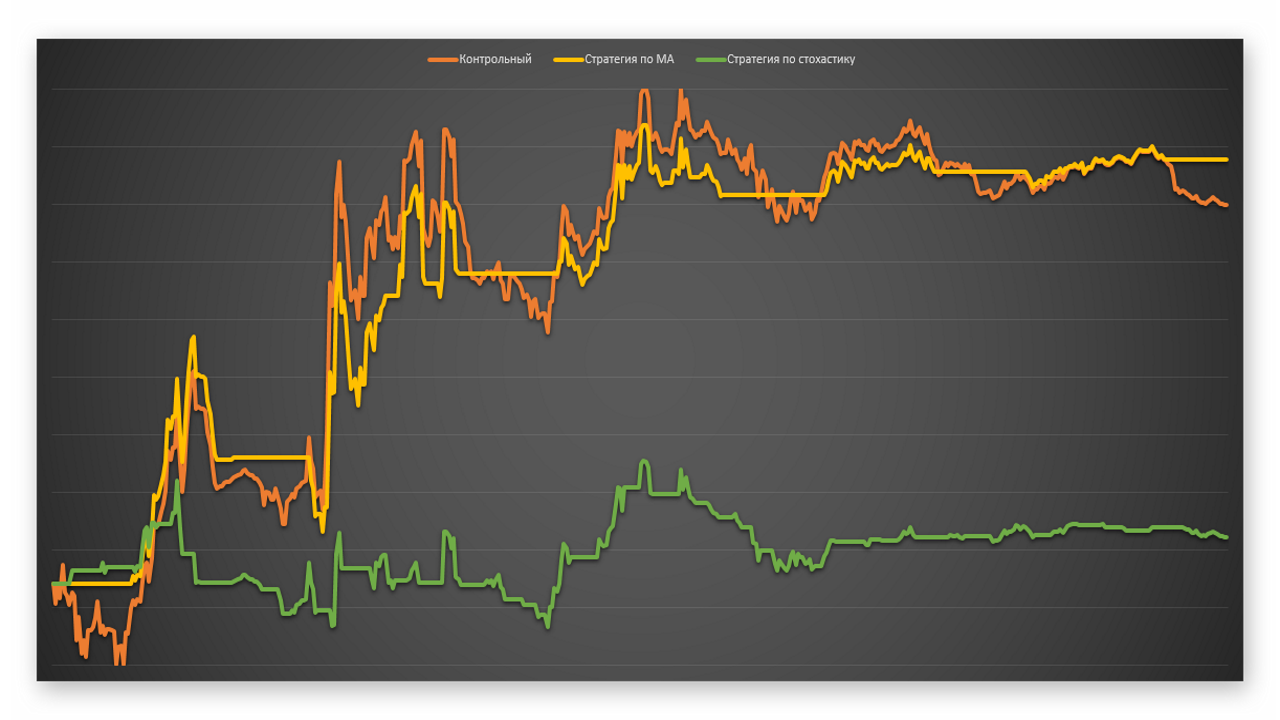
- _LowRisk_ — and now let us look at one of the worst-case scenarios. Nobody wants to deal with grid traders, and I think it is obvious why. Here, the manager’s lack of experience, a standard averaging robot, and high leverage create an explosive mix that leads to crazy volatility in the account and makes technical analysis inapplicable. The trader himself recommends entering on a drawdown, which once again indicates his level of preparedness. If you do invest in such a strategy, then do it without unnecessary movements, with a single investment. Otherwise, we will constantly be late with entries in the hope of seeing a profit that never materializes.
- Control balance: $889
- Final balance on MA: $538
- Final balance on Stochastic: $638
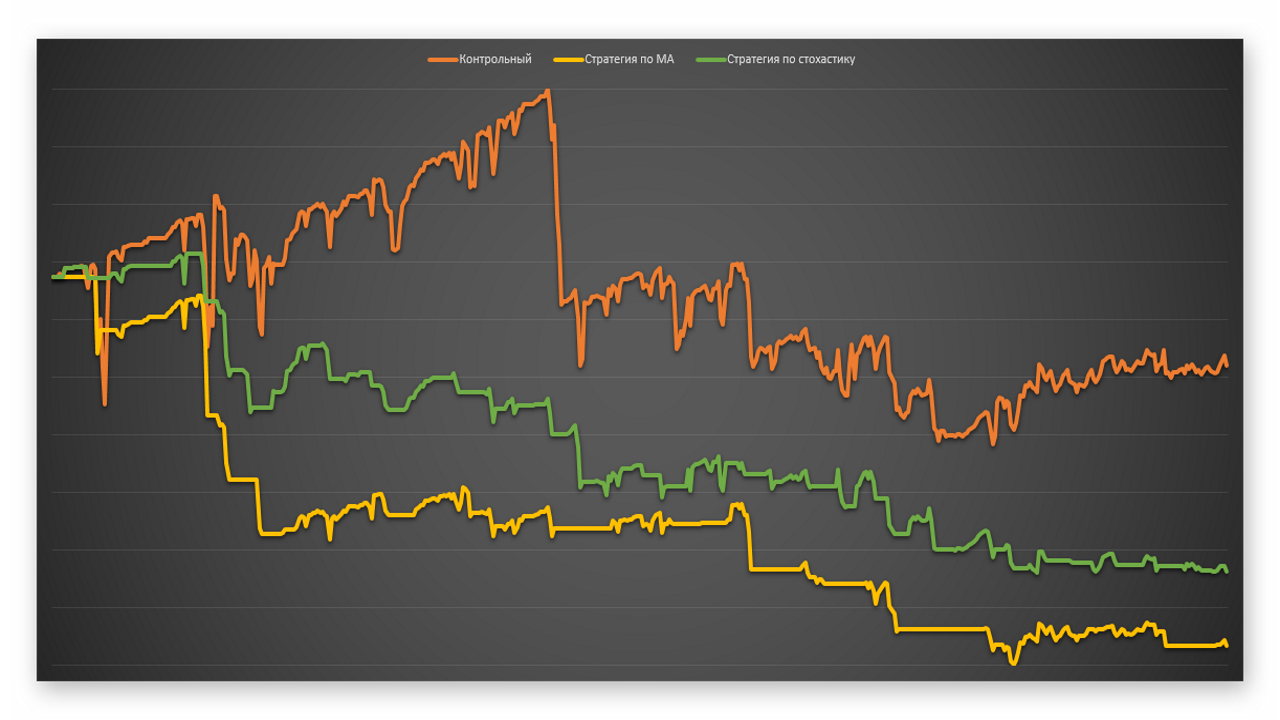
- 2014-01-05Su is not the best account for the investment strategy, since approximately in the middle of the period there was a change in the vehicle. Initially, a conservative trade was planned, which was later replaced by a much more aggressive strategy. Despite such metamorphoses, the MA investment strategy helped avoid several large drawdowns, with virtually no impact on profitability. We may not have won anything here, but the risks have been significantly reduced.
- Control balance: $1931
- Final balance on MA: $1724
- Final balance on Stochastic: $2177
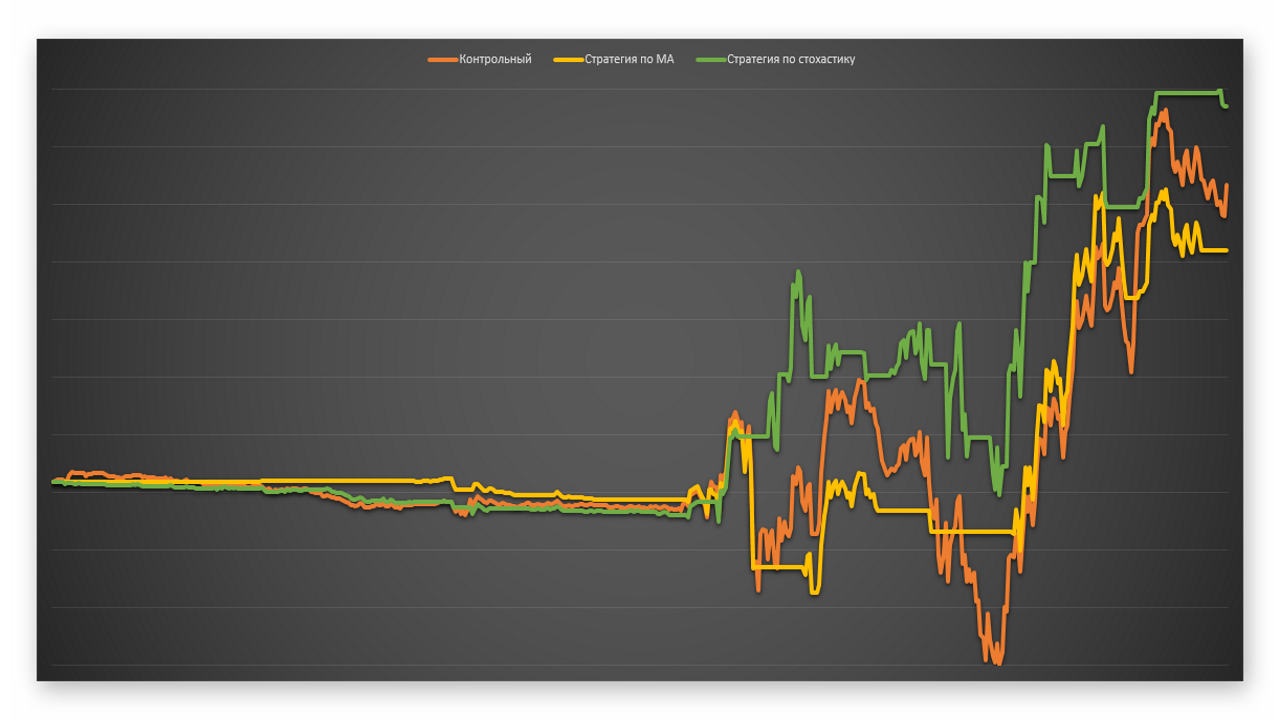
- FSC – the chosen strategy insures us against complete loss, the possibility of which always exists. When the trader neither loses nor earns money, the following situation arises - as soon as we decide to deposit money, the manager again enters a drawdown.
- Control balance: $2328
- Final balance on MA: $1533
- Final balance on Stochastic: $2264
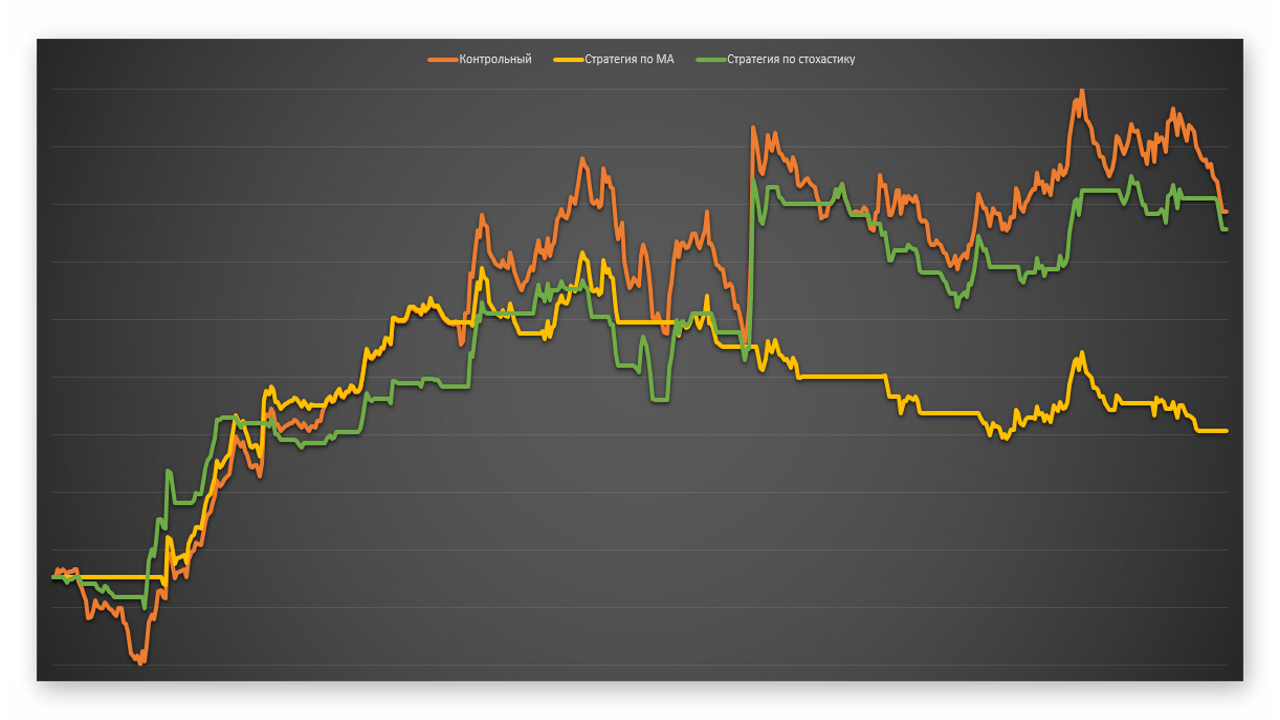
- Conservative trade 1 – this account belongs to one very active trader. Its developments are characterized by great complexity and low efficiency. The extremely unstable risk policy is not at all in our favor - at the beginning of the period we were dealing with a conservative strategy, after which the volatility of returns increased by an order of magnitude. And although the strategy did not bring profit, it still allowed us to avoid the biggest drawdowns.
- Control balance: $1024
- Final balance on MA: $956
- Final balance on Stochastic: $819
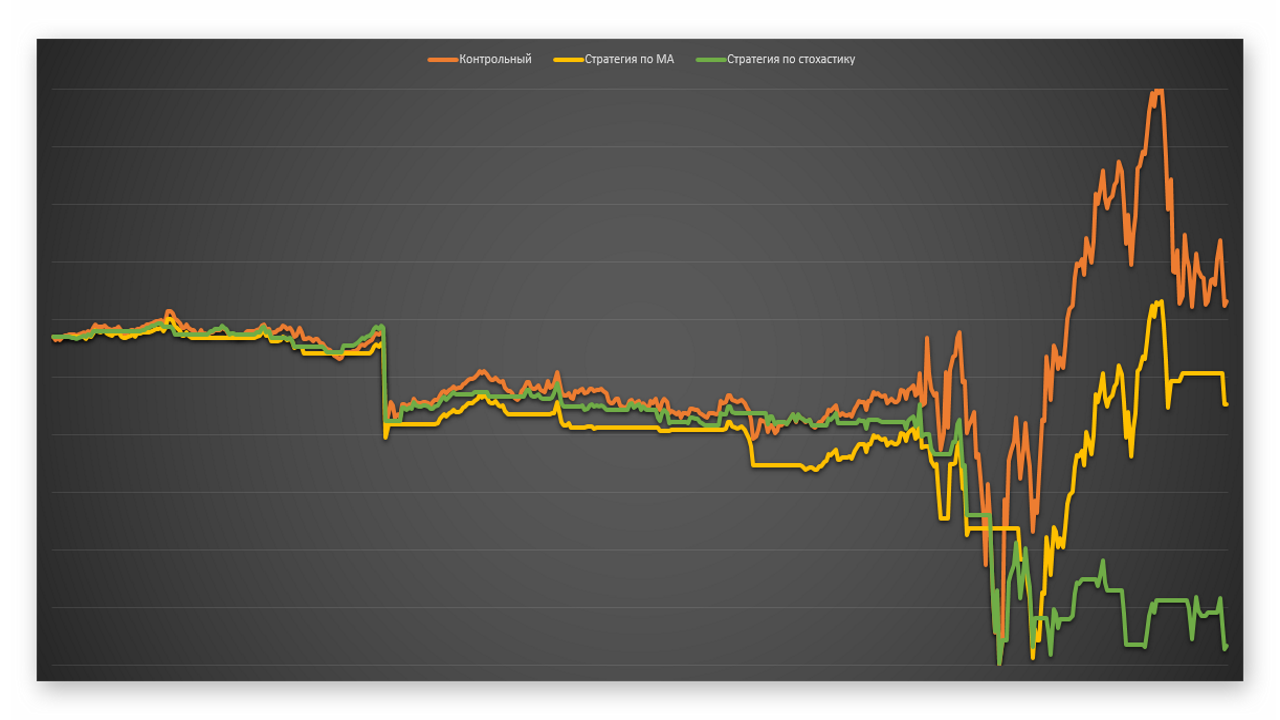
- 325 - when it comes to openly unprofitable projects, the investment strategy shows maximum efficiency. We still lose money on corrections and false rallies, but it doesn't compare to the losses we would have had if we had simply deposited at the beginning of the period and withdrawn at the end.
- Control balance: $392
- Final balance on MA: $973
- Final balance on Stochastic: $453
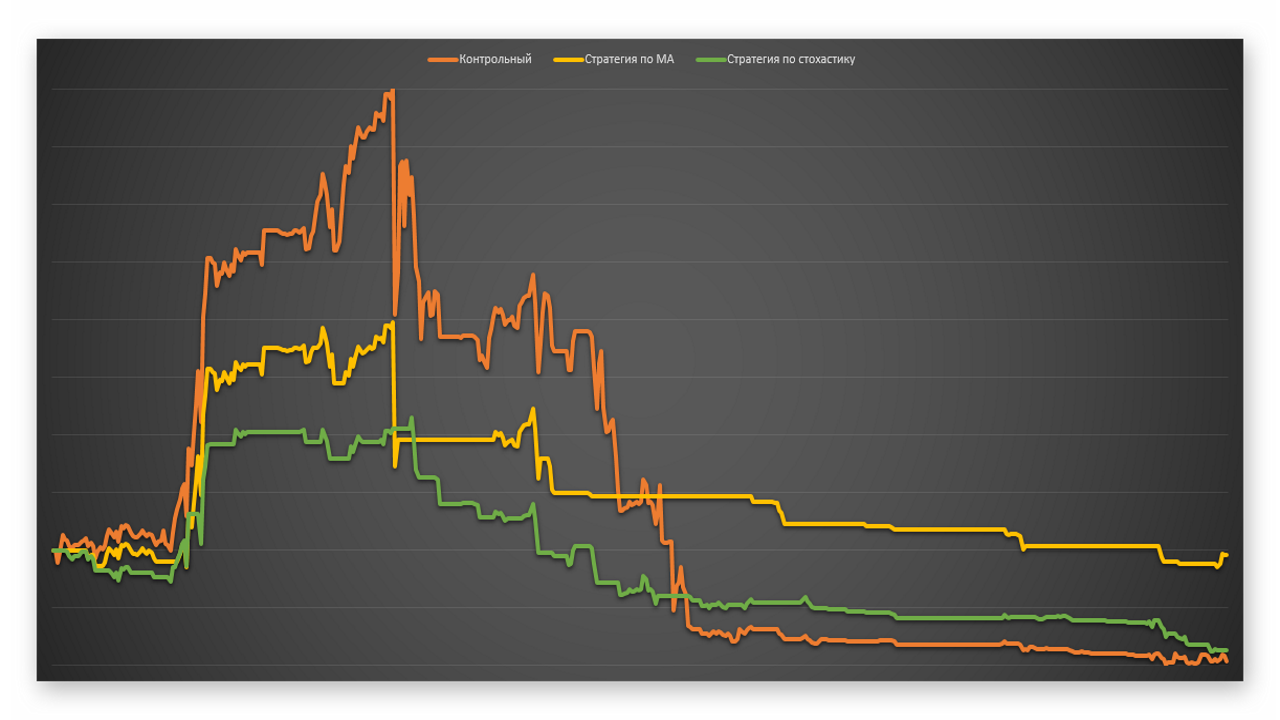
- 311177 – a small number of transactions and manual trading on a high timeframe. The trading result is unstable and the moving average in this case is clearly not entirely suitable. The final losses are not as large as the drawdown.
- Control balance: $930
- Final balance on MA: $820
- Final balance on Stochastic: $869
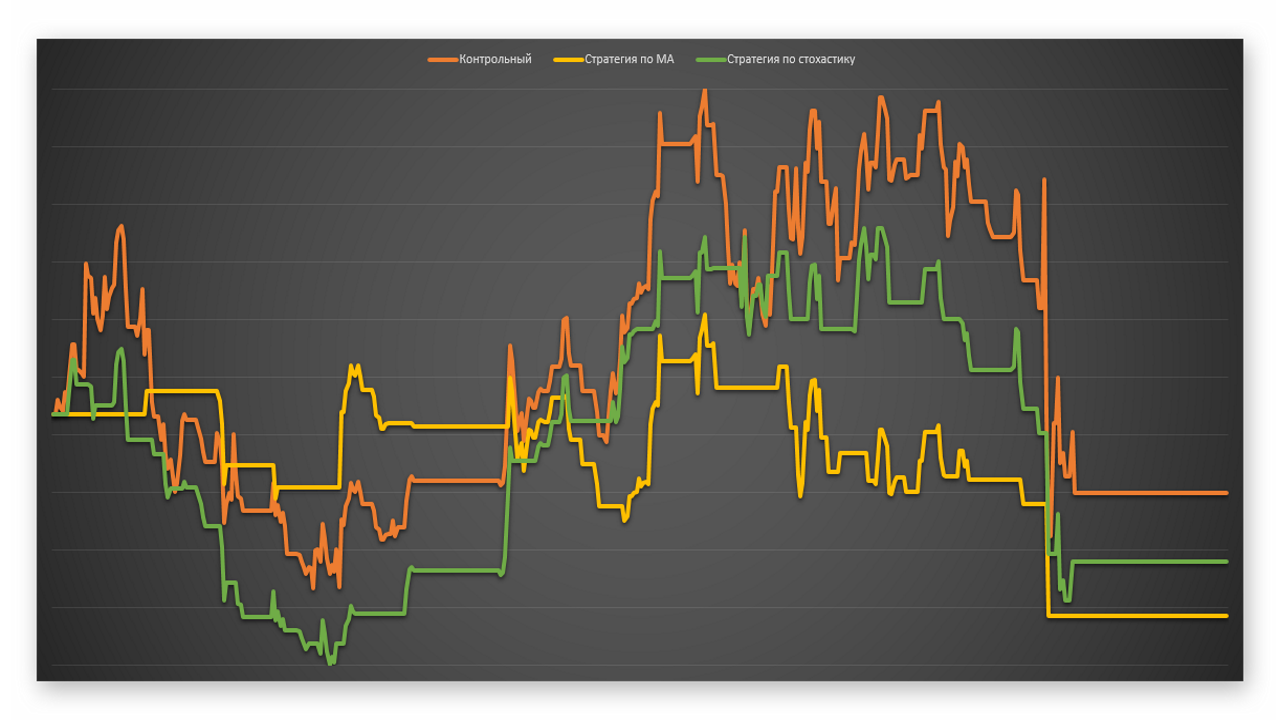
- Amelia – here we also see one of the worst scenarios, as in option number 12. Extremely unstable trading on the account and the lack of a clear trading system have a bad effect on the predictability of profitability. As a result, risks did not decrease, and profits fell.
- Control balance: $1799
- Final balance on MA: $1268
- Final balance on Stochastic: $1337
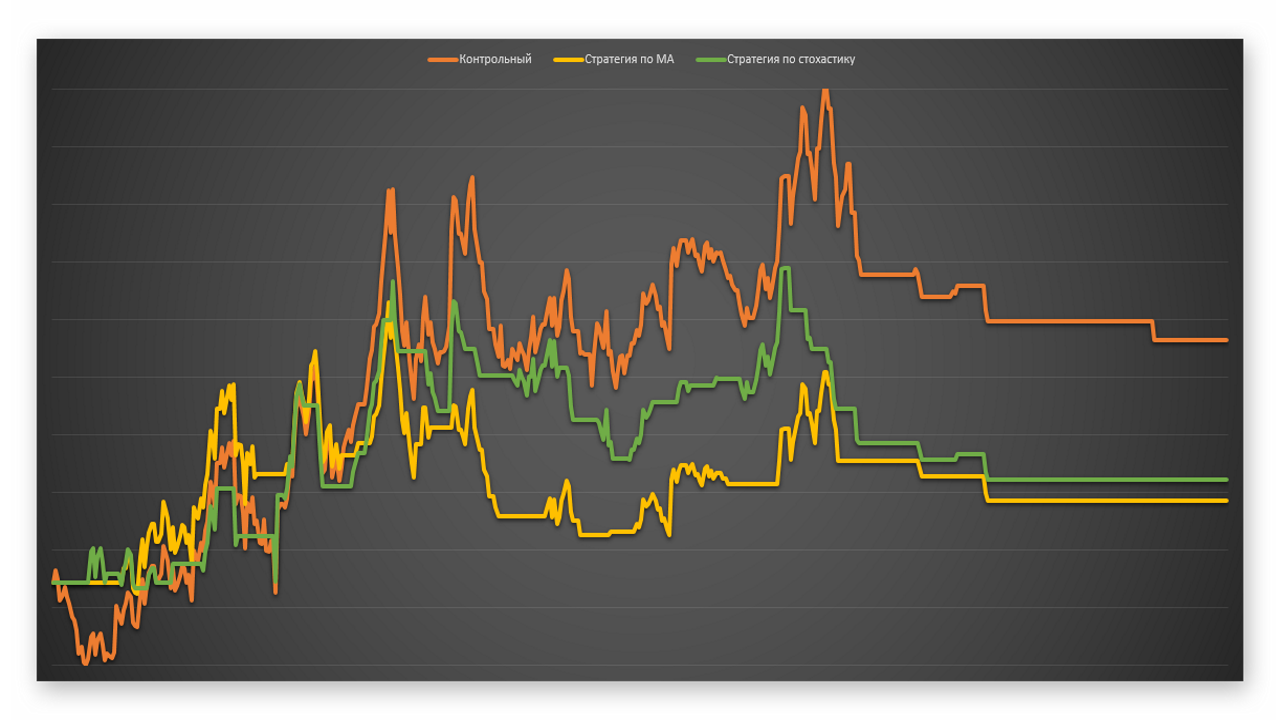
- Abailard – there is no gain in profit, but we have reduced the risks – the relative drawdown has decreased significantly. Trading throughout the entire period was quite stable, maintaining the MM level set at the beginning.
- Control balance: $1036
- Final balance on MA: $959
- Final balance on Stochastic: $824
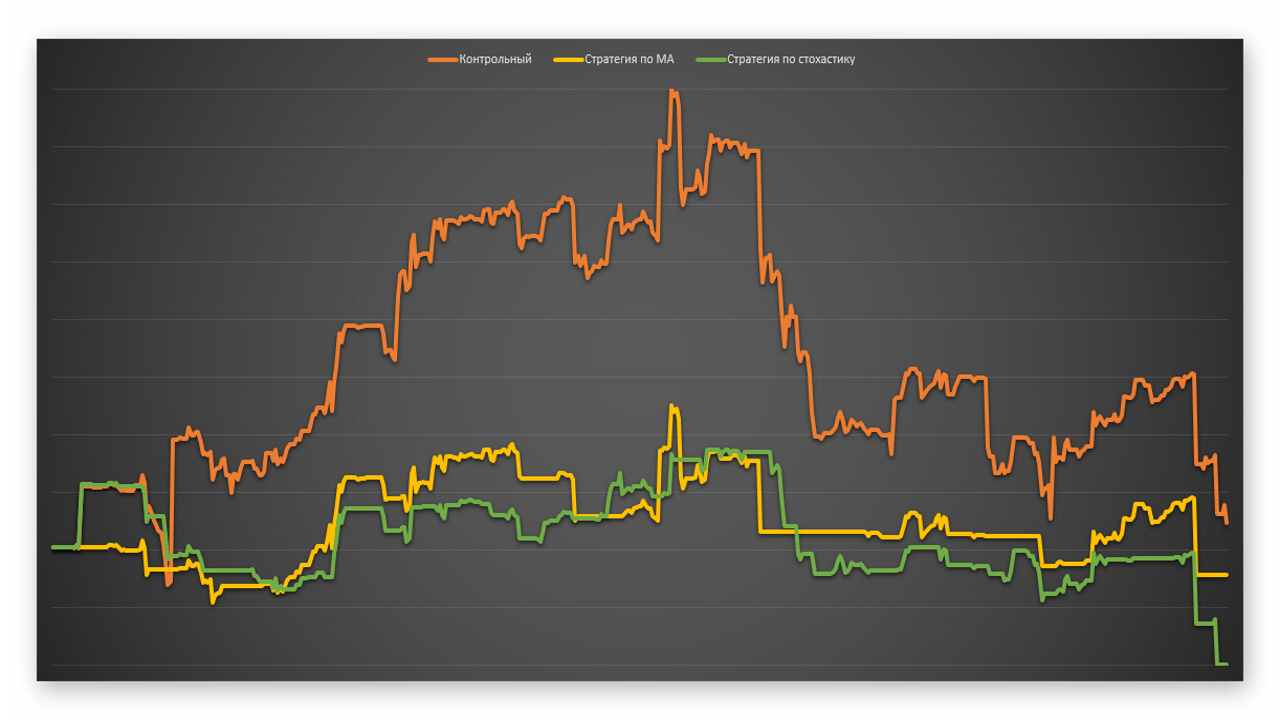
- ALEXX – the investment strategy is clearly the winner in this pair. Despite the low profit, the strategy allowed us to avoid a simply gigantic drawdown. As a result, we got an almost flat chart, instead of a big loss in the middle of the trading period. We would not have received such an advantage if the drawdown had occurred within one day (let me remind you that the strategy’s reaction time is equal to one trading day).
- Control balance: $1443
- Final balance on MA: $1068
- Final balance on Stochastic: $1233
Conclusion

Investment strategies did not show unambiguous effectiveness in every case. In some places we see an increase in profitability, while in certain cases we even see an increase in losses. Nevertheless, in most cases technical analysis helped reduce losses and also showed a better profit-to-drawdown ratio.
The problems of analyzing a PAMM profitability chart are almost the same as when analyzing conventional price charts - poor predictability of results. Inexperienced traders often change risks, strategies and heavily load the deposit. In most cases, this leads to at least unstable profitability, and at most to a complete loss. It is important to understand that with poor predictability of profitability, no strategy will show good results. In fact, such investing will not be fundamentally different from trading any currency pair.
And yet advanced strategies have great potential, as can be seen in some of the accounts we tested. At the very least, even the most primitive strategy can protect you from large losses. Use strategies wisely, choose PAMM accounts for your portfolio carefully, and you will be able to protect yourself to some extent from unexpected blow-ups, and perhaps even increase the profitability of your investments. Also, follow our monthly Investor's Digest.
Download script for displaying charts of PAMM accounts in MT4

Best regards, Alexey Vergunov Tlap.io
