
Divergence in Trading: How It Works and Practical Applications

Divergence is one of the key technical-analysis signals that experienced traders regard as especially important. It occurs when an asset's price and technical indicators move in opposite directions: the instrument's chart makes new highs, while RSI or MACD can no longer keep pace and forms lower values.
The operating principle of divergence is based on analyzing the interaction of market forces. While price shows the outcome of the battle between bulls and bears, indicators reflect the movement's key characteristics—its speed, strength, and structure.
The signal value of divergence lies in its ability to indicate potential changes in market conditions in advance. Traders use this signal to:
Forecast a slowdown in the current trend
Identify possible corrective movements
Determine potential reversal points.
What Divergence Is in Simple Terms
Divergence is an important technical-analysis signal that helps reveal when a trend may weaken or reverse. Let us examine it with a simple example.
Imagine driving a car uphill. At first, the engine runs at full power and the speed increases. Then, although the car continues climbing, its speed begins to fall. The upward movement formally continues, but the power needed for further acceleration is running out.
How It Works in the Market
A similar situation occurs in trading when an asset's price continues rising but the strength of that rise weakens. Let us consider specific figures.
With bearish divergence, the price chart shows new highs: 100 → 105 → 110 → 115, while the momentum indicator declines: 80 → 78 → 75 → 71.
With bullish divergence, the price chart forms new lows: 100 → 95 → 90 → 85, while the momentum indicator rises: 25 → 29 → 34 → 38.
The Mathematics of Divergence
Divergence is a phenomenon that can be described through mathematical time-series analysis. It may seem complicated at first glance, but it is actually quite simple.
It is based on analyzing two main parameters: the asset's price chart and the technical indicator's chart.
Traders analyze not the values themselves but the direction in which they change. Price is represented by the time series P(t), while the indicator is represented by a second time series, I(t).
Consider a specific case using real figures. Suppose the BTC price changes from $60,000 to $64,000, an increase of 6.7%. At the same time, the RSI indicator falls from 74 to 66.
Mathematically, this is expressed as follows: the price change (ΔP) is greater than zero, while the indicator change (ΔI) is less than zero.

In its simplest form, this can be represented as a comparison of the slopes of two lines.
When price forms an uptrend (positive slope) while the indicator shows a downtrend (negative slope), a divergence arises.
Suppose price forms highs of 100 and 110, while the indicator shows values of 75 and 68, respectively. This is a typical case of price making a new high while indicator values decline.
With the bullish type, the situation is reversed: price falls from 100 to 90, while the indicator rises from 25 to 34. Here, price makes a new low while the indicator makes a new high.
The key point in divergence analysis is to compare consecutive extrema rather than the indicators' absolute values. This approach makes it possible to identify a genuine divergence between price and the indicator.
Why Divergence Occurs in the Market
Divergence appears because price and technical indicators reflect different aspects of market conditions. Price shows the final outcome of trades but does not explain exactly how the market reached that outcome.
Imagine two scenarios in which Bitcoin's price moves from $60,000 to $65,000.
In the first case, the rise occurs amid an active influx of buyers. Market participants show strong interest and are willing to pay more, while trading volumes increase and create a sustainable uptrend.
In the second scenario, the price also rises to $65,000, but the situation is different. The number of buyers is decreasing, and sellers are virtually absent at these levels. The remaining active buyers support the rise, but overall buying interest declines.
Outwardly, both scenarios look the same—the price is rising. However, the movement's internal structure differs fundamentally:
In the first case, the trend remains strong and has the potential to develop further
In the second case, the market is approaching an exhaustion phase as buyers' strength runs out
Technical indicators help reveal these differences before they appear on the price chart. They capture changes in market dynamics, showing:
Declining buyer activity
Weakening momentum
Changes in the balance of power among market participants
Divergence and Market Psychology
Divergence is not merely a chart pattern but a reflection of real changes in market participants' behavior. To interpret this signal correctly, it is important to understand the processes behind each price movement.
Market Top

Consider a rising market. When an asset is in a strong uptrend, the following occurs.
The price reaches 100, and most participants see this as a buy signal. An active wave of demand begins, pushing the price upward—first to 105 and then to 110.
However, the market structure gradually changes. Early buyers who planned to enter at 90–100 have already opened their trades. New participants must buy at significantly higher prices. At the same time, the first buyers begin taking profits.
As a result, the price continues rising, but each subsequent step upward requires increasingly greater effort. Indicators that measure market momentum begin to show weakening movement: the first rise is accompanied by strong momentum, while the second is noticeably weaker. This is how bearish divergence forms.
It is important to understand that this does not mean an immediate trend reversal. It is merely a signal that the upward movement is losing its previous effectiveness.
Market Bottom

A mirror-image process occurs in a falling market. When the price declines from 100 to 70, sellers appear to have complete control. However, the picture gradually changes:
Most weak participants have already realized their losses. At each new level, the number of aggressive sellers decreases. Meanwhile, buyers willing to enter positions at low prices begin to appear.
The price may form a new low (for example, 68 instead of 70), but sellers need increasingly greater effort to achieve it. Indicators record weakening downward momentum: the first decline is accompanied by a strong movement, while the second is noticeably weaker. Bullish divergence emerges.
Meaning of the Signals
Bearish divergence at a top shows that buyers are losing strength, although the price may still rise.
Bullish divergence at a bottom signals that sellers can no longer sustain the downward movement with the same intensity.
Types and Forms of Divergence in Technical Analysis
Technical analysis includes several key forms of divergence, each of which plays an important role in forecasting market movements.
Classic Divergence
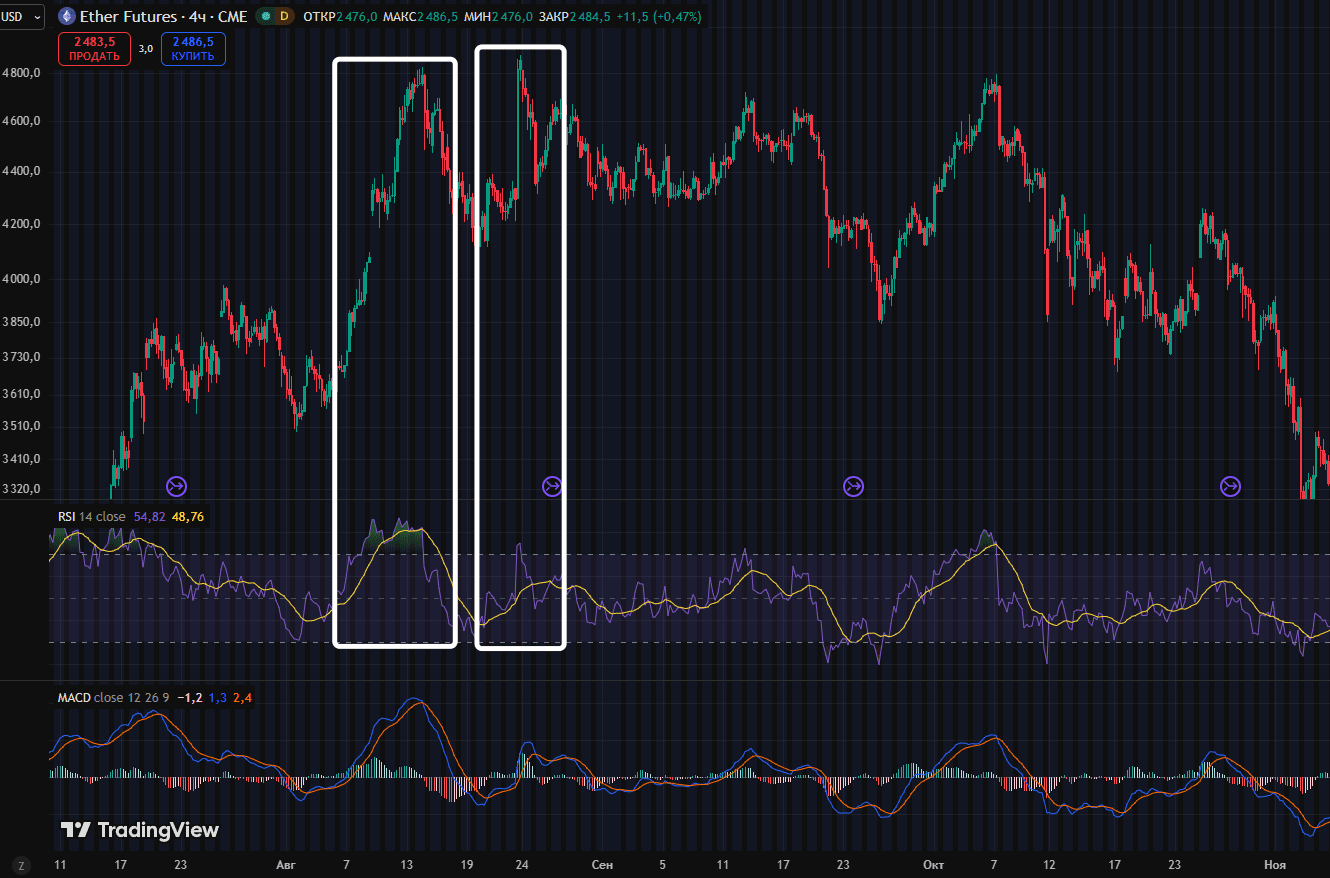
Bearish divergence appears during an upward price movement. In this case, the price chart forms new highs while the indicator shows declining peak values. This pattern often serves as a signal of a possible uptrend reversal.
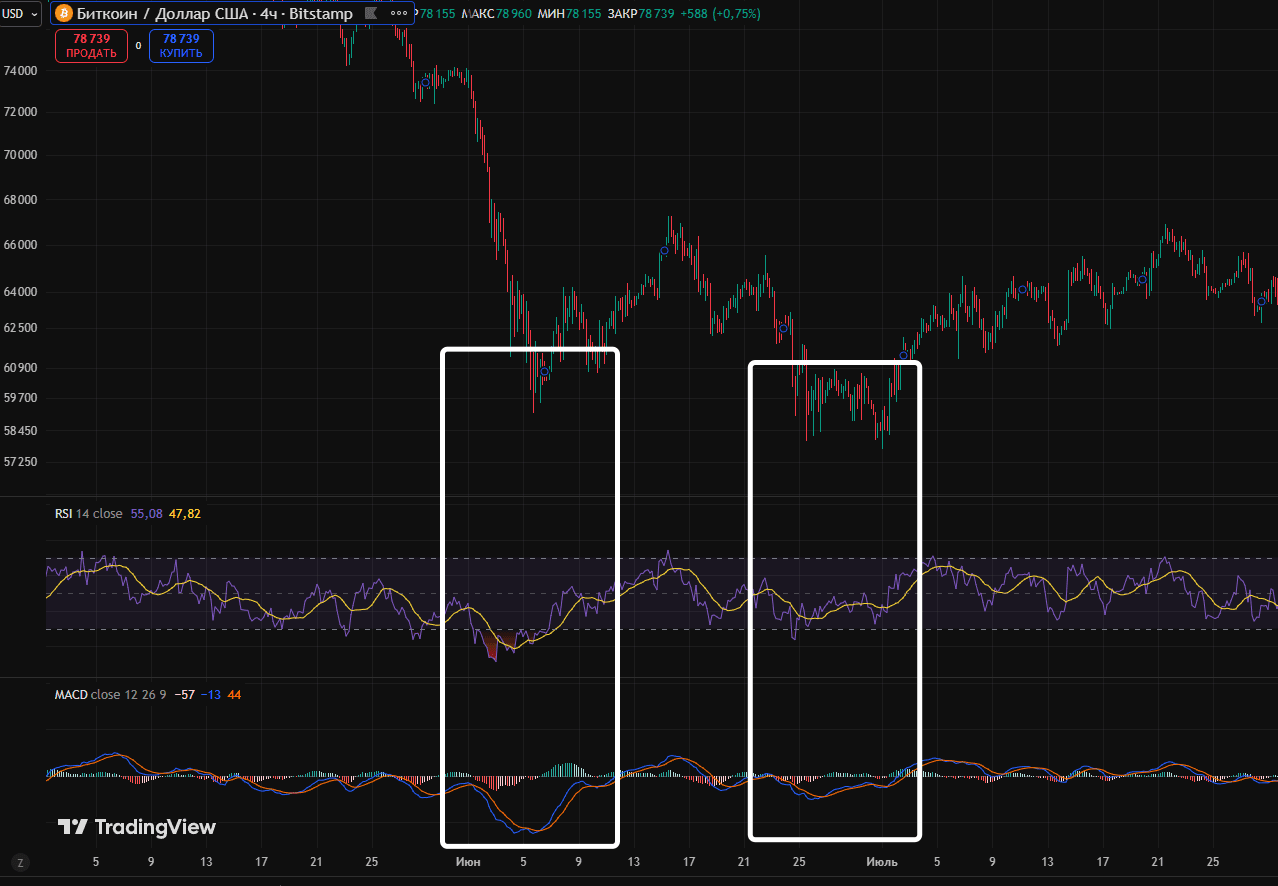
Bullish divergence is characteristic of a downward movement. The price forms new lows while the indicator shows rising low values. This may point to a possible end of the downtrend.
Hidden Divergence
Hidden bullish divergence is observed within an uptrend. Its distinctive feature is that price forms higher lows while the indicator shows lower lows. This pattern indicates a strengthening upward movement.
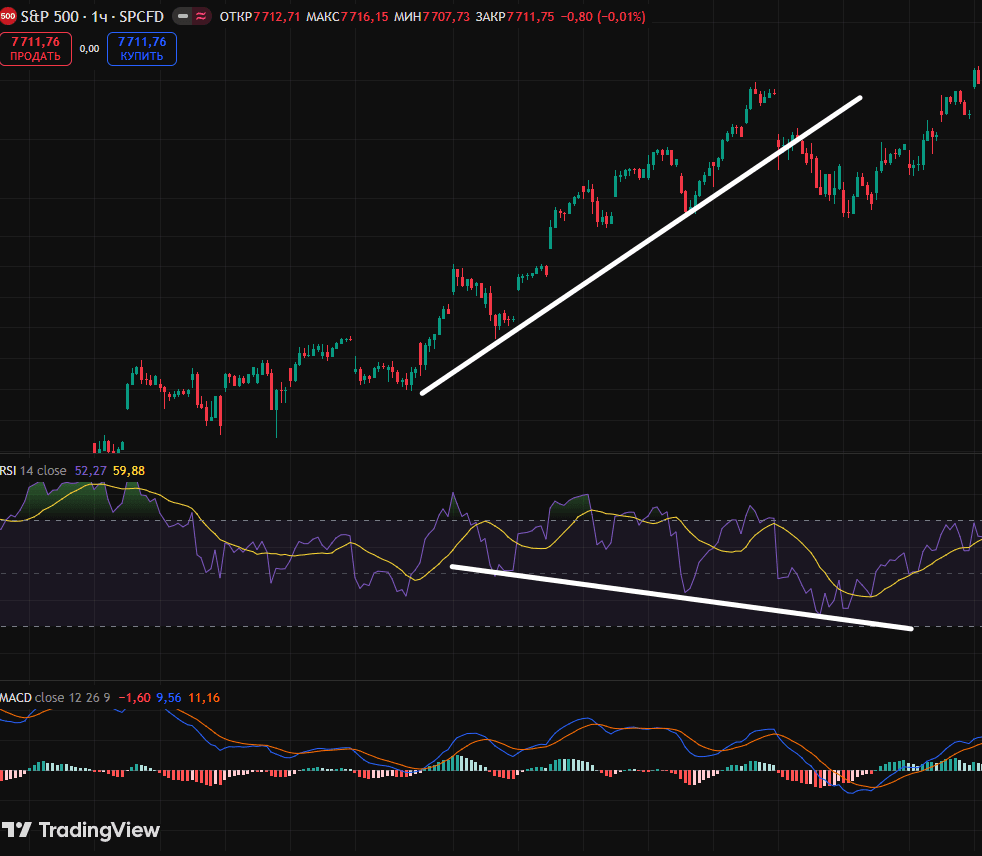
Hidden bearish divergence forms during a downtrend. Price creates lower highs while the indicator forms higher highs. This points to a possible strengthening of the downtrend.
Advanced Forms of Divergence
Multilevel divergence is distinguished by appearing simultaneously on several timeframes. Traders regard it as a more reliable signal that requires special attention.
Complex divergence includes several consecutive divergences and often precedes significant market changes or major corrections.
Each type of divergence has its own specific application. Classic forms help identify potential trend-reversal points, while hidden types indicate trend continuation. Advanced forms provide more reliable signals for making trading decisions.
Several key factors must be considered when working with different forms of divergence. First, it is important to assess the overall context of the market movement and trading volumes during pattern formation. Confirming signals from other indicators and the correct choice of timeframe for analysis are equally important.
Thus, correctly recognizing the forms and types of divergence allows traders to forecast market movements more accurately and improve the quality of trading decisions. This helps manage risk effectively and improve the performance of a trading strategy.
Divergence on Popular Indicators
RSI Divergence
RSI (Relative Strength Index) is one of the most common tools for finding divergences. This indicator measures the relative strength of price movements within a range of 0–100, most often using a period of 14.
The principle is simple: with bullish divergence, price forms a new low while RSI shows a higher low. With bearish divergence, price reaches a new high while RSI shows a lower high.
For example, if BTC rises from $60,000 to $63,000 while RSI falls from 77 to 69, this indicates weakening upward momentum.
It is important to remember that RSI divergence does not guarantee an immediate trend reversal and requires confirmation from other signals.
MACD Divergence
The MACD indicator is based on the difference between two exponential moving averages (usually with periods of 12 and 26).
When price rises (for example, 100 → 110 → 115) while the MACD value falls (+8 → +7 → +5), this signals a weakening trend. Such a signal is especially important during strong trends, where it may indicate movement exhaustion.
Stochastic Divergence
Stochastic Oscillator is effective in markets with wave-like price movement. Its signals are most informative near:
Support and resistance levels
Overbought and oversold zones
The completion of corrections
Extrema of major trends
CCI Divergence
Commodity Channel Index helps determine whether a new price movement is accompanied by the same strength as before. For example, if price reaches a new high while CCI shows a lower peak, this may indicate a weakening trend.
Volume Divergence
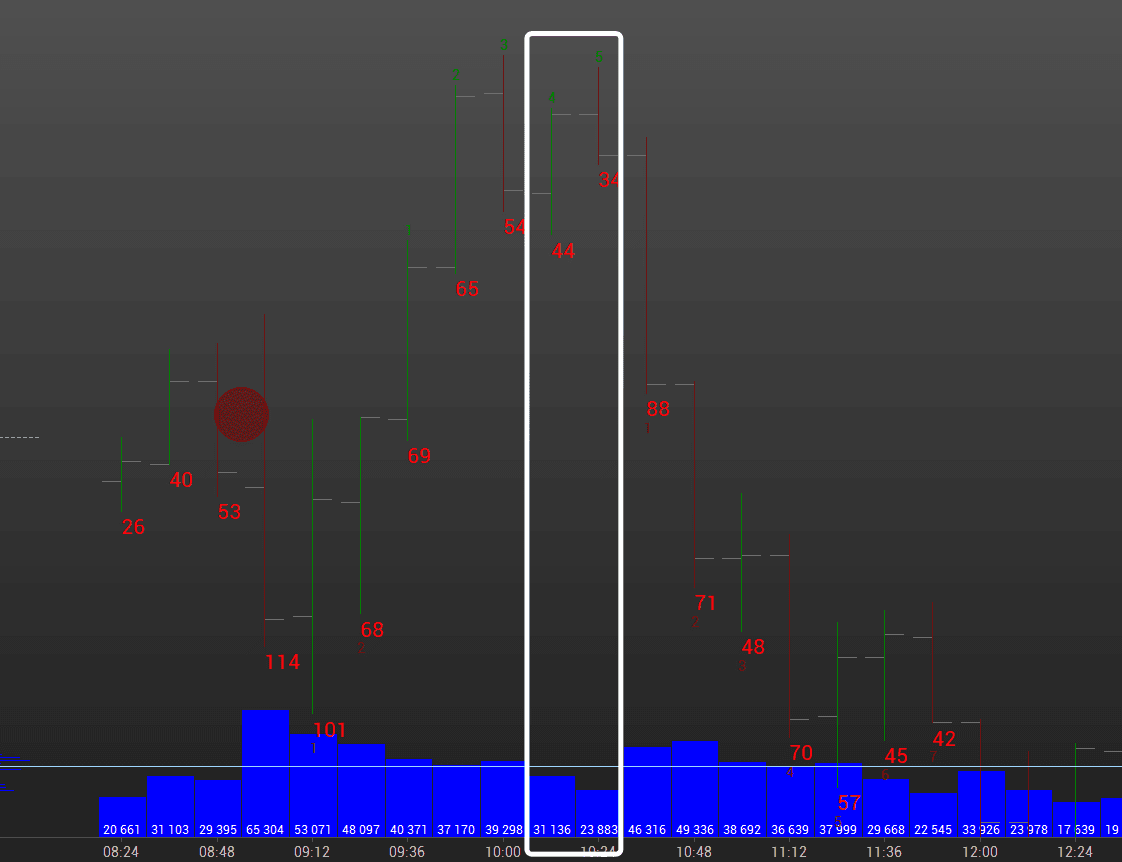
Volume analysis reveals divergence between price and trading activity. If price rises (100 → 105 → 110) while volume falls ($1.2 million → 900,000 → 700,000), this may signal a weakening trend. However, the time of day and market liquidity must be considered.
CVD Divergence
Cumulative Volume Delta shows the difference between aggressive buying and selling. For example, if price rises (60,000 → 61,000 → 62,000) while CVD falls (+500 → +350 → +100), this indicates decreasing aggressive buying pressure.
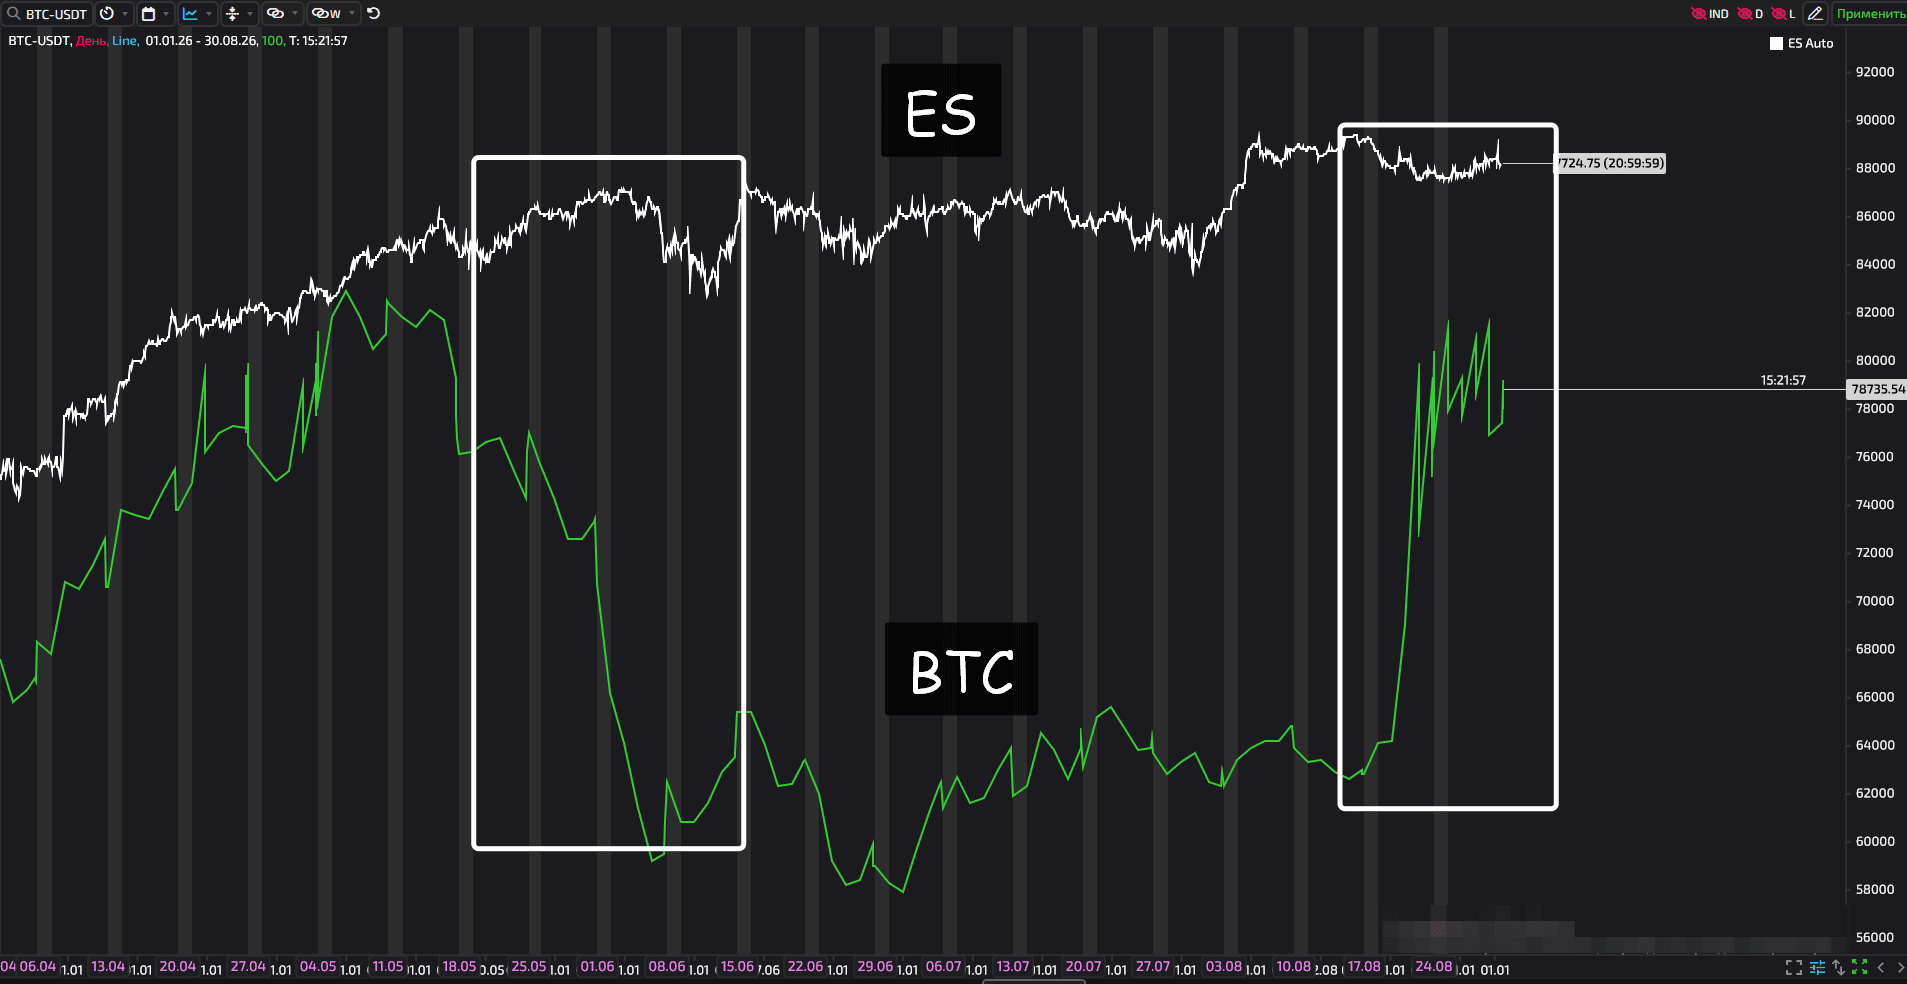
Intermarket Divergence
Sometimes a discrepancy between related markets is called divergence. For example:
Bitcoin rising while Nasdaq stagnates
Bitcoin reaching a new high without a corresponding movement in Ethereum
Such signals help assess changes in market structure relative to other assets.
How to Confirm Divergence
The most interesting situations occur when divergence coincides with other factors.
For example:
divergence + support or resistance level;
divergence + break of the trend structure;
divergence + change in volume;
divergence + candlestick pattern;
divergence + Fibonacci;
divergence on several indicators.
The more independent signs point in the same direction, the more interesting the trading scenario becomes.
However, signals cannot simply be counted. It is important that each indicator adds new information rather than merely duplicating the same calculation.
Divergence as an Indicator of Major Market Movements: Case Analysis
All weekly charts were taken from TradingView.
Bitcoin's 2021 All-Time High
November 2021 was a landmark period for the cryptocurrency market. On November 10, Bitcoin reached an all-time high of around $69,000. During this period, technical analysis showed clear signs of bearish divergence recorded by the RSI and MACD indicators.
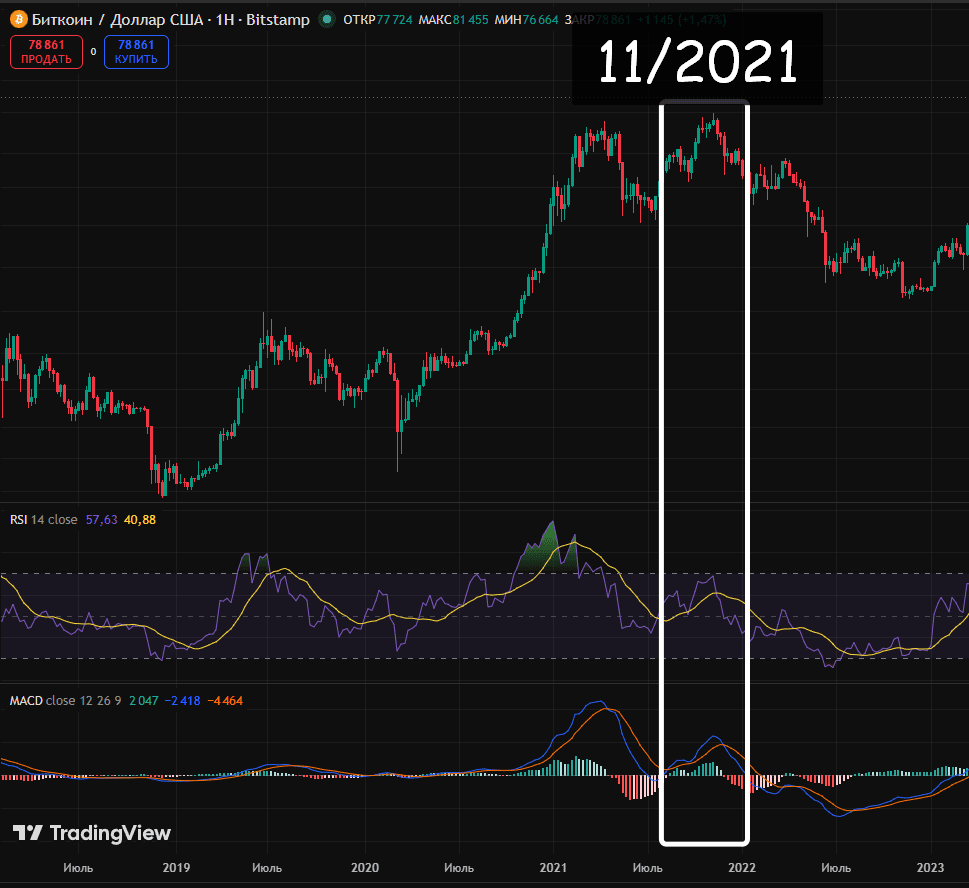
After reaching the peak, the market entered a prolonged correction phase. By the end of 2022, Bitcoin's price had fallen to $15,500, representing a correction of about 77.5% from the all-time high.
It is important to note that this example should not be regarded as an opportunity for a flawless short position from peak to bottom. The correction period included substantial fluctuations and local rebounds, underscoring the need for a comprehensive approach to analysis.
Formation of the 2022 Market Bottom
November 2022 marked an important turning point. At $15,500, technical analysts recorded bullish RSI divergences. This subsequently proved to be a precursor to a major uptrend.
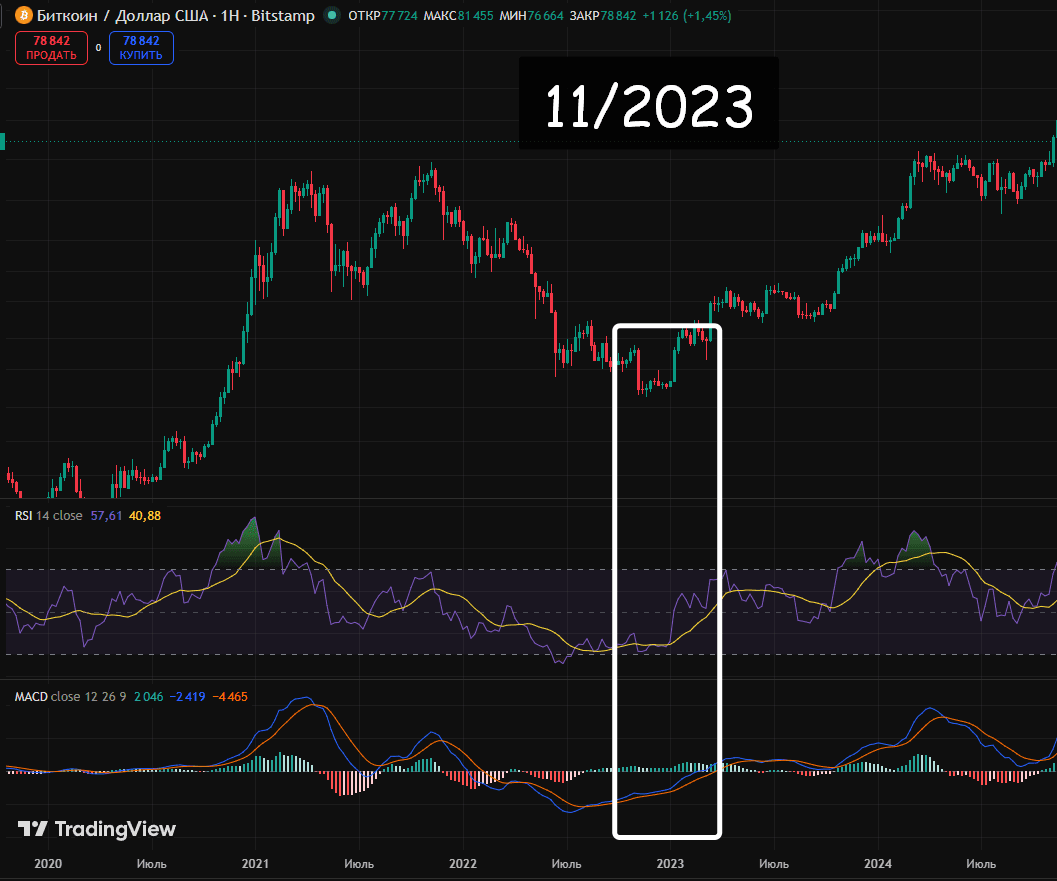
By October 2025, Bitcoin had reached a new all-time high of $126,198, demonstrating growth of more than eight times from the bottom.
Key Takeaways
Analysis of the cases presented leads to the following conclusions:
Divergence is an effective early-warning tool for changes in market momentum
On higher timeframes, divergence signals may appear well before a major movement begins
Divergence is more effective when used as part of comprehensive analysis rather than as an isolated tool
The practical value of divergence lies in its ability to signal a change in the nature of market movement, which is especially valuable with a long-term investment approach.
A Divergence-Based Trading System: A Practical Guide
Basic Trading Strategy
Long-Position Entry System
Precondition: the presence of a downtrend.
Signal configuration:
Formation of a new price low
No confirmation of the low by RSI/MACD
Presence of a significant support level
Formation of a reversal price pattern
Execution: opening a long position with a predetermined risk level
Short-Position Entry System
Precondition: the presence of an uptrend
Signal configuration:
Formation of a new price high
No confirmation of the high by the indicator
Presence of a resistance level
Break of the local upward structure
Execution: considering the possibility of opening a short position
Common Mistakes When Working With Divergence
One of the most common mistakes is interpreting signals mechanically. Many traders mistakenly regard a simple decline in RSI as a direct signal to act, forgetting the need to compare price and indicator extrema correctly.
The next problem is excessive optimism when buying. Traders often ignore the possibility of a further price decline and the formation of additional lows after bullish divergence appears.
Neglecting the trend context is a serious oversight. Some market participants fail to pay sufficient attention to the direction of the prevailing trend and display excessive confidence when trading against a strong movement.
Choosing an unsuitable timeframe also leads to mistakes. Using excessively short time intervals increases the risk of false signals and can substantially reduce the trading system's effectiveness.
Many traders ignore support and resistance levels, preferring to trade in the middle of a range. This approach significantly reduces the probability of a successful trade outcome.
Another common mistake is treating divergence as the only necessary condition for entering a position without considering other confirming signals. A comprehensive analysis of the situation should be a mandatory stage in making a trading decision.
Inadequate risk management is a serious oversight. Traders often open positions that are too large, which can cause critical damage to the trading account if a trade fails.
Recommendations for Implementing the System

Successful application of the system requires mandatory testing of its rules on historical data, formalization of the trading rules, and strict adherence to the established parameters. It is important to remain prepared to adjust the system based on experience and market conditions.
Any system requires careful configuration and adaptation to specific market conditions. Successful application is possible only with a comprehensive approach to analysis and strict adherence to risk management.