
Bitcoin SOPR: What the Spent Output Profit Ratio Is and How to Use the Indicator

Bitcoin SOPR (Spent Output Profit Ratio) is an on-chain indicator that helps determine whether bitcoin coin movements are generating profits or, conversely, realizing losses.
SOPR was proposed by on-chain analyst Renato Shirakashi. His article “Introducing SOPR: spent outputs to predict bitcoin lows and tops” was published on April 25, 2019. In it, the author proposed using Bitcoin blockchain data to assess changes in holder behavior and realized profits or losses.
On June 24, 2019, Glassnode announced the launch of SOPR in Glassnode Studio. The company described the indicator as a tool for assessing realized profits and losses in the Bitcoin ecosystem. At launch, historical data was available from January 2013.
Thus, SOPR was originally created not as a conventional trading oscillator, but as a tool for on-chain analysis of market behavior.
The SOPR formula is simple:
SOPR=coin price at the time of spending (movement) / its price at the time of receipt (UTXO creation)
In other words, SOPR calculates profit or loss when a coin is moved on the blockchain, not when an exchange trade occurs.
This immediately raises a question: isn’t “moving coins” the same as “buying or selling”?
In the context of SOPR, “moving coins” is not necessarily buying and selling on an exchange. Let’s examine this in more detail.
Buying and selling (trading) a market transaction: a trader places an order, someone accepts it, and the price is formed in the exchange’s order book. SOPR does not see this because exchanges are off-chain platforms.
A movement (on-chain transaction) a transfer of coins between addresses on the blockchain. In Bitcoin, this involves spending so-called UTXOs (outputs): a coin that once arrived at an address is now “spent” in a new transaction. This is precisely the event recorded by SOPR.
In other words, when a holder sends BTC from one address to another—for example, from a cold wallet to an exchange to sell later, or between their own wallets—a record appears on the blockchain stating that “this output (UTXO) has been spent.” For SOPR, this constitutes a “movement.”
Let’s consider several coin-movement scenarios to better understand the logic behind SOPR.
Transfer to an exchange. A holder moves BTC to an exchange address to offer it for sale later. On the blockchain, this already constitutes “spending a coin,” and SOPR will account for the movement. However, no actual market sale has taken place yet.
Transfer between one’s own wallets. Technically, the coin has been “spent” on the blockchain and SOPR sees it. Economically, this is not a transaction but simply a movement of funds.
Payment for goods or services in BTC. The coin moves as payment and this is an on-chain expenditure recorded by SOPR. It is not an exchange purchase or sale either.

The indicator has three basic states:
SOPR > 1 — on average, moved coins are realized at a profit.
SOPR = 1 — coins are moved at approximately their acquisition price, without a significant profit or loss.
SOPR < 1 — on average, moved coins are realized at a loss.
Suppose a coin was acquired at a price of $40,000 and transferred to a cold wallet, then moved to the holder’s exchange wallet some time later at a price of $60,000. The movement price ratio is:
SOPR = 60,000 / 40,000 = 1.5.
This means that the coin was realized at a profit of about $50%.
If it was acquired for $60,000 and moved at a price of $48,000, the indicator would be 0.8—the coin was realized at a loss of about 20%.
It is important to note that SOPR values absolutely cannot be interpreted literally. For example, an SOPR of $1.05 does not mean that every holder earned a $5% profit. It is an aggregate indicator for all moved coins, meaning that overall Bitcoin movements during the period under review produced a $5% profit.
Analysts therefore consider not only whether the indicator is above or below 1, but also its dynamics: how long SOPR remains above or below this level, whether it returns to 1 after a correction, and whether market participants’ behavior is changing.
How to Analyze SOPR Readings
The main advantage of SOPR is that it reveals what is happening to coins when they move.
For example, Bitcoin may continue to rise while more and more holders begin moving coins at a profit. An increase in SOPR under this scenario indicates active profit-taking.
The opposite occurs during a market decline. If SOPR falls below 1, it means that moved coins are, on average, being realized below their acquisition cost. If the indicator remains below 1 for an extended period, it may point to substantial loss realization.
SOPR is especially useful when analyzing corrections. Historically, Glassnode has viewed a return to 1 followed by a recovery above it as one way to assess changes in market behavior. However, this is analytical context, not a guaranteed signal of a price change.
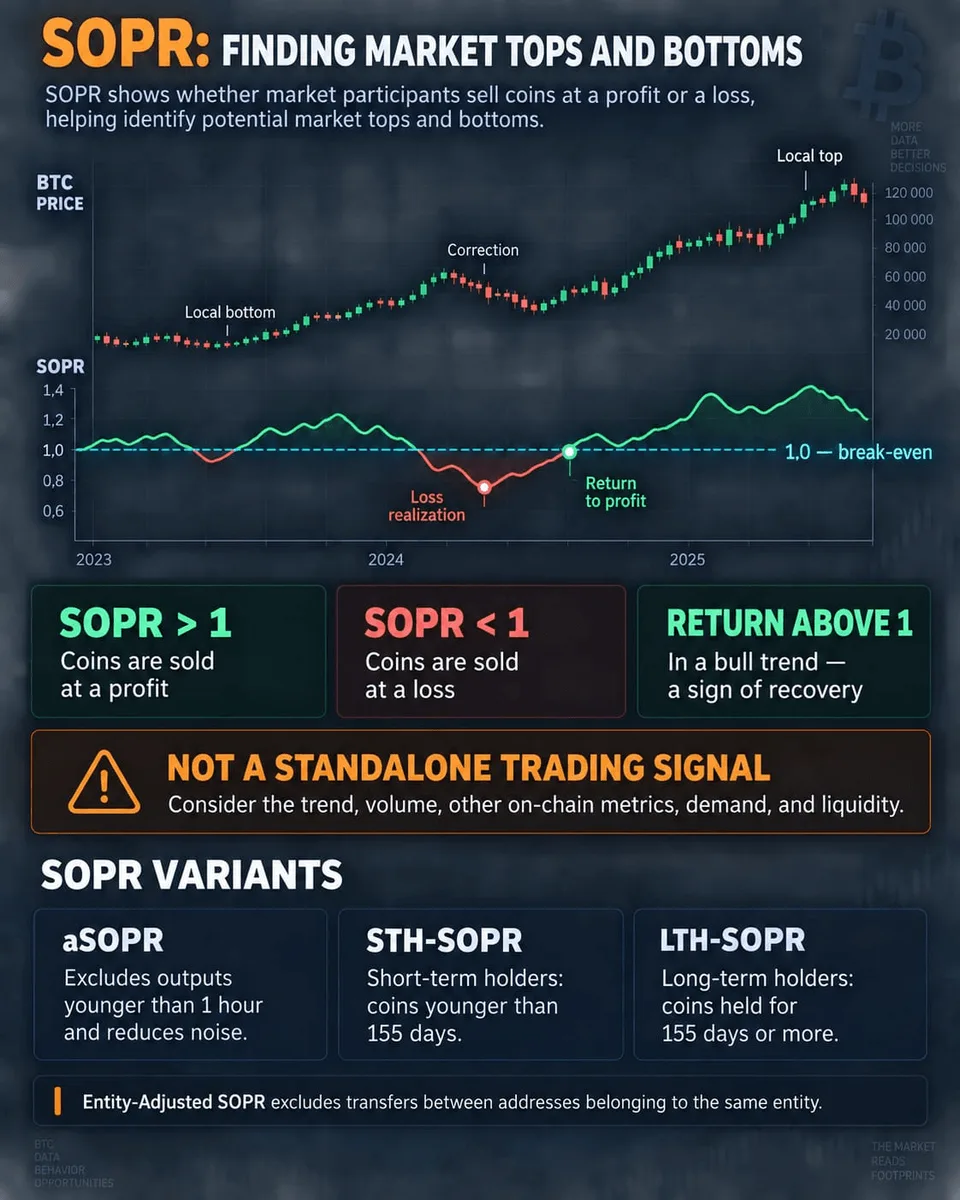
Using SOPR to Identify Tops and Bottoms
The 1 level is central to interpreting the indicator.
Imagine that Bitcoin is in an uptrend. During a correction, SOPR falls below 1, showing that some coins are being realized at a loss. If the indicator then moves back above 1, it may mean that the average realized value has once again risen above the acquisition cost.
This scenario interests analysts because it allows them to observe not only the BTC price but also the behavior of coin holders.
At the same time, a move below 1 does not necessarily signal the start of a major decline, while a return above 1 does not guarantee continued growth. The same signal must be considered in the context of the trend, volumes, other on-chain metrics, and market conditions.
Thus, SOPR is best regarded as an indicator of market context. It helps explain how the behavior of investors who have already transacted in cryptocurrencies is changing. However, subsequent price movements also depend on new demand, liquidity, and external factors.
aSOPR: Adjusted SOPR
One of the most popular variants is aSOPR (Adjusted SOPR).
It differs from regular SOPR by excluding outputs that existed for less than one hour. Glassnode uses this adjustment to filter out very short-lived movements that may add noise to the indicator.
This is why aSOPR is often used when analyzing Bitcoin. It makes it possible to focus on more meaningful coin movements and reduce the impact of short-term technical operations.
Entity-Adjusted SOPR also exists. This variant additionally excludes transactions between addresses belonging to the same entity, helping distinguish internal movements from genuine economic activity.
STH-SOPR and LTH-SOPR
Regular SOPR presents an aggregate picture. However, different groups of market participants may behave in completely different ways. Glassnode therefore divides SOPR into indicators for short-term and long-term holders.
STH-SOPR (Short-Term Holder SOPR) accounts for coins that remained in a UTXO for less than 155 days.
LTH-SOPR (Long-Term Holder SOPR) accounts for coins held for at least 155 days.
This separation makes it possible to ask a more specific question: who is currently realizing a profit or loss—participants who bought coins relatively recently, or long-term holders?
STH-SOPR is generally used to study shorter-term market behavior. LTH-SOPR changes more slowly and may be used to analyze long-term market cycles.
The TLAP SOPR Indicator
The TLAP team developed an SOPR on-chain indicator that brings together all implementation variants: SOPR, aSOPR, STH-SOPR, and LTH-SOPR.
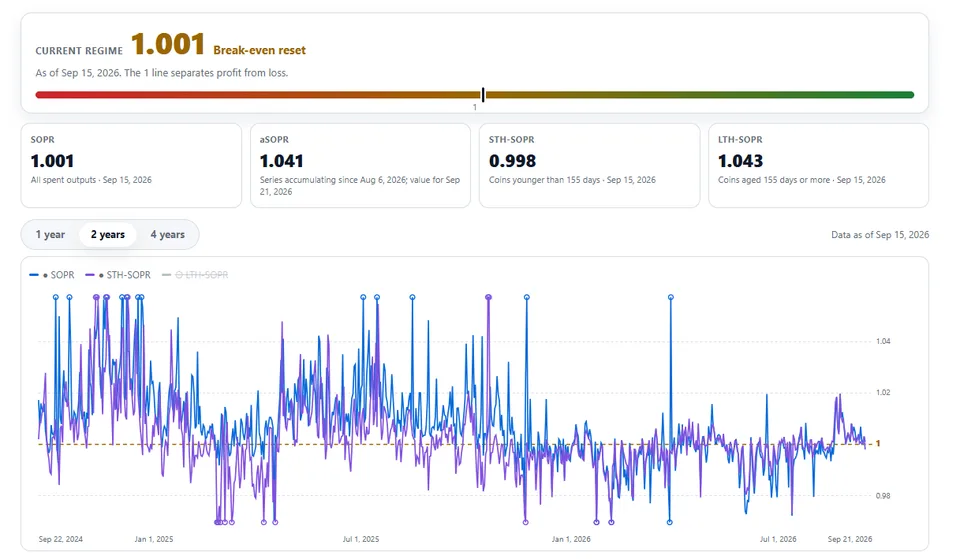
In addition to calculating all the indicators, the SOPR tool developed by TLAP makes it possible to assess dynamics over one, two, and four years.
How to Use SOPR in Trading
SOPR is best treated as an additional filter rather than a standalone trading system.
One application is market regime analysis. If the indicator remains above 1 for an extended period, profitable realization predominates among moved coins. A prolonged period below 1 indicates that realization at a loss predominates.
Another application is correction analysis. For example, in a rising market, a trader can watch for aSOPR to decline toward 1 and then return above that level. Glassnode has used similar SOPR changes when analyzing Bitcoin’s recovery after corrections.
Another approach is to combine SOPR with other on-chain metrics. For example, SOPR shows the realized profit or loss on moved coins, while MVRV describes the ratio between market value and realized value. Together, these indicators provide a more complete picture of market participants’ behavior.
Can SOPR Predict the Bitcoin Price?
SOPR is often described as an indicator for identifying market tops and bottoms — partly because of Renato Shirakashi’s original research. However, the indicator itself does not predict the price directly.
A high SOPR may indicate active profit-taking, but new buyers may be entering the market at the same time. A low SOPR indicates loss realization, but does not by itself show whether the decline will end.
It is therefore more accurate to regard SOPR as an indicator of Bitcoin holder behavior. It shows the outcome at which coins are moved, but contains no information about future demand and is not a guaranteed buy or sell signal.
Disclaimer

This material is provided solely for educational purposes and does not constitute investment advice.
SOPR and its variants do not guarantee changes in the Bitcoin price and should not be used as the sole basis for trading decisions. Historical relationships between on-chain metrics and price may not recur in the future.
Cryptocurrency trading involves a high risk of capital loss.