
Bitcoin Below $70,000: Has the Long Liquidation Wave Ended?

Intro
Bitcoin has fallen below $70,000, but the useful question is whether forced selling has exhausted itself. A large liquidation total can mark the removal of excess leverage, or merely one stage of a continuing decline. The available evidence supports a role for leveraged longs in amplifying this move; it does not yet establish that the pressure has ended.
What the reported figures establish
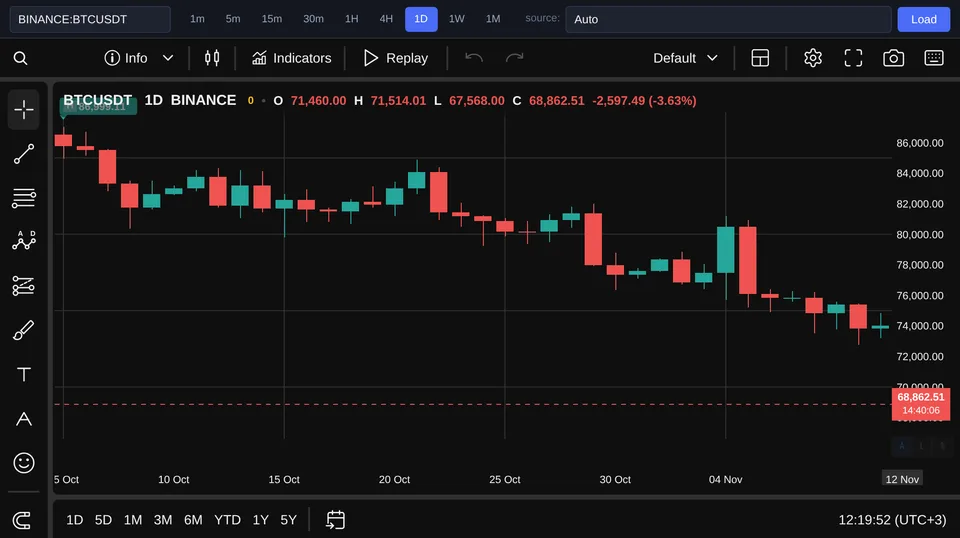
At the time of writing, Binance BTCUSDT stood at 68,717 USDT, down 3.84% for the day. Reuters' morning report on November 13 put bitcoin near $68,600, a separate observation rather than an identical timestamp. Binance ETHUSDT was 1,932 USDT, down 4.33% for the day, showing that both assets were falling. Bitcoin.com reported $1.62 billion in daily liquidations, with almost 90% attributed to longs. This is a reported aggregate, and the full amount should not be assigned to bitcoin alone. The figure measures forced position closures, not a separately established volume of institutional selling. These observations establish the scale and direction of the reported liquidation wave, not its completion. A daily total combines events over a window; it cannot show whether forced selling is accelerating or fading at the latest price. The two bitcoin price snapshots likewise do not establish a sustained recovery.
Why forced selling can feed on itself
A leveraged long depends on collateral meeting the venue's margin requirements. When bitcoin falls, losses reduce that buffer, and the venue may force positions closed if the required margin is no longer available. Closing long exposure can add selling pressure and push other positions toward their liquidation thresholds. This creates a feedback loop: the initial decline triggers closures, which can deepen the decline. Yet the process can weaken as vulnerable positions disappear and fresh demand absorbs sales. A large liquidation total proves that positions were closed; it does not measure how much vulnerable leverage remains. Liquidated position value is not the same as traders' realized cash losses. It also does not reveal the collateral buffers behind positions that remain open. Removing vulnerable longs can reduce forced selling, but it does not automatically create fresh spot demand. The liquidation bill comes without an all-clear receipt. A bounce may reflect fewer forced sellers, but it may also come from short covering or temporarily lighter selling. Neither a rebound nor the loss of $70,000 identifies the size of the remaining margin pressure on its own.
Three explanations and the working hypothesis
The first explanation is a predominantly technical flush of crowded longs. Its attraction is direct: the reported concentration of liquidations on the long side supplies evidence for forced selling as an amplifier. If that selling fades and buyers remain, the decline can lose momentum without a new positive catalyst. The second explanation is persistent spot selling, potentially including institutional investors. That would help explain continued weakness after liquidation activity subsides, but the reported figures do not establish institutional selling. Identifying the seller requires separate evidence, including verified fund flows, rather than an assumption based on the size of the price move. The third explanation is a broader retreat from risk, with leverage magnifying the initial impulse. Ether's parallel decline is consistent with that possibility, but two falling assets do not establish a macroeconomic cause. These explanations can overlap: spot selling or risk aversion can start a move that liquidations then intensify. The strongest working hypothesis is that forced long closures amplified the fall, while the end of the flush remains unproven. It has direct support in the liquidation report and makes fewer assumptions about who initiated the selling. It explains part of the mechanism without claiming to identify the original trigger.
What would confirm that the pressure is fading
Testing that hypothesis requires synchronized data on open interest, funding rates, liquidations, spot trading and net flows into spot bitcoin ETFs. Open interest is the stock of outstanding derivatives contracts; a fall in its dollar value can partly reflect a lower bitcoin price. Compare contract counts or price-adjusted exposure before calling it a reduction in leverage. Even a genuine fall in outstanding contracts cannot reveal each remaining position's leverage or collateral buffer. A decline in open interest during the liquidation burst, followed by quieter forced closures and renewed spot demand, would support a completed technical flush. A retreat from strongly positive funding, if observed, would add support. Fading liquidations must be assessed alongside evidence of buying demand. A shift toward short positions can also alter funding, so a cooler rate alone cannot establish that buyers are returning. Continued price weakness after liquidations subside, accompanied by sustained spot selling and verified ETF outflows, would weaken a flush-only explanation. ETF flows describe one institutional channel, not every institutional trade. Renewed growth in leveraged exposure without stronger spot demand would leave room for another cascade. Match the timing carefully: a daily fund flow report cannot by itself identify the cause of an intraday price move. A return above $70,000 would be more convincing if spot demand strengthened while leverage stayed restrained. The level is a reference point, not a mechanical safety line. A brief crossing by itself would settle neither the liquidation question nor the identity of the sellers.
Conclusion
Bitcoin's fall below $70,000 has exposed substantial long liquidation, but the evidence does not yet show that the flush is complete. Forced selling is the best-supported amplifier of the decline. A durable recovery needs evidence of stronger spot demand as forced sales fade; continued weakness afterward would strengthen the case for persistent selling.