
Bitcoin Near $67,000: Is the Liquidation Wave Losing Force?

Intro
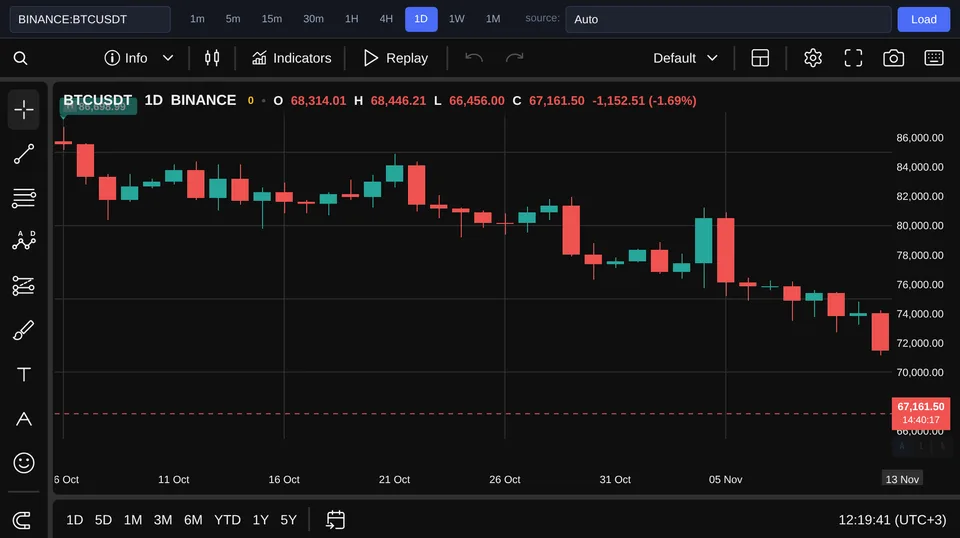
Can Bitcoin regain the $67,000 area simply because forced selling slows? The latest snapshot puts Bitcoin (BINANCE:BTCUSDT) at 66,996 USDT, down 1.93% on the day, and ether (BINANCE:ETHUSDT) at 1,895 USDT, down 1.81%. The useful question for the weekend is whether reduced leverage will be enough to steady Bitcoin, or whether sellers in the spot market will keep control.
What the reported figures establish
FXStreet's review of November 13, 2026, published at 10:27 UTC, put daily crypto liquidations at $1.64 billion, with about 89% involving long positions. It described Bitcoin trading around $67,000-$68,000 and ether falling below $2,000. These are reported figures from that review; the latest quotes above are a separate, later snapshot. The distinction matters because Bitcoin is already marginally below $67,000 in the latest quote. A single price observation cannot establish that the wider area has failed as support. That requires evidence about how the market trades around it: whether buyers absorb selling, whether rebounds last and whether renewed declines find demand. The liquidation split establishes something narrower: the reported forced closures were heavily concentrated in positions betting on rising prices. It supports forced long selling as an accelerator, while leaving both the original trigger and the remaining supply of willing sellers unresolved. The reported total covers positions liquidated across crypto markets; it cannot be read as the same amount of cash leaving Bitcoin. Because it aggregates a full day, it also says little about whether forced selling is still accelerating at the latest quote.
How leverage can accelerate the decline
When a leveraged long can no longer meet an exchange's margin requirements, the exchange may close it. That closure can add sell orders, push the price lower and bring other longs closer to liquidation. The immediate trades may occur in derivatives, with arbitrage and hedging carrying pressure into the wider market. Leverage rarely improves the manners of a crowded exit. Our editorial working hypothesis is that a cascade best explains the speed of the decline: the high share of long liquidations fits the mechanism directly. The evidence concerns how selling accelerated. It does not tell us who placed the first sell order or whether the underlying reasons to reduce exposure have disappeared. If forced closures ease, one source of urgent supply becomes smaller, potentially allowing ordinary buying to have more influence. But investors selling unleveraged holdings can continue to press bids after the most fragile positions are gone. A large liquidation total alone cannot identify a market bottom; it records positions already closed, rather than measuring how much selling remains.
What could keep sellers in control
The first alternative is persistent spot selling: holders may keep reducing exposure even after derivatives positions have been cut. Its distinguishing feature would be continued aggressive selling in spot markets while liquidation activity subsides. The relevant observation is sellers repeatedly crossing the spread to hit bids, together with the price response to those trades. Under that explanation, removing leverage helps market mechanics but does little to rebuild demand. A broader retreat from risk is another possibility. FXStreet's author linked the selloff to expectations of a Federal Reserve rate increase, ETF outflows and weakness spilling over from technology stocks. Those are proposed explanations, with causality still unproven; testing them requires evidence from fund flows, rate pricing and equity markets. These possibilities overlap, so the task is to establish their order and persistence. ETF flow reports need to match the relevant trading sessions, changes in rate expectations need to precede or accompany the move, and technology stocks need a comparable timeline. Reading dated fund reports as a live weekend signal would blur that sequence. A shared decline alone cannot establish which market led the move.
The observations that would change the assessment
A stabilization scenario gains support if liquidation intensity falls, open interest contracts and Bitcoin then recovers the $67,000 area with stronger spot demand. Open interest measures outstanding derivatives positions, so a decline can indicate less exposure, although it does not by itself reveal which side is in control. Here, stronger demand means buyers absorbing sell orders without another sustained decline, rather than a rise in derivatives activity alone. Price recovery and spot participation must accompany the reduction in leverage. Watch what happens after the first rebound: repeated trading above the area and buyers absorbing later pullbacks would strengthen the case for stabilization. A brief move above $67,000 without lasting demand would offer weaker evidence. Current open interest and spot flow figures are needed to establish whether that sequence is actually happening. The case for stabilization weakens if liquidation activity eases while Bitcoin continues to trade below the area, rebounds fade and aggressive spot selling persists. That pattern would suggest that voluntary supply is enough to sustain the decline, even if leverage amplified the initial fall. Continued weakness after forced selling slows shifts attention toward spot sellers, while verified fund flows and changes in rate expectations could clarify their motivation.
Conclusion
Slower liquidations can ease pressure, but holding the $67,000 area requires returning spot demand. Forced long closures are the strongest working explanation for the acceleration of the selloff, while the original trigger remains unresolved. The latest quote alone cannot establish a recovery; subsequent trading must show that buyers can absorb voluntary selling.