
Automatic Fibonacci Levels
 Tired of drawing Fibonacci retracement levels manually? Then this indicator is for you.
You can read about Fibonacci numbers, what role they play, etc. here.
In short: traders prefer to place stops/takes at Fibonacci levels, calculate trend potential, resistance levels, and the like. Roughly speaking, it is at Fibonacci retracement levels that this very retracement most often occurs.
What does the indicator do? It automatically builds retracement levels (Fibonacci Retracement) based on local price lows/highs on the chart. When zooming in/out, as well as when changing the timeframe, the levels are rebuilt automatically. So that you can choose their optimal placement on the chart. At the beginning of each candle, the indicator checks whether a new low/high has appeared on the chart, and will automatically rebuild the level grid if it does.
The indicator is installed as usual (see How to install an indicator), without any tricks. After attaching it to the chart, we get a similar picture:
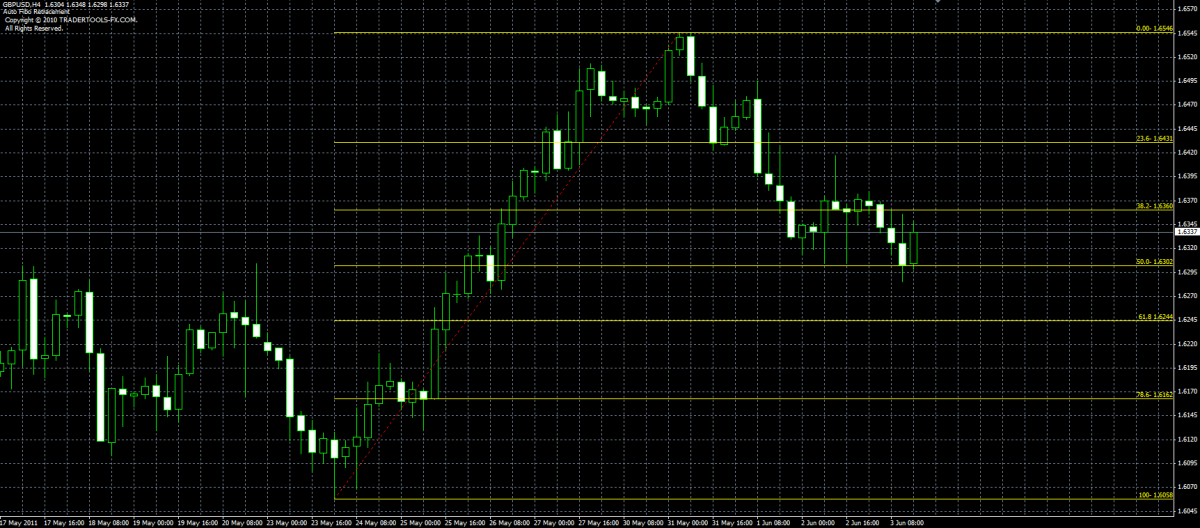 Well then, now there is no need to draw levels manually, and you can spend the time saved on the analysis itself :)
Download the AUTO FIBO RETRACEMENT Indicator

Best regards, Pavel Vlasov TradeLikeaPro.ru