
Autochartist - the heavy artillery of chart analysis

Hello, trader friends!
Analytics has always taken a lot of effort and time, especially in trading. Despite all attempts to optimize processes, human resources have always been a limitation. The arrival of full computerization brought a real revolution to forex analytics, and at present automatic analytical tools have not displaced the outdated manual approach, but complement it organically.
Today in this review we will talk about the set of indicators Autochartist, a multifaceted analytical tool whose broad capabilities are available to every forex trader. We will also discuss ways of using the indicator on the web platform and in the Metatrader 4 terminal, as well as the good and bad sides of this product.
Capabilities of Autochartist

Autochartist is the most advanced tool for scanning the market and identifying trading inefficiencies (opportunities to gain an edge). The tool is a standalone software product and is provided by a number of brokers, for example Alpari, Roboforex, Forex4you.
The program includes:
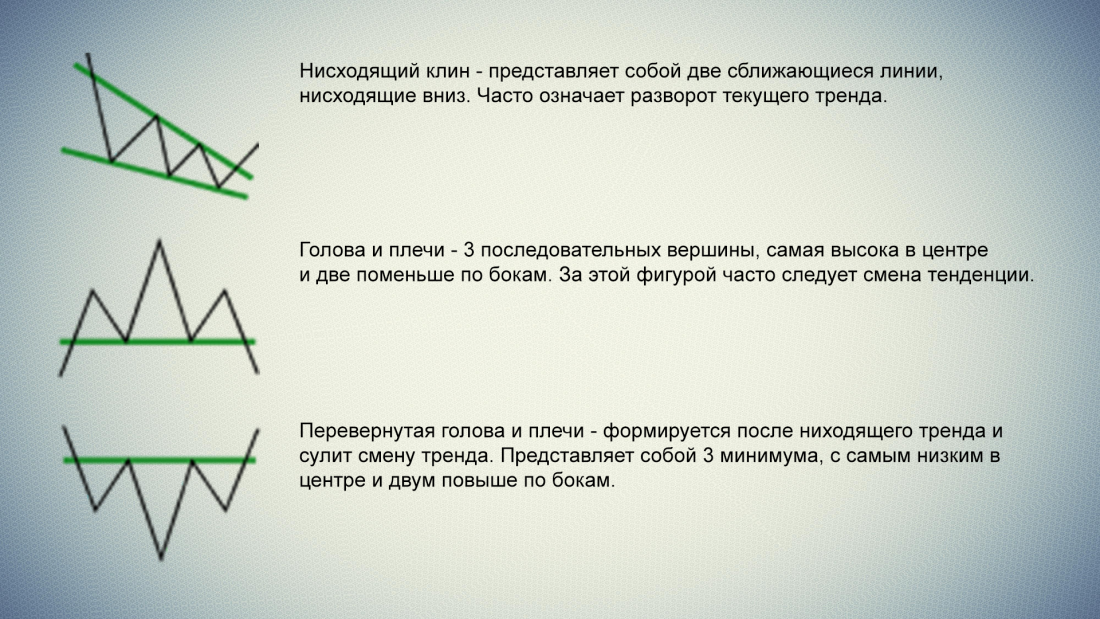
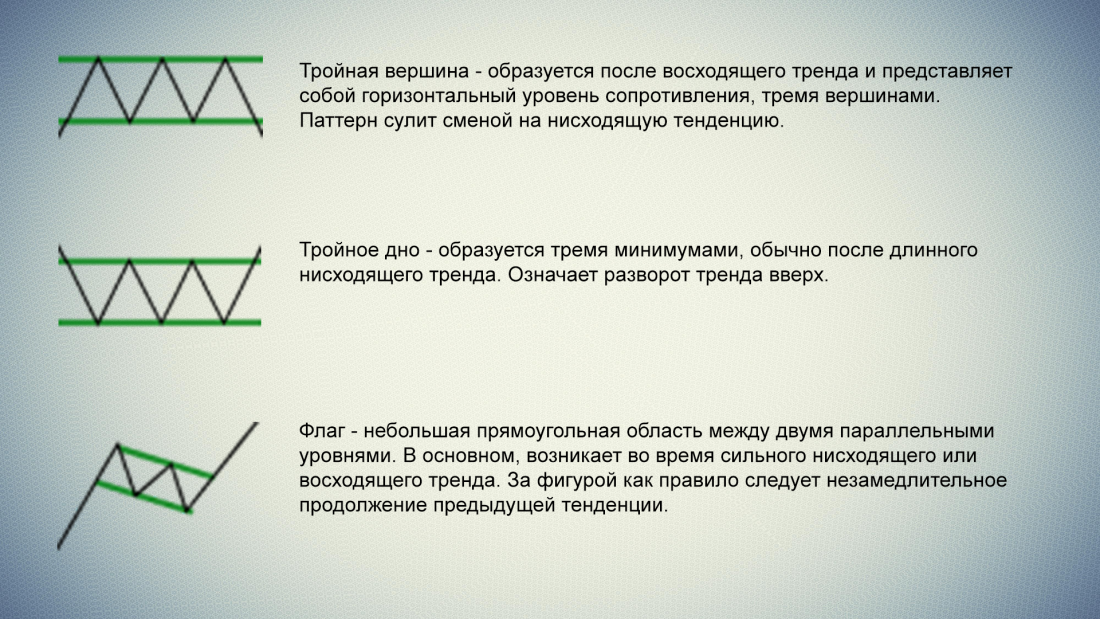
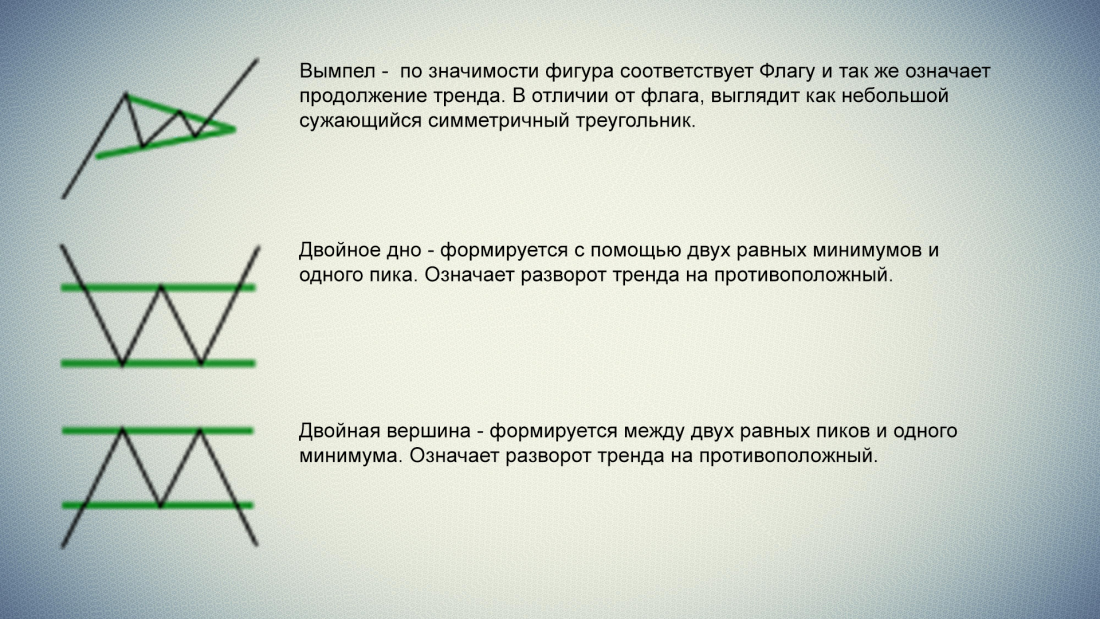
- Identification of chart patterns - triangles, channels, the "Head and Shoulders" pattern, as well as ascending and descending wedges;
- Fibonacci levels - Gartley and Butterfly patterns, ABCD, retracements, extensions;
- Identification of support and resistance levels;
- Volatility analysis - the program provides an assessment of current risks and market volatility;
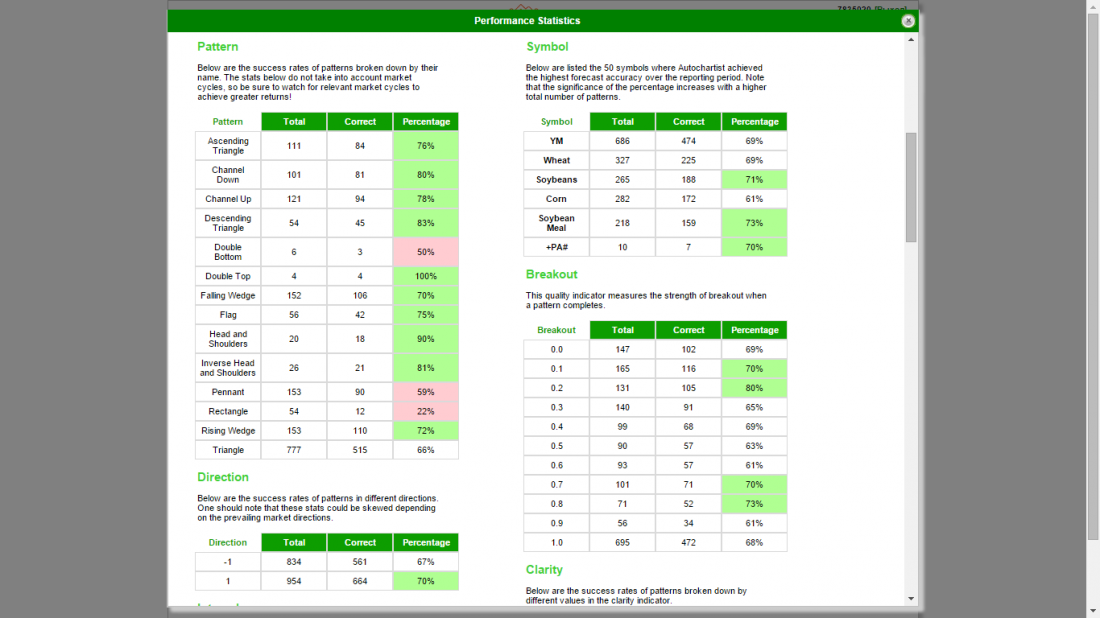
- Performance statistics - shows which patterns over the last 6 months were most successful in reaching the predicted levels;
- Email notifications - provides a technical market overview for the next 24-48 hours.
The program is in a state of constant market scanning, as a result of which it manages to automatically identify chart patterns, Fibonacci patterns, as well as support and resistance levels while they are still in their early stages. Of course, the obvious advantage of identifying patterns before they are fully formed is that it allows you, at a minimum, to set a limit for your current trading, or to enter a position as early as possible on the corresponding signal.
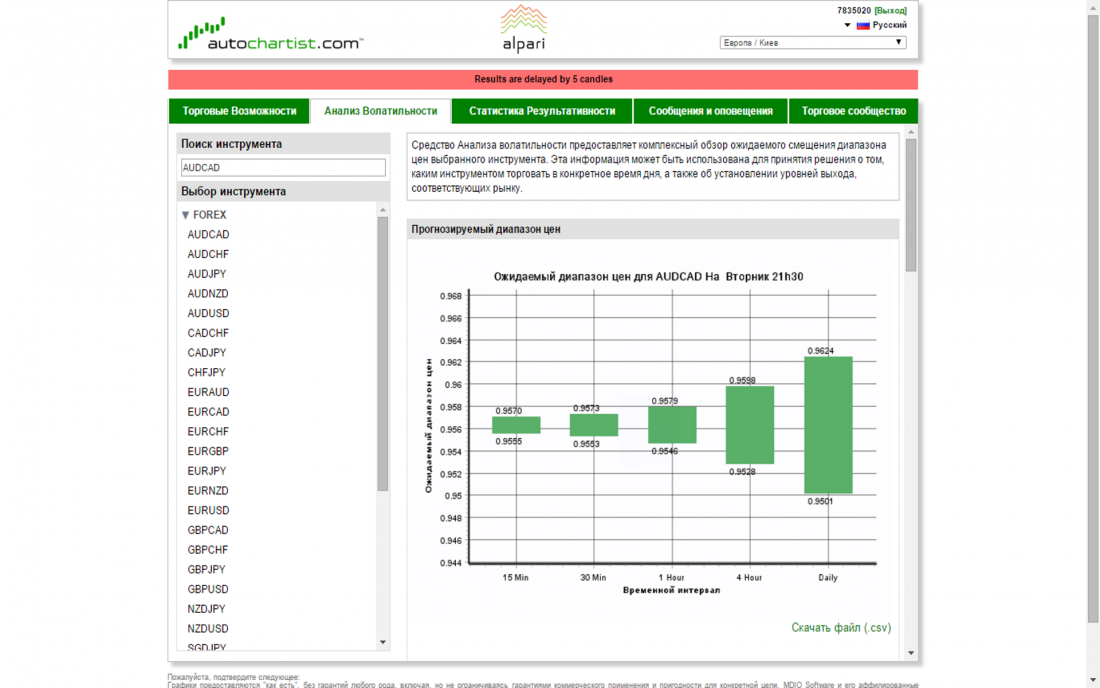
Volatility analysis, in turn, offers statistical information on the volatility of prices of traded instruments, providing a forecast for 15 minutes, 30 minutes, 1 hour, 4 hours, and 24 hours. Besides the fact that by knowing volatility indicators you can decide which instrument is better to trade at the moment, based on this information you can also adjust stop-loss and take-profit levels, which should preferably be set beyond the specified price range.
Installation recommendations
After you have downloaded and launched the program setup file, Autochartist will prompt you to choose the installation language. If you chose Russian, the following window will appear:
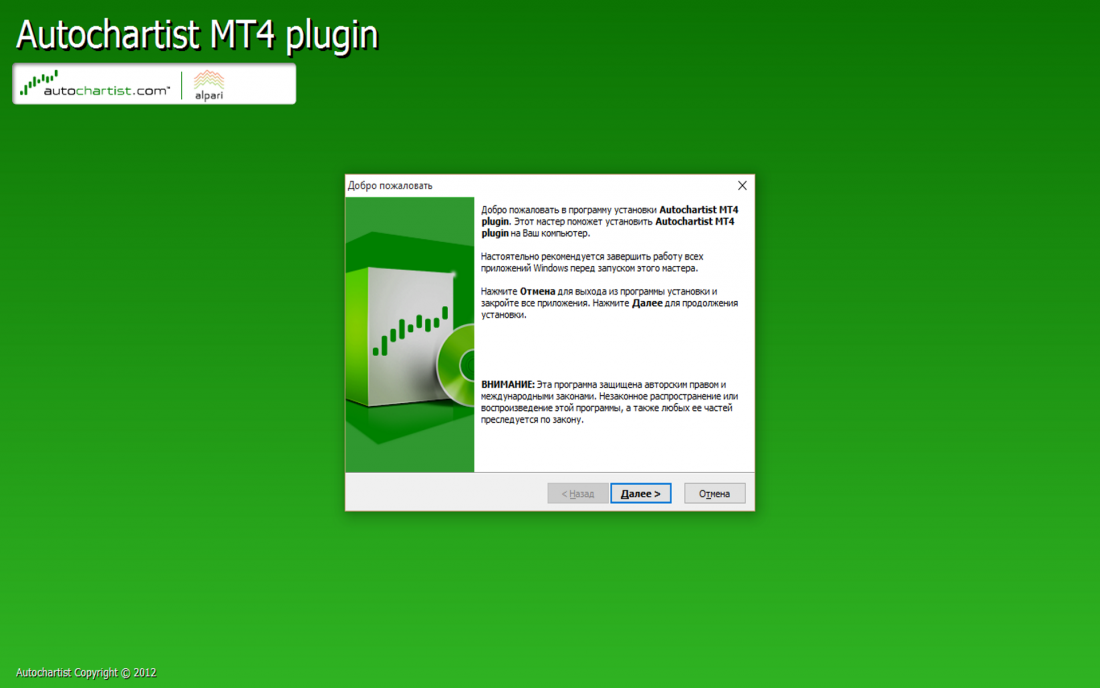
This stage is quite simple; you only need to confirm the terms of use agreement and click "Next." The installer will also suggest choosing an installation directory, so if you have several versions of the terminal installed on your computer, it is worth choosing the one that belongs to the broker that provided this program.
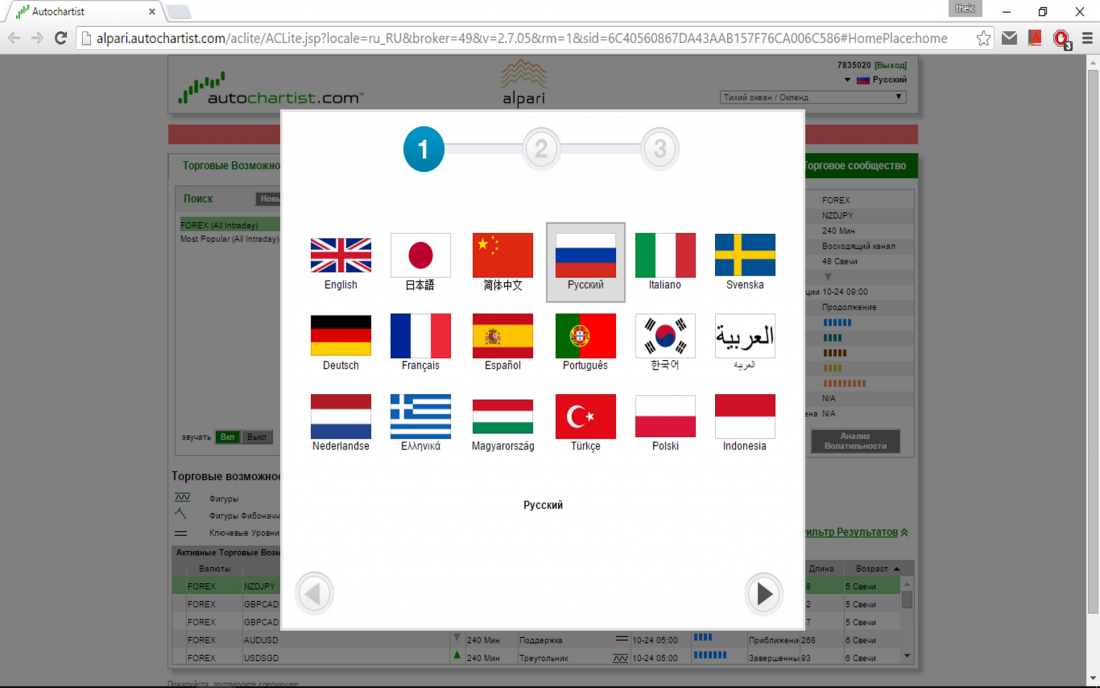
After that, all the necessary files and indicators are already in the trading terminal folder. If you launch the Autochartist Web Application indicator, on first launch you will be prompted to configure some platform parameters, such as language, time zone, and notification settings.
Use in the terminal and brief description of the tools

To apply the indicator, hold down the left mouse button over the icon with the name, then drag the indicator onto the current chart window and release it. Since the indicators request data from the Autochartist website, when the settings window appears do not forget to allow the use of DLL libraries.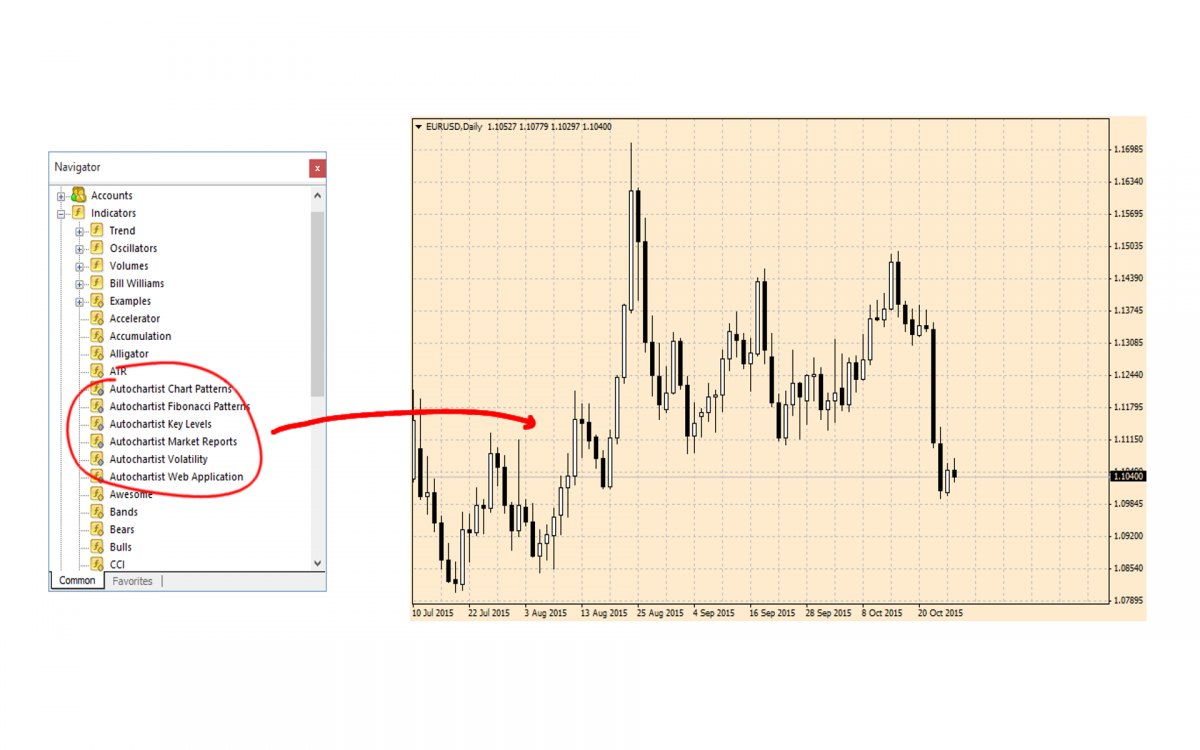 The system consists of six indicators:
- Autochartist Chat Patterns
Main parameters requiring configuration:
- Timezoneoffset - this parameter allows you to synchronize the server time with the broker's time zone. If you received the program from your broker, there is no need to change the default value;
- Pattern_Count - the number of displayed patterns in history;
- Filter_ShowCompleted - set the value to true to show only completed patterns;
- Filter_ShowEmerging - set the value to true to show emerging patterns, and false otherwise;
- Filter_ShowLegend - show the information panel;
- Filter_ShowTargetRegian - show the forecast area.
The indicator also provides broad possibilities for configuring the display of the information panel and trading levels, as well as setting filters, which are counterparts of the filters for the web platform that we will discuss later.
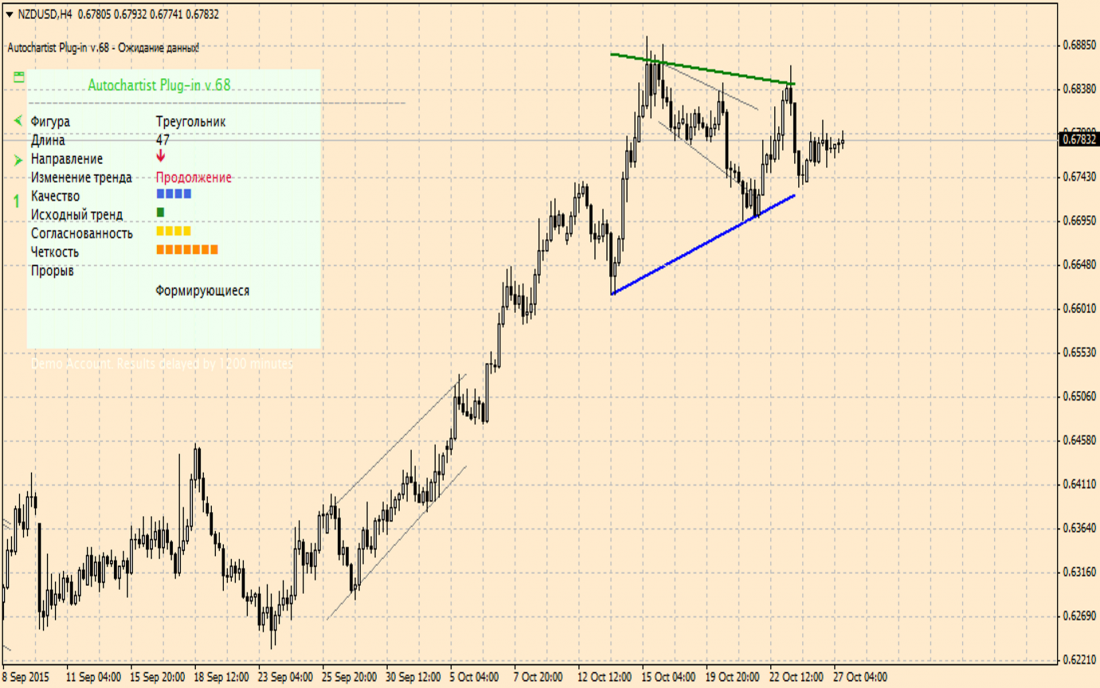
The chart pattern indicator draws several recent patterns on the chart and also provides their estimated analysis.
- Autochartist Fibonacci Patterns - the indicator calculates Fibonacci patterns. The main set of parameters requiring configuration:
- Timezoneoffset - server time offset (does not require adjustment if the program is supplied by the broker);
- Pattern_Count - number of patterns displayed in history;
- Filter_ShowCompleted - set to true to show completed patterns;
- Filter_ShowEmerging - set to true to show emerging patterns;
- Filter_ShowLegend - show the information panel;
- Filter_ShowTargetRegian - show the forecast area;
Also, the filter settings allow you to immediately filter out the most poorly formed patterns. We will discuss the filter settings capabilities in more detail in the section on creating a search query.
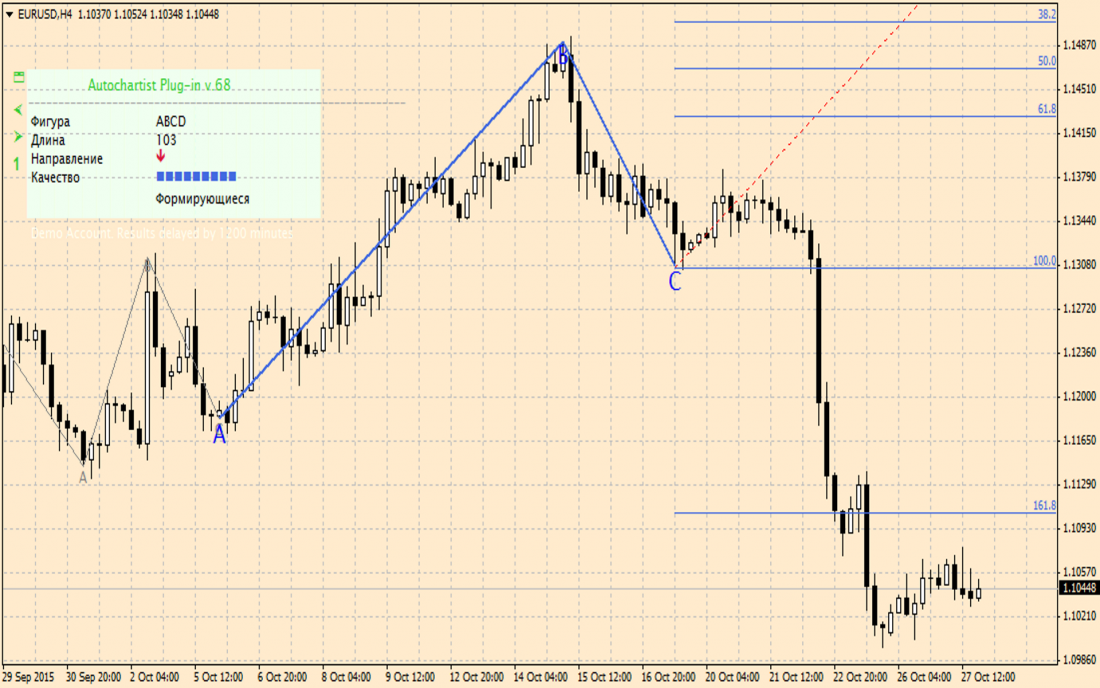
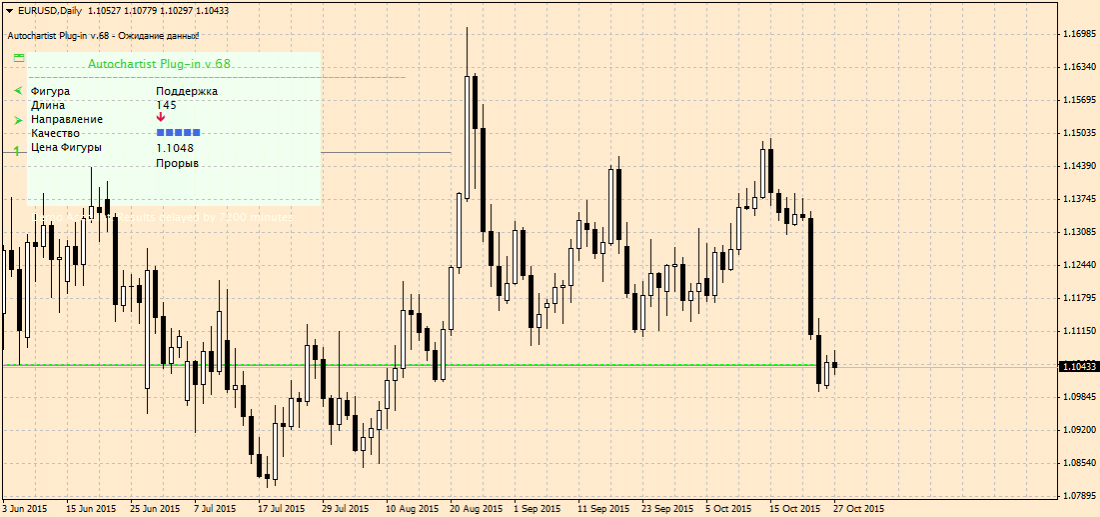
- Autochartist Key Levels - shows support levels and resistance levels, and also has the following parameters:
- Timezoneoffset - server time offset (does not require adjustment if the program is supplied by the broker);
- Pattern_Count - number of patterns displayed in history;
- Filter_ShowCompleted - set to true to show completed patterns;
- Filter_ShowEmerging - set to true to show emerging patterns;
- Filter_ShowLegend - show the information panel;
- Filter_ShowTargetRegian - show the forecast area;
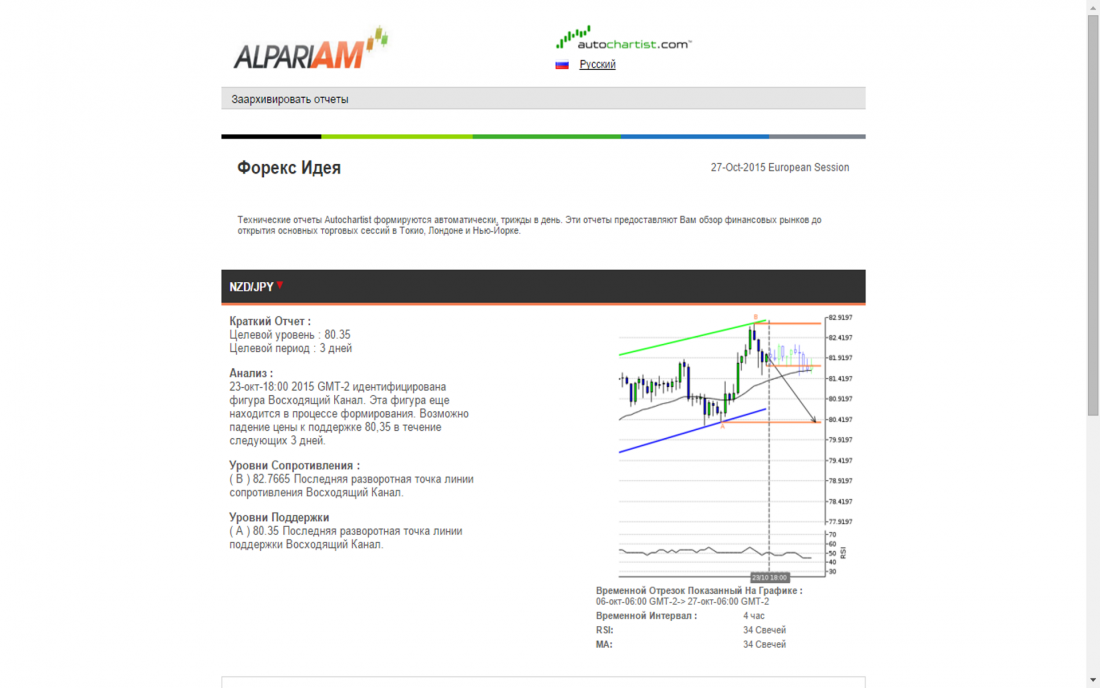
- Autochartist Market Reports - opens a window with market reports of this kind:
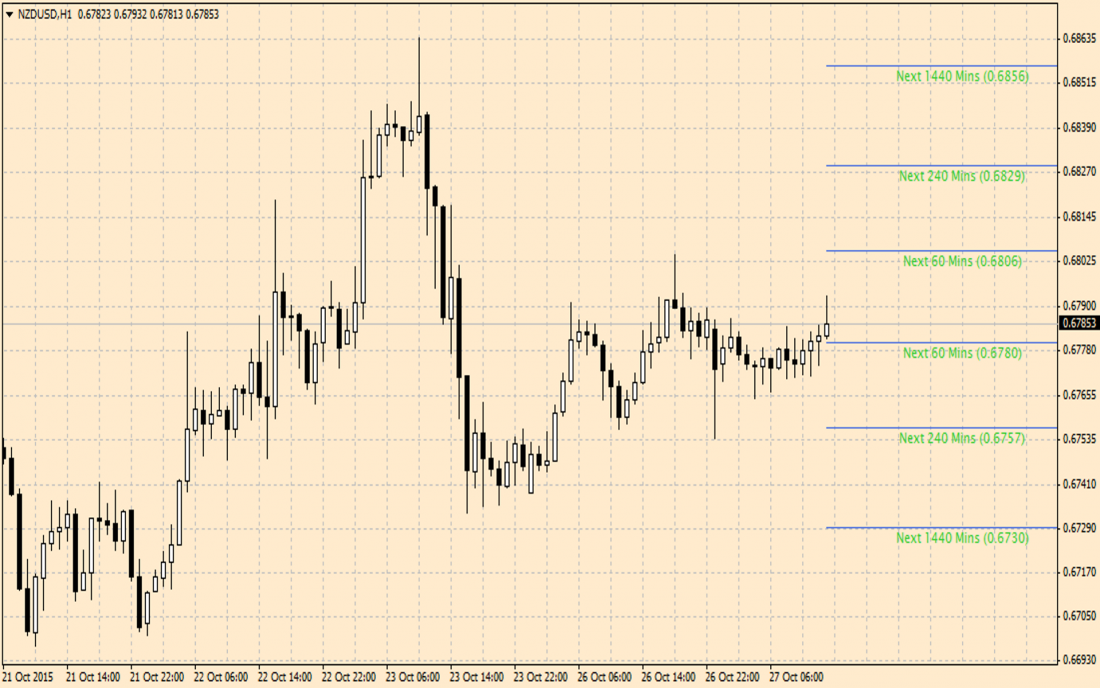
- Autochartist Volatility - the indicator clearly shows the forecast volatility levels within the specified periods. This means that in the picture shown, within an hour the price will presumably be confined to a channel from 0.6780 to 0.6806, and during the next four hours the lower boundary will be 0.6757 and the upper 0.6829.
- Autochartist Web Application - the indicator opens the web version of the platform in the default browser being used.
The information panels of the pattern indicator, Fibonacci figures, and key levels have 4 control buttons.
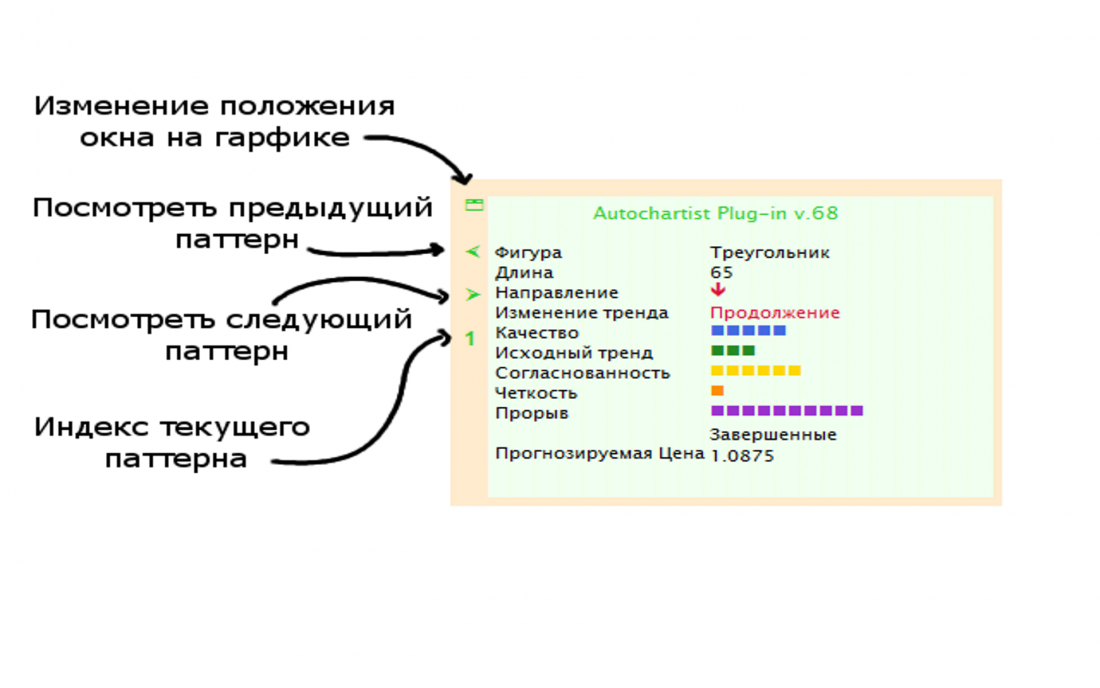
By dragging the first icon, you can change the position of the window on the chart. By lightly dragging the corresponding control arrows left or right, you can switch between the found patterns. The number of the current pattern is indicated by the fourth icon, and the count itself goes in a circle, so navigation is quite simple and it will be difficult to get lost.
Description of trading patterns
Let us consider some price patterns and ways of using them in trading.
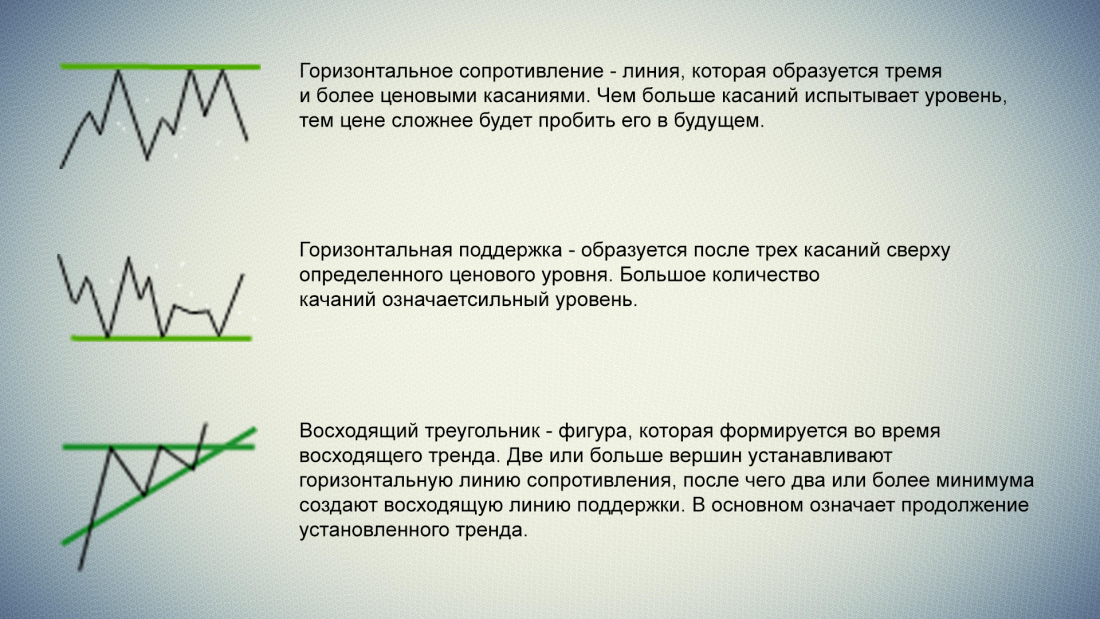
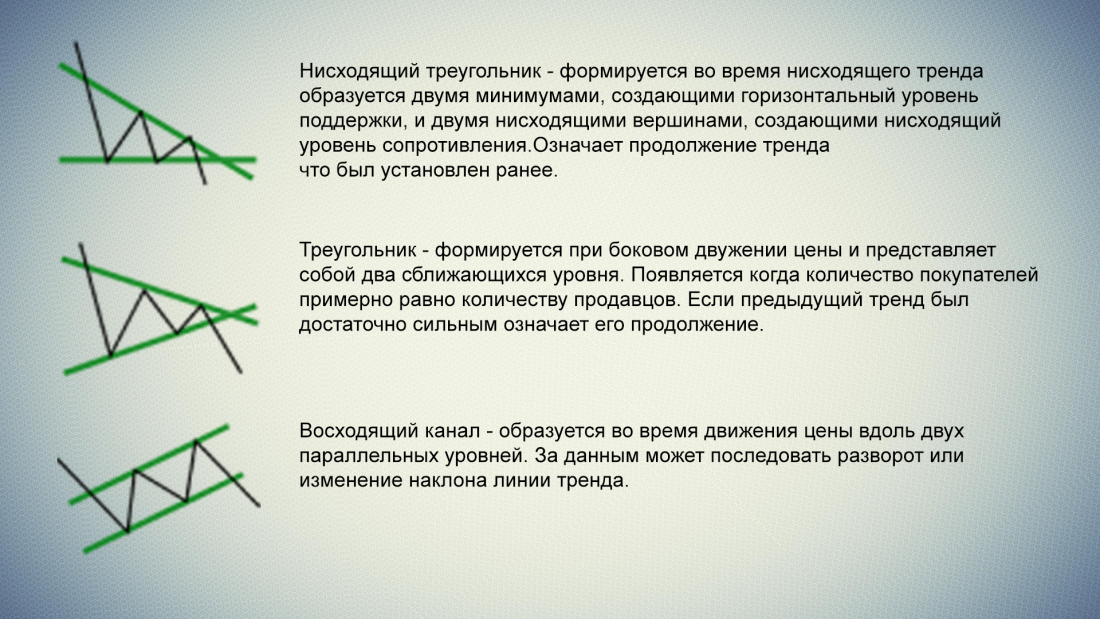
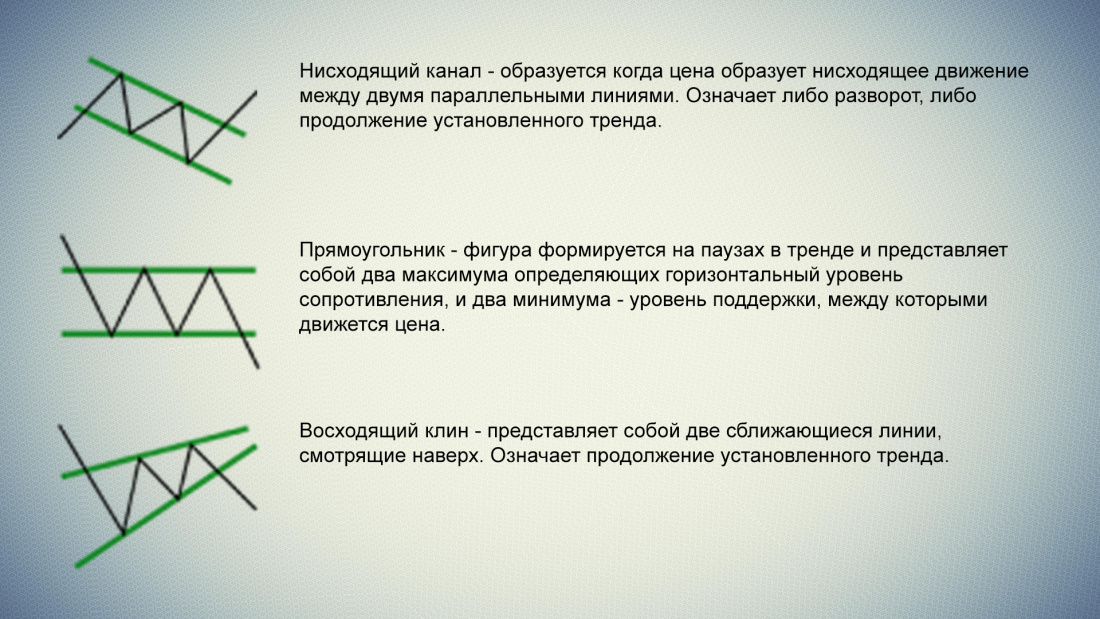
Autochartist Web Application Interface
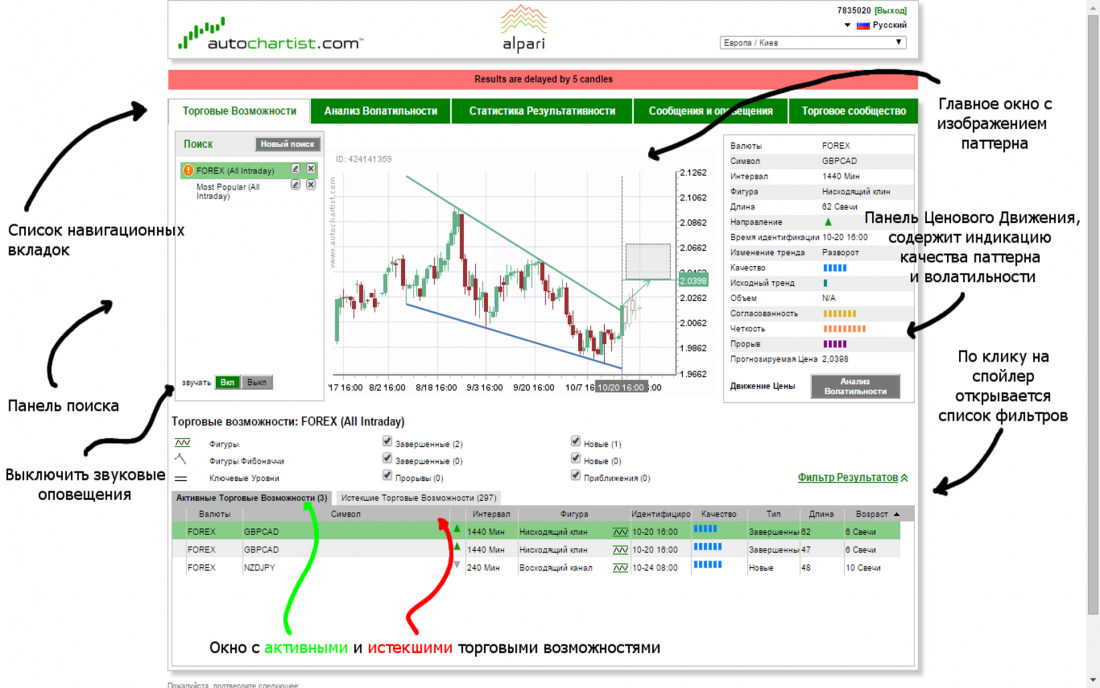
To get to the web application, place the Autochartist Web Application indicator on the chart. Or click the Log in button on the corresponding page of your broker's website.
The trading panel consists of 5 tabs:
- Trading Opportunities;
- Volatility Analysis;
- Performance Statistics;
- Messages and alerts;
- Trading community.
The main purpose of the trading opportunities tab is contained in its name, that is, to show the current forming patterns and provide a forecast based on this data.
By clicking on the patterns window, you will be able to see an enlarged picture of the forming pattern.
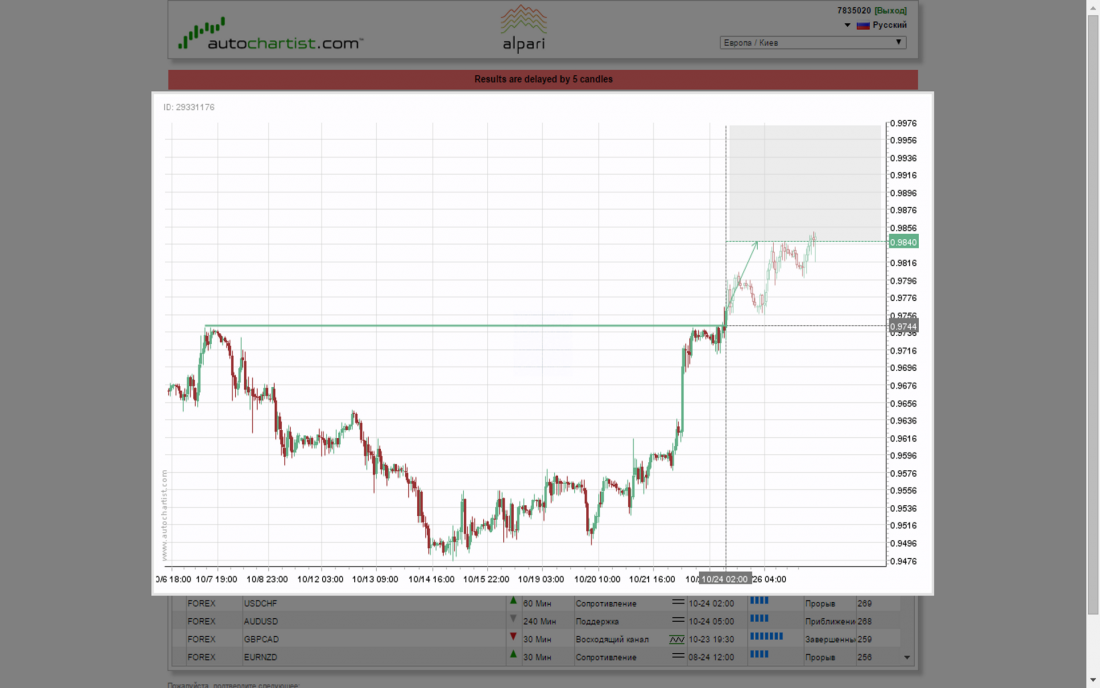
To the right of the chart there is a window with an analysis of the quality of the found pattern.
Below is the Results Filter, which consists of chart patterns with categories of new and completed, Fibonacci patterns with categories of new and completed figures, as well as key levels with categories of breakouts and approaches. Using the filter, from a large number of trading opportunities you can choose the ones that are most interesting to you.
In the search window you have the opportunity to add a new search query, while you have a choice between a group of instruments or a single symbol. The search query will limit the area for the patterns being studied.
Volatility Analysis
The "Volatility Analysis" tab provides a forecast of the size of the price change range during the intraday period.
Performance Statistics
"Performance Statistics" shows how many patterns for which symbols reached the predicted values.
Messages and alerts
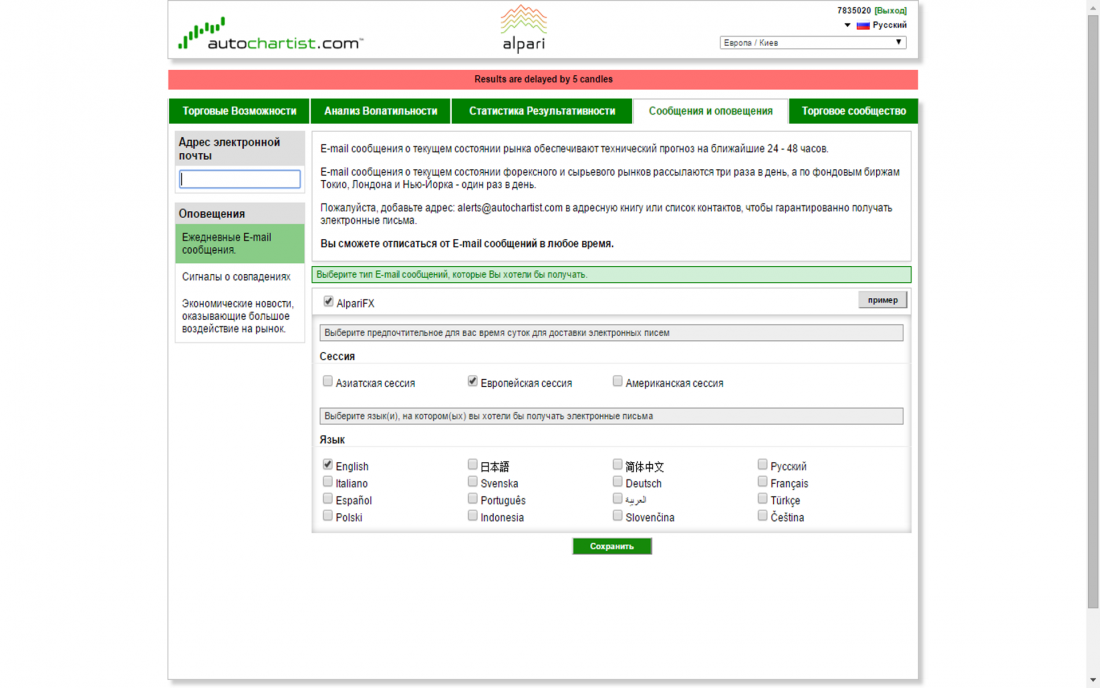
The "Messages and alerts" tab allows you to set up automatic sending of emails with a technical forecast, signals about forecast confirmations, and economic news. You can also set the language and delivery time of alerts from 3 independent options: the Asian, European, and American sessions.
Trading community
On the "Trading community" tab you will find links to the following additional materials:
- User guide;
- Links for downloading the program installation files for different platforms;
- Official e-book about discipline and risk management in trading;
- Indicator of the availability of history by instruments and timeframes;
- Introductory videos for a visual familiarization with the platform's capabilities.
Creating a search query
In fact, the so-called "search query" does not search for anything. The purpose of creating a query is to filter the selection of symbols and parameters according to the relevant criteria of your study. In other words, search queries are needed to study which patterns on which pairs work best. By default, you already have two filters (search queries) configured, these are a selection of the most popular trading instruments and instruments of the forex market intraday periods.
The result of a search query is either a predefined or a criteria-selected group of symbols. Each search query applies an additional customizable set of filters to the symbol selection.
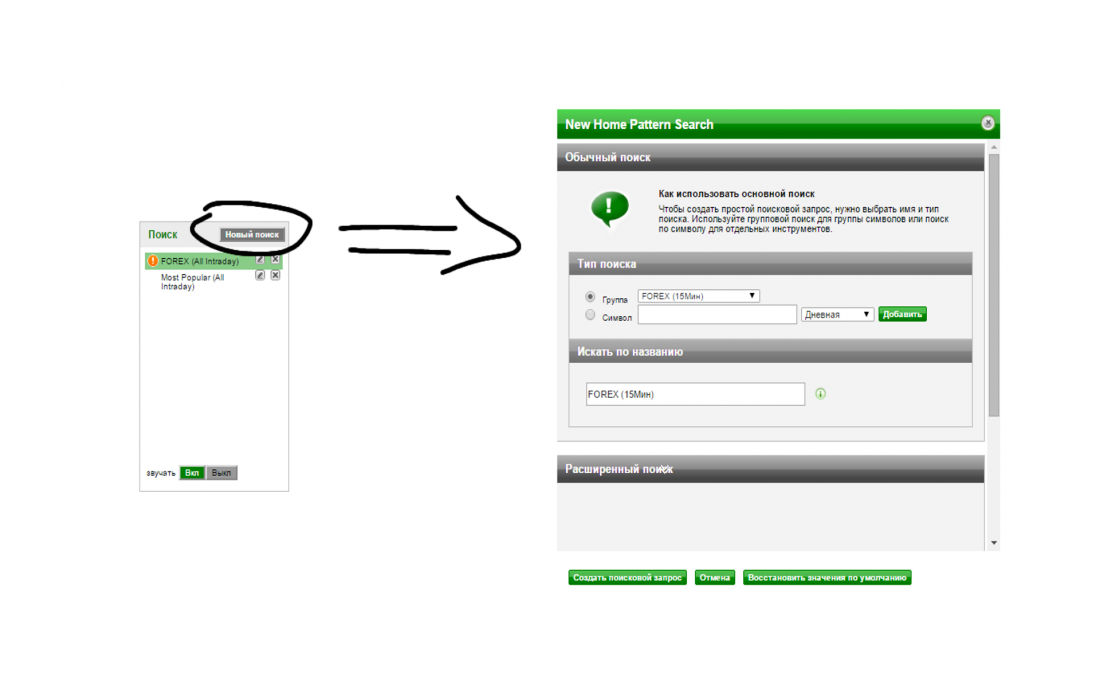
To add a new search, click the "New Search" button located in the search query list window.
Simple Search
The functionality of the "simple search" can be described as "Grouping," which includes selecting a preset group of symbols (as a rule, groups consist of symbols from one exchange or one time period), or entering a list of symbols manually.
After that, you can edit the search name if you wish.
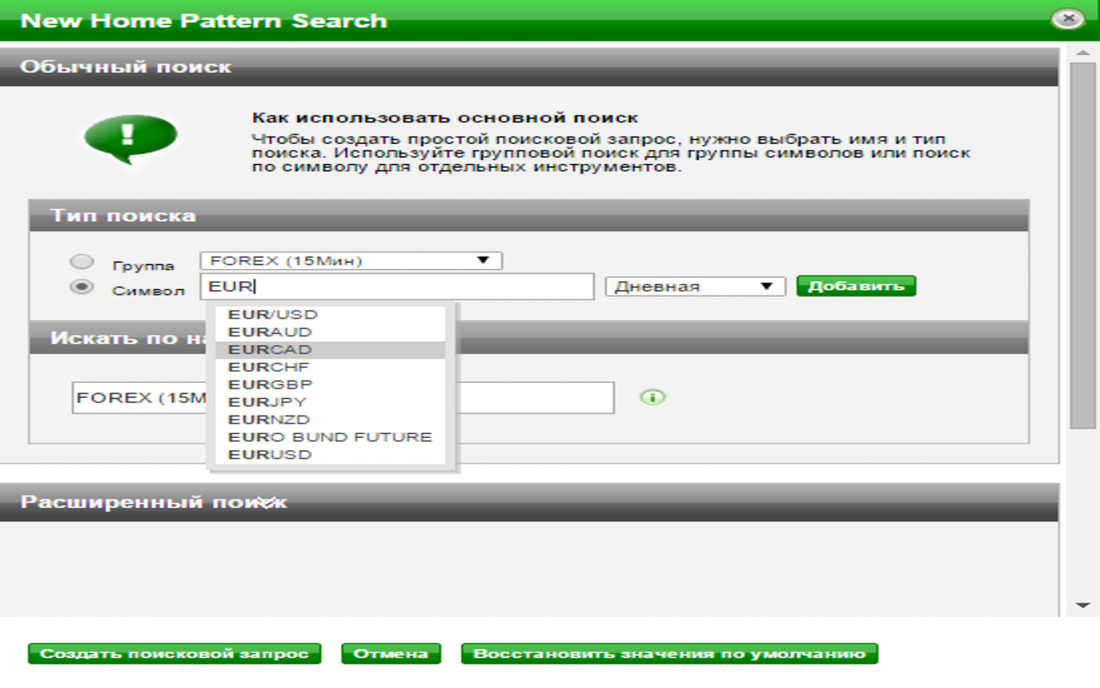
To enter a list of symbols manually, select the "Symbol" checkbox, then start typing the symbol name until a drop-down list appears from which you need to select the desired symbol. Now it remains to choose the time period from the drop-down list below and click "Add" to add the instrument to the list.
The text field at the bottom of the window is responsible for the search name. The name changes automatically and corresponds to the name of the selected group or symbol, but you can also use your own.
Finally, by clicking "Create Search Query," the search will be created and added to the general list.
Advanced Search
To open the advanced settings, click the spoiler labeled "Advanced Search" at the bottom of the simple search settings window.
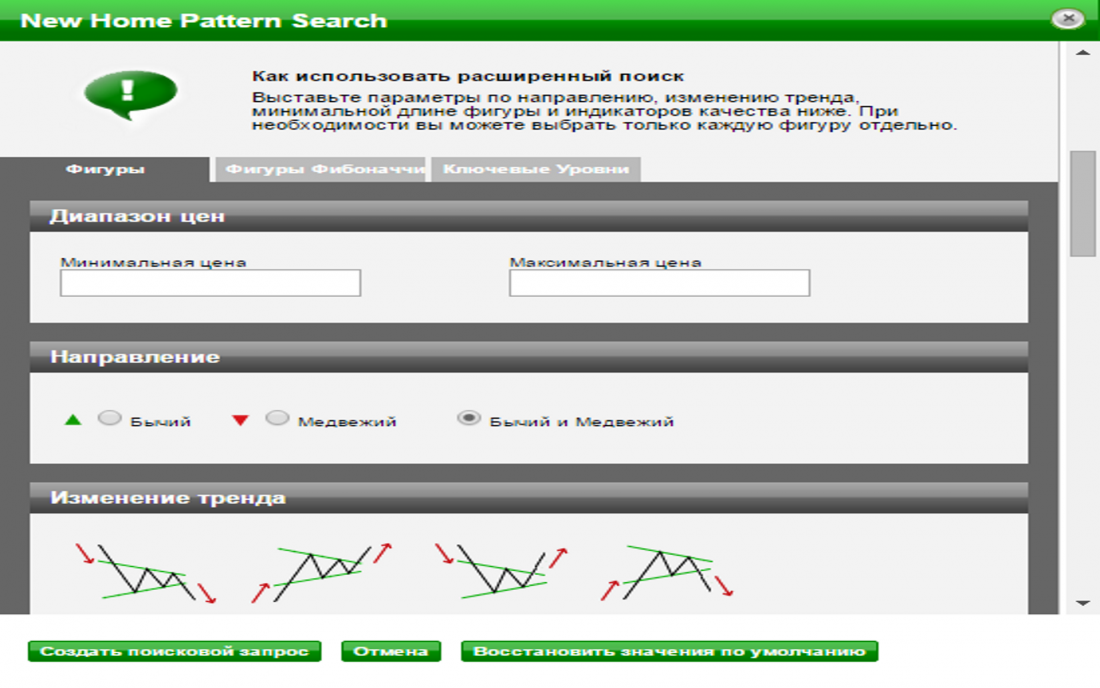
After that, a list with additional criteria will open, divided into three tabs: Patterns, Fibonacci Patterns, Key Levels. These 3 tabs contain additional settings that can be used to refine the search query.
Be careful when setting additional restrictions; restrictions that are too tight will cause the program to find far fewer trading opportunities, or even stop finding them altogether.
Next, let us discuss each section of the advanced settings separately.
Patterns
- Price range
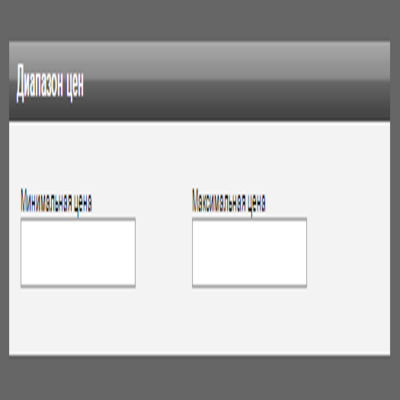
This function will be especially useful when trading stocks or contracts for difference, as it allows you to set the minimum and maximum price values in the corresponding text fields. For example, this may be needed to filter out stocks that are too cheap or too expensive.
- Trend change
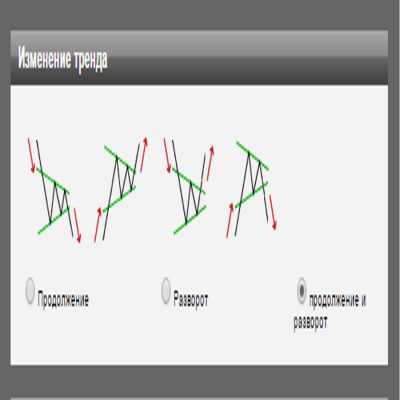
After the final formation of the pattern, the price can move either in the same direction as before or in the opposite one. In this case, you can limit the selection only to patterns with continuation in the direction of the trend, or only to patterns with an assumed reversal.
- Minimum pattern length
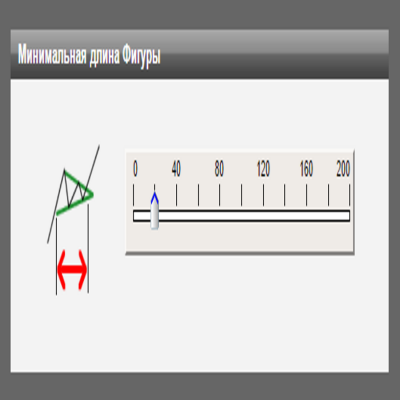
The length of a pattern is measured in bars on the price chart. That is, if the pattern length equals 24 on a chart with a 60-minute period, it means that the pattern was forming over the course of a day.
- Direction
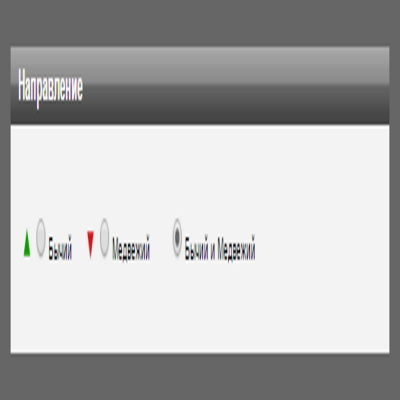
Allows you to set a restriction to bullish-only or bearish-only signals.
- Quality indicators
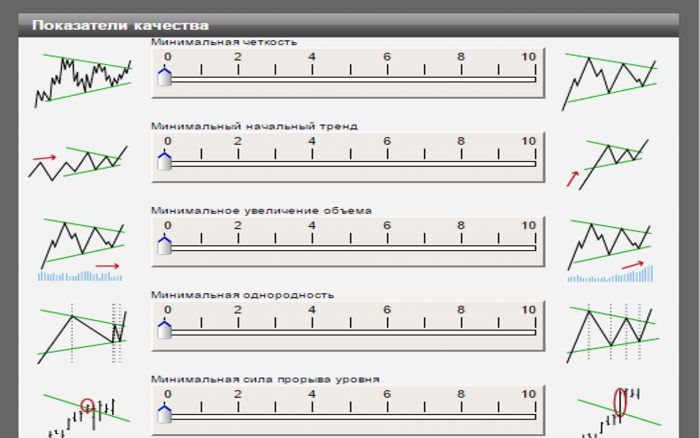
To measure the visual appeal of a pattern, Autochartist uses five additional functions:
- Clarity - determines the noise level on the price chart; specifically, the presence of many spikes will be rated lower;
- Initial trend - the strength of the preceding trend. A longer and more stable trend increases the importance of this parameter;
- Volume - an important indicator that measures changes in volume when support/resistance levels are broken;
- Uniformity - a higher uniformity score will mean a more even distribution of key points on the chart;
- Breakout strength - the size of the candle breaking a support or resistance level.
A more proportional and symmetrical pattern will obviously be more visually attractive. The final quality score is the arithmetic mean of all the other scores.
Quality is set by values from 0 to 10, where 10 is the best quality and 0 is the worst. But, of course, the main thing to understand is that these settings define the minimum quality requirements for patterns; that is, at a value of 0 the filter will let through all patterns regardless of quality, and at a limit of 10 only the highest-quality ones. However, such high-quality patterns are extremely rare, so you should not set extreme values, especially if you trade actively on forex.
- Patterns
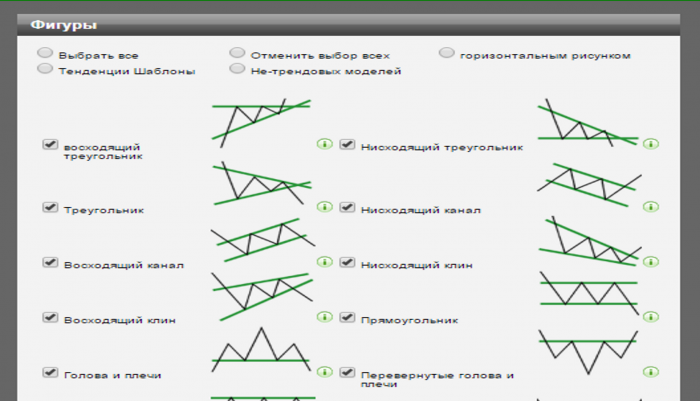
In the advanced section, you can configure the use of 16 types of chart patterns. Also, clicking the icon in the lower-right corner of each pattern opens a detailed description of the figure.
Fibonacci Patterns
The tab for Fibonacci patterns also has settings for the range, direction, and length of the pattern.
- Quality indicators
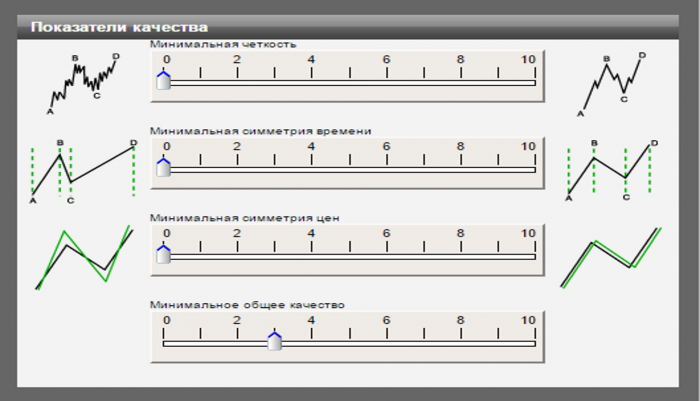
The quality indicator has the following settings:
- Minimum clarity - measured by the chart's "noisiness";
- Minimum time symmetry - an assessment of how well the time periods between the key points of the pattern correspond to Fibonacci ratios;
- Minimum price symmetry - the weight of this parameter depends on the size of the error when calculating the levels. The more accurately they correspond to real Fibonacci ratios, the greater the weight.
- Patterns
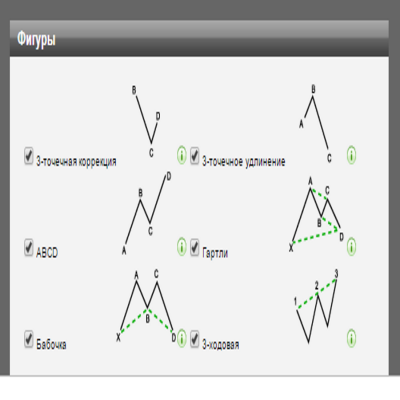
You have the option to create a filter based on six Fibonacci patterns recognized by the program: 3-point correction, 3-point extension, ABCD, Butterfly, Gartley, 3-Drive.
Key Levels
The filter for support and resistance lines also has its own unique settings.
- Quality indicators
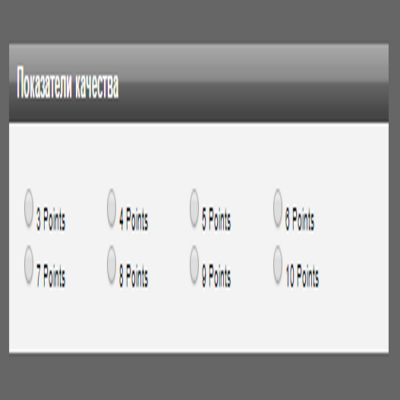
By default, any key level will have at least 3 points. In this case, you can increase this parameter up to 10.
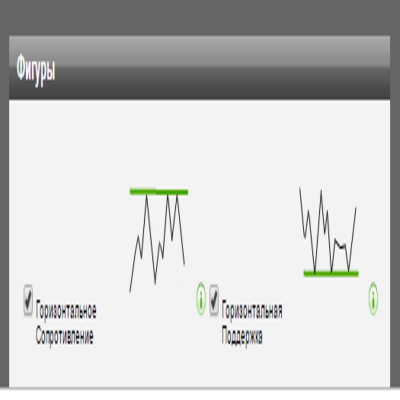
- Patterns
Trading Signals from Autochartist
 The Autochartist application allows you to significantly reduce the time spent studying charts thanks to the automatic identification of various chart patterns and key levels. Another undeniable advantage of this product is the accumulation of pattern performance history over the last 6 months, which makes deep analysis of your own trading activity possible.
No manual analytics can compare in productivity with an automatic tool that analyzes hundreds of currency histories per day and produces dozens of ready-made trading opportunities.
For owners of real accounts, the Autochartist service is provided free of charge, while everyone else can try the demo version of the product - after filling out a short form, you will be able to use the software product in demo mode for 14 days.
The Autochartist application allows you to significantly reduce the time spent studying charts thanks to the automatic identification of various chart patterns and key levels. Another undeniable advantage of this product is the accumulation of pattern performance history over the last 6 months, which makes deep analysis of your own trading activity possible.
No manual analytics can compare in productivity with an automatic tool that analyzes hundreds of currency histories per day and produces dozens of ready-made trading opportunities.
For owners of real accounts, the Autochartist service is provided free of charge, while everyone else can try the demo version of the product - after filling out a short form, you will be able to use the software product in demo mode for 14 days.
Advantages and disadvantages

Advantages of Autochartist
- The application runs in a web browser and does not require installation of additional software;
- A simple interface with division into 5 work areas;
- Alerts allow you not to miss important trading signals, economic news, as well as special technical forecasts;
- Autochartist saves you time. The program does the most difficult part of the calculations and produces signals ready for use in trading, and also identifies patterns even before they are fully formed, allowing early entries;
- Deep filter customization allows you to conduct your own studies of the quality of inefficiencies in a particular area of the market;
- Along with the software product, in the corresponding section absolutely everyone is provided with many training materials in the form of documentation, articles, and videos free of charge;
- In addition to the web platform and plugins for MetaTrader 4, Autochartist is also compatible with mobile devices, which gives you the opportunity not to break away from trading activity even on the road.
Disadvantages of Autochartist
- Free use of the program is available to clients of not all forex brokers;
- The program will be available only to intraday traders, as well as to those who use technical analysis patterns in their strategies;
- To fully understand how the program works and the area of influence of each parameter in the settings, a certain period of time for adaptation may be required, especially for beginner traders.
- From time to time the program produces forecasts that are too late, as a result of which the right moment for entry may be missed.
Conclusion

Having Autochartist in their arsenal, a forex trader not only lightens their activity by getting rid of the routine work of recognizing chart patterns, but also reaches a qualitatively new level of technical analysis.
Autochartist is certainly an indispensable assistant, since it provides all the information necessary for trading, including trading signals and risk accounting. The program also includes several quality functions that reflect pattern characteristics such as accuracy, visual attractiveness, and time symmetry, which makes it possible to calculate further price development scenarios with enviable accuracy, as well as significantly improve the execution of forecasts.
Especially for beginners, the program will replace a study guide for identifying trading patterns on the chart, allowing them not only to check the pattern-recognition skills they already have, but also to try to improve them so that in the future they can find patterns "by eye".
Forum thread
Respectfully, Alexey Vergunov TradeLikeaPro.ru