
Analyzing Trading System Tests with Myfxbook
 Hello, trader friends! Earlier we already discussed how to create monitoring for your account on Myfxbook. However, besides creating and observing account monitorings, this service has other capabilities as well. One of them is the function of in-depth analysis of reports from the Metatrader strategy tester. Moreover, these can be both test reports of forex expert advisors and reports on your manual trading.
Why is this needed? Advanced test analysis lets you see what is not visible in a regular report. For example, on which days of the week there were more losing / profitable trades. Or how many months the longest drawdown period lasted. In short, the function is useful, watch the video and you will understand everything yourself.
How to Use Myfxbook: Trading System Analysis
In this article we will talk about the Myfxbook service. We already talked about it when we covered how to create monitoring for your trading account with this service. It has one more interesting feature: analysis of your trading system, of reports from the strategy tester of the Metatrader terminal.
These can be either reports on EA trading or reports on your manual trading. This service element allows you to see the data that are not visible directly in the report of the trading terminal itself.
How to Upload a Report
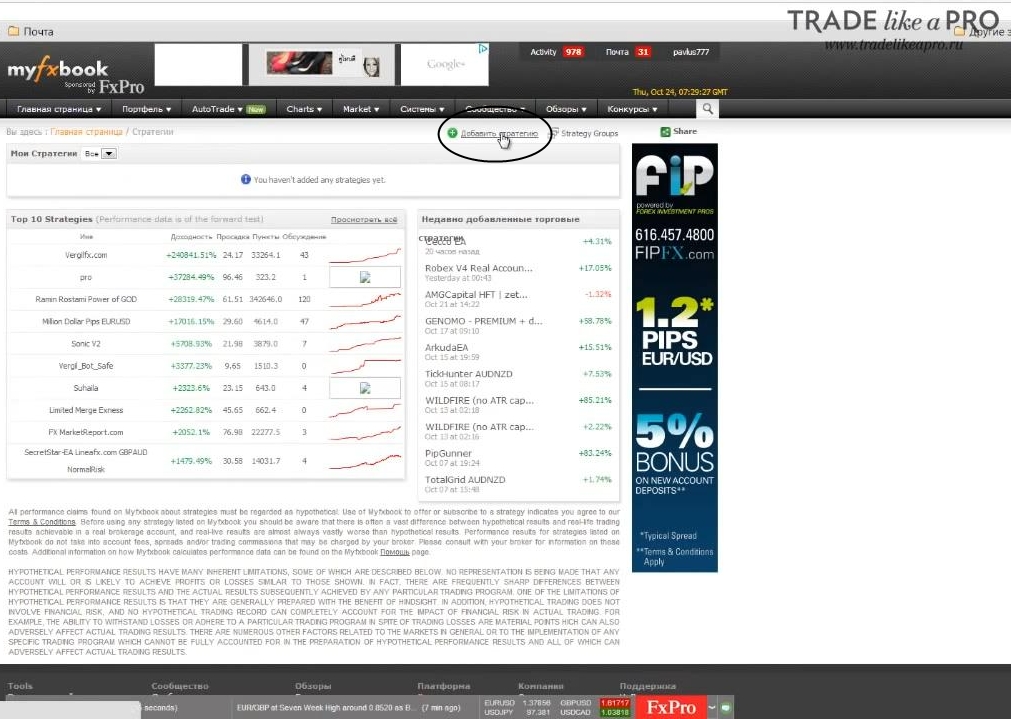
To upload reports on the website http://www.myfxbook.com, naturally, you must be registered there. First, using other people’s systems as an example, let us look at how everything is displayed here. Find the "Systems" tab (or "Systems" if your site interface is in English) and select "Strategies" (or "Strategies"). A page like this loads.
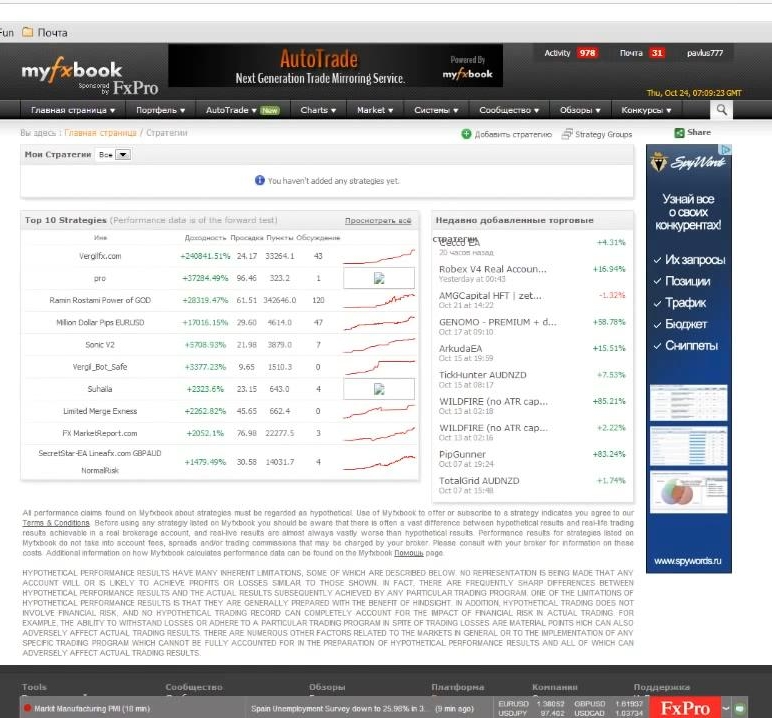
Here you can see the top 10 strategy tester reports by profitability. Do not look at these thousands and millions of percent, as we all know, in the strategy tester, with a programmer who knows what they are doing, you can achieve absolutely any profitability. Up to the point that some scammers create EAs that read history, showing, of course, millions of percent in profit, but in reality blowing accounts. Therefore, do not pay much attention to these strategies. You can draw absolutely any numbers here if you want.
We will use the capabilities of this service specifically for our own benefit, for analyzing our own strategy. There is no point in looking at other people’s scams. Usually they post something here that is being sold. And in this way they attract additional suckers into buying some EAs or strategies.
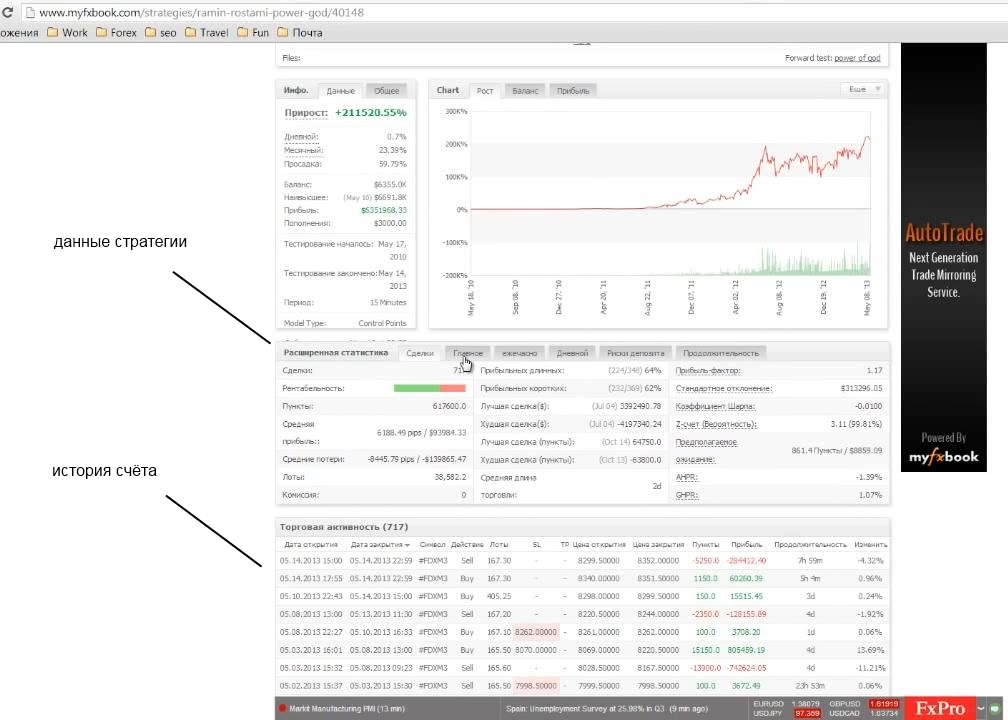
Let us open some other person’s report. It is not so important to us what exactly. Everything here is displayed in much more detail than in the standard terminal strategy report. The same data are used here, the history of our trades. But there is a possibility of viewing by months. This is an important function, because it happens that an EA is on a real account, trading, earning, and at some point a drawdown begins. The EA does not earn or even loses money for some extended period: one month, two, three.
And you do not understand what this means at all. Is it just such a period, or is something wrong with the EA, or has the market changed a lot? Using this service, you can test the EA on history and see that it is absolutely normal for it to be in drawdown for five months (such EAs do exist). After that, you conclude that if your EA is in drawdown for a month right now, this is quite normal, such situations have happened, and more than once. We can see that in some months the system gave returns of 100%, in some months −36%, −3%, −20%. Thus, this function is very useful.
All the data that we have in monitoring are also available here. Only here you need to take into account that this is not a real account, but merely reports from the tester. Therefore, do not look too closely at other people’s reports, you can draw anything there. Here we can see "General", "Instruments", "Pips", "Profits" (with the percentage of profitable trades, for long trades, for short trades, total), "Deposit Risks", "Trade Duration" and "Balance Growth".
Analysis of the Strategy Tester Report
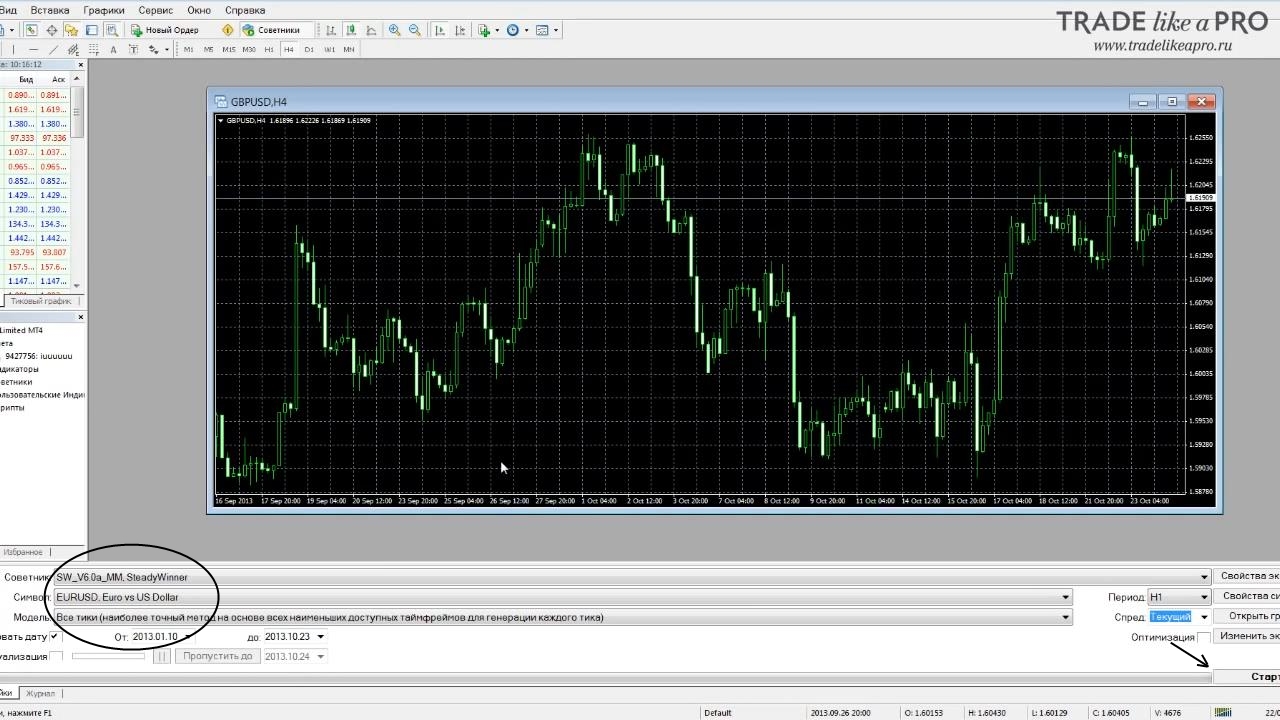
Let us see how to upload your own report to the Myfxbook server. And we will analyze our own trading system, our own reports from the tester. Go to the "Trading Terminal", open the strategy tester and test some EA, everything as usual. For the example I chose the EA SteadyWinner, it is available on our forum.
This EA is a scalper, it has drawdown periods, it is not a martingale. It suits us well for demonstrating the possibilities of strategy tester report analysis using the Myfxbook service. Run a small test.
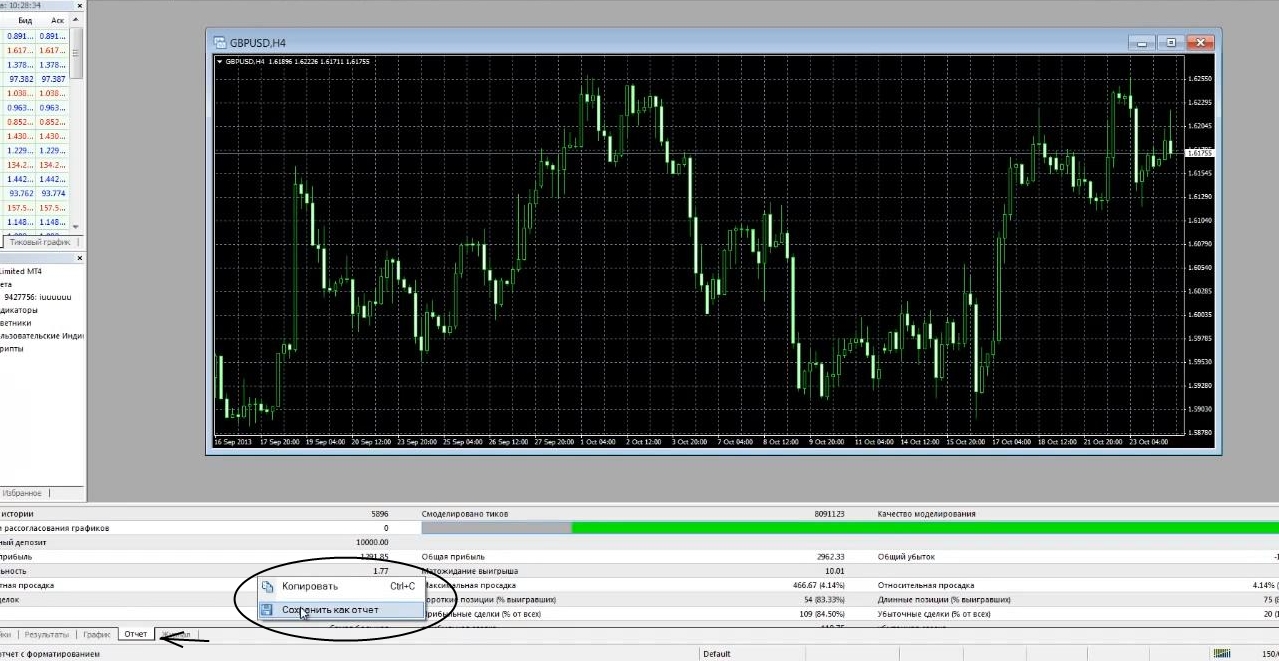
After the test is completed, we go to the "Report" tab and right-click, select "Save as Report". Here you choose any place where to save it. You can also give the report any name, not necessarily "StrategyTester". You can rename the report when saving it, whichever is more convenient for you. Now we need to upload our report to the Myfxbook service.
First of all, you must be registered there so that you have the ability to upload reports. Next, after you have logged in under your nickname on the service, select the "Systems", "Strategies" tab and here find the "Add Strategies" button (or "Add Strategies" if your site interface is in English).
How to Make a Report Public
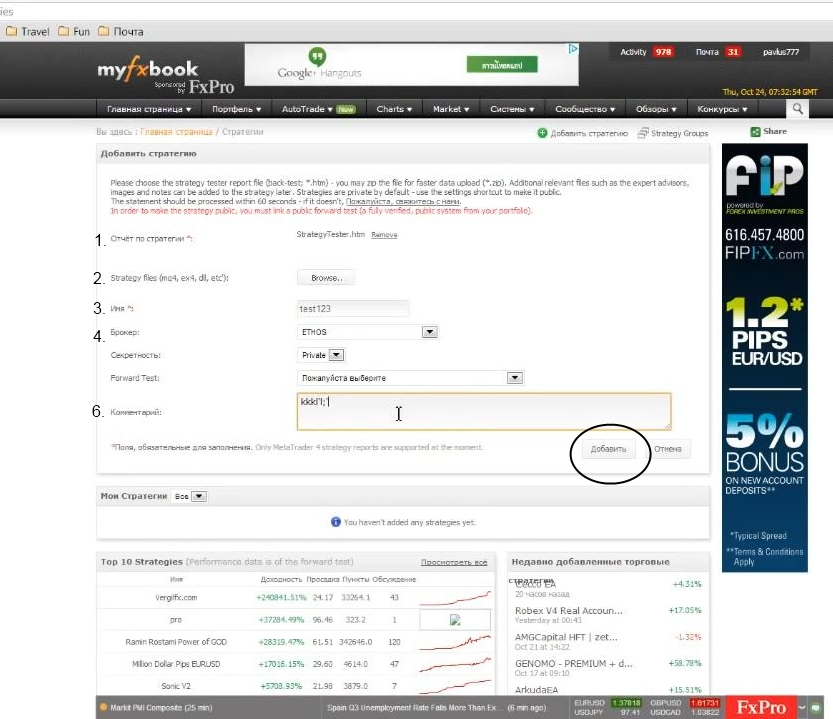
The page says that you can upload a saved backtest both in Zip format and in Html format. If you want to get into the public listing, to make your report public, you need to attach monitoring of a real account to this report as well. This is at least some measure against scammers. But you can upload one report and attach completely different monitoring, so do not pay attention to this top of strategies.
The first thing they ask us to do is upload the report file. Click the "Strategy Report" button and select the file of our report that we created. It will upload in a few seconds. If you want to make a public report, below you can immediately upload the files you want to share. This can be some development of yours, or some free EA. If you want to share files with the public, you can attach them. We will not attach them, we do not need that.
You need to give your report some name, and then choose a broker. This information is needed if you are going to make a public report so that people understand which broker was used for the testing. But this is not so important for personal use. In the "Privacy" field you can choose "Private" or "Public." We leave "Private."
If you choose "Public," then accordingly you will need to attach some monitoring to your report. But we do not need to make the report public, we select "Private," that is, "Private." "Forward test" is needed if you want to attach some monitoring to this report.
You fill in the comment field optionally: you can write something, or you can leave it blank. For example, make some note for yourself that this is one of ten reports, from such-and-such period. And other reports have other comments. Comments of this type are more for you. For the public, you can put advertising here: "If you want to buy my system, write to e-mail, I will sell it to you for 10 000 dollars." Or for 100 dollars; most often scammers sell for that amount. Everyone will see these comments if you make the report public.
Multi-Purpose Tool
Next, click the "Add" button.
The upload to the server takes place, and we get a message that the strategy is now being processed, so we need to wait a little. In about 30 seconds, maybe in a minute or even two, the page reloads. You will see that your report has been processed.
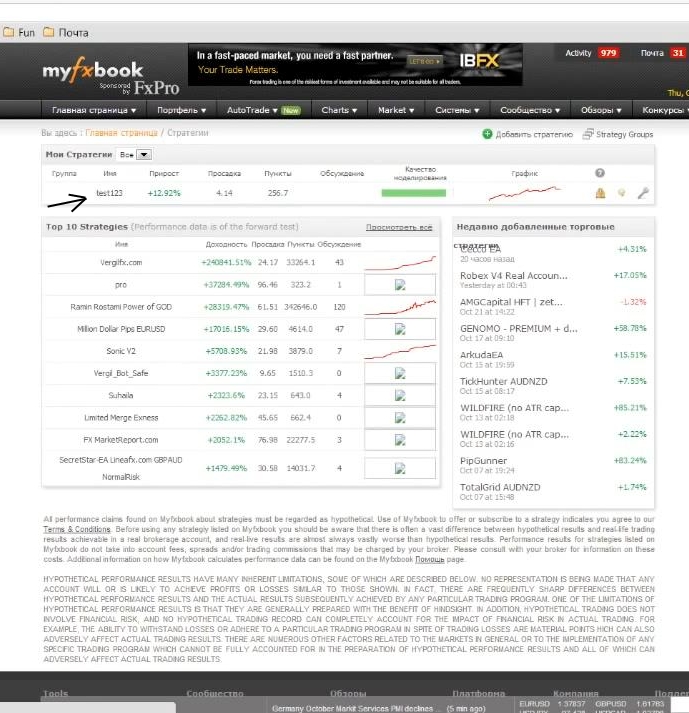
A miniature chart will appear as a model. And right away you can see how many points were earned, which is important. How much the percentage growth is, the strategy name, the drawdown. And if you click on the strategy name, a more detailed chart will open.
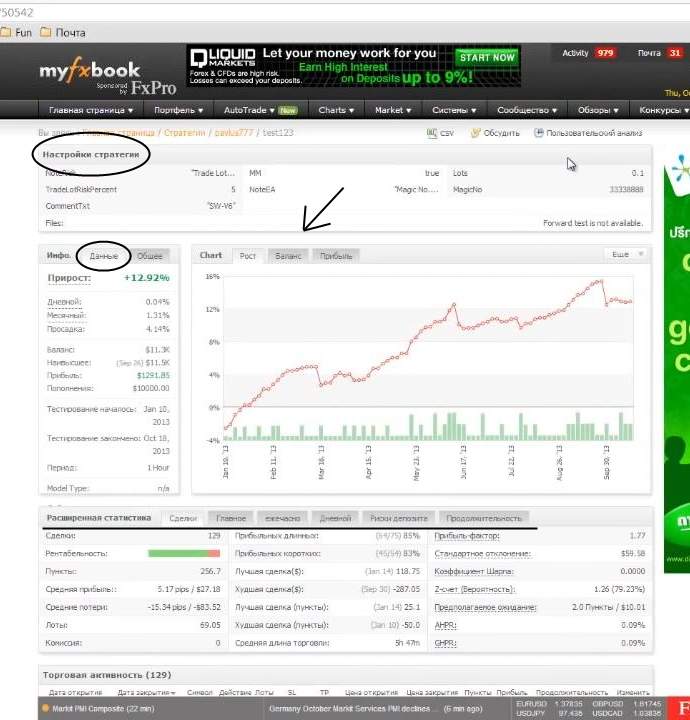
On this chart we will see the strategy settings that were used in the test (this is also visible in the simple report). Next come data that are very interesting: average daily income, average monthly income, drawdown in percent, the balance that was achieved as a result of testing, the highest value, profit, deposit, dates, modeling quality. There are also comments here; if you entered something, some notes for yourself, they will be displayed here. in the test, tick modeling. Naturally, the chart of balance growth, profit, and overall results.
Exactly the same statistics as with a regular real account monitoring. Trades, the percentage of profitable ones, longs, shorts, the best trade, commission, lots, average profit, average losses. Here, if we had some combined report and there were several pairs, then accordingly there would be several pairs on the "Main" tab. How many trades there were in total, how many points were earned. Profit on shorts, profit on longs. Percentage of profitable trades, percentage of losing trades.
Determine the Lucky Day of the Week
It is very useful to look at the ratio of profitable public trades by hour and by day of the week. Suppose your strategy does not work very well on Friday; perhaps because of the market closing, some trades do not reach profit. Using these data, you can make interesting observations.
I do not really like the "Deposit Risks" function in Myfxbook; it is the probability of losses. Suppose you have a 0.01 chance of losing 100% of the deposit. Theoretical risks of losing 50%, 40%, 30% of the deposit. In my opinion, this does not help much. This tab can be ignored.
Drawdown Duration - Is It Time to Sound the Alarm?
Another interesting tab is the duration of profitable trades. You can see what trades there were and how long they lasted (the longest and the shortest).
Another tab is profitability by month. It is very important; I mentioned this at the beginning of the article. In a regular trading terminal, when we view reports from the strategy tester, we do not see this. And these are very, very valuable data. This way you can determine what the duration period of your expert advisor's drawdown is. And if the expert advisor has been in drawdown for 2 months, and you saw that there were also 3 months of drawdown in the history, then everything is going normally, this has already happened. On average, you can also expect what size of profit in percent there will be in some specific month.
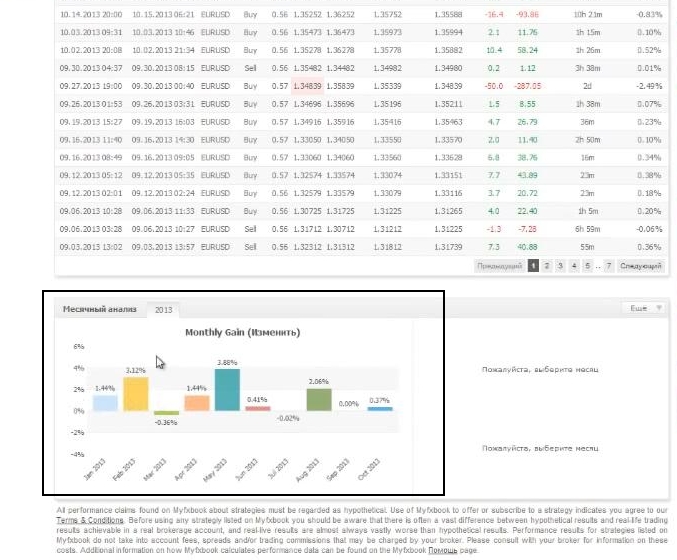
For customization on this service, you can press the "More" button everywhere. With its help, you can display profit in dollars or in points (how many points were earned or lost in some specific month).
Conclusion
The site http://www.myfxbook.com offers many very useful functions for analyzing reports from the strategy tester. I highly recommend using this service, because you will get more data about the test of your trading expert advisor.
Respectfully, Pavel
TradeLikeaPro.ru