
Long/Short Ratio in Cryptocurrency: What It Is, How to Analyze It, and Use It in Trading

The world of crypto trading is full of mysterious metrics. Even experienced forex or stock traders often cannot understand what all these metrics are talking about.
One of the most visual but tricky cryptocurrency indicators is the Long/Short Ratio, which shows the real balance of power between buyers and sellers.
In this article, we will examine what this metric is, why it is critically important for analyzing the crypto market, how not to fall into its traps, and which tools it is best combined with.
What Long/Short Ratio Is in Simple Terms
Long/Short Ratio (LSR) is the ratio of the number of open long positions to the number of short positions. Today, it is one of the most popular Market Sentiment analysis indicators, allowing you to assess the balance between buyers and sellers in the cryptocurrency derivatives market (futures and options).
Technically, this is a metric that compares the number or volume of open positions expecting a price increase (Long) with positions expecting a decline (Short). Simply put, the Long/Short Ratio answers the question of how many futures market participants are currently betting on a cryptocurrency rising, and how many on falling.
To put it as simply as possible, Long means a trader buys a futures contract and expects the price to rise, while Short means a trader sells a futures contract and expects a decline.
The formula looks as follows:
Long/Short Ratio = Number of Long positions / Number of Short positions
Ratio > 1 means there are more longs than shorts (the market is bullish).
Ratio < 1 means there are more shorts than longs (the market is bearish).
Ratio = 1 is perfect balance, 50 to 50.
For example, if 6000 longs and 3000 shorts are open, then LSR = 6000 / 3000 = 2.0. This means there are twice as many long positions.
There are two fundamentally different ways to calculate this Long/Short Ratio, which give a different picture:
By number of accounts (Accounts Ratio). It calculates what percentage of traders (or their accounts) are in buys, and what percentage are in sells. In fact, in this case it is about the “crowd sentiment.”
By position volume (Volume/Positions Ratio). It counts not traders, but money. The total size of all longs in dollars (or BTC/ETH) is compared with the total size of shorts.
To understand the difference, let us imagine that more than 80% of traders in the market are sitting in longs (bullish crowd sentiment), but at the same time one “whale” holds a giant short position exceeding the volumes of all retail traders. In this case, account-based LSR will show 4.0 (80/20), while volume-based LSR may be 0.5, signaling a real bearish threat.
TLAP has brought together both calculation options for the Long/Short Ratio — Crypto Futures Positioning indicator in one window.
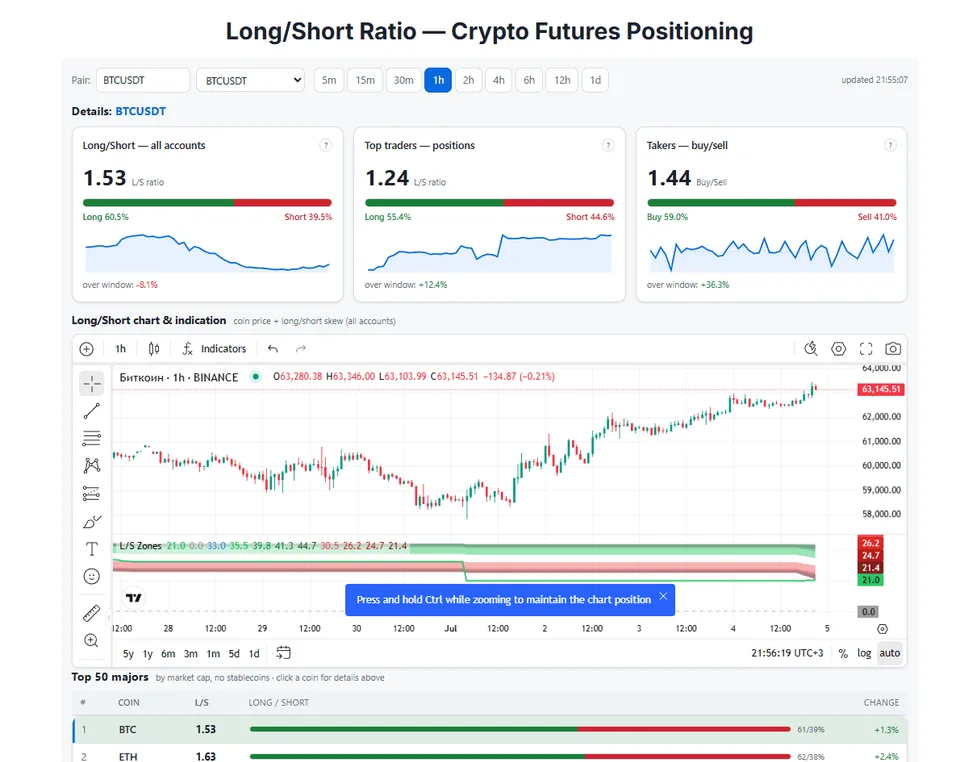
The “All Accounts” metric is responsible for calculating the Accounts Ratio. In turn, the “Top Traders — Positions” metrics (the top 20% of traders by margin) and “Takers” (the ratio of aggressive buys to sells by taker volume) are the Volume/Positions Ratio.
In addition, the Long/Short Ratio indicator allows you to assess all three metrics on different timeframes (5m, 15m, 30m, 1h, 2h, 4h, 6h, 12h, 1d).
Of course, the LSR indicator can be viewed directly on exchange websites (Binance Futures, Bybit, or OKX), but it should be remembered that each exchange shows statistics only for its own users. Therefore, to assess the real state of affairs, it is necessary to evaluate the entire market, which is what the TLAP Long/Short Ratio indicator makes possible.
How should the Long/Short Ratio indicator readings be assessed?
There are no universal values for assessing the significance of LSR data, and they also differ for different coins. But conditionally, you can use the following guide: around 1 means balance; 1.2–1.5 means a moderate advantage for buyers; above 2 means a strong skew toward Long; below 0.8 means a noticeable predominance of Short; below 0.5 means extreme bearish sentiment.
It is important to analyze not only the value itself, but also the history of changes in the indicator.
How to Apply the Long/Short Ratio
The cryptocurrency market is unique. Unlike the stock market, crowd sentiment here changes instantly and often reaches extremes. This is where the Long/Short Ratio becomes indispensable, because this ratio helps understand market psychology.
For example. The price is rising, and the Long Ratio is rising at the same time. This means more and more people are starting to believe in further growth. If the indicator becomes extreme, the market may be overheated, especially with a high funding rate.
The opposite situation occurs during panic: the price falls, and everyone opens short. As soon as the number of shorts reaches extreme values, the probability of a sharp rebound increases.
Using LSR with Other Analytical Tools
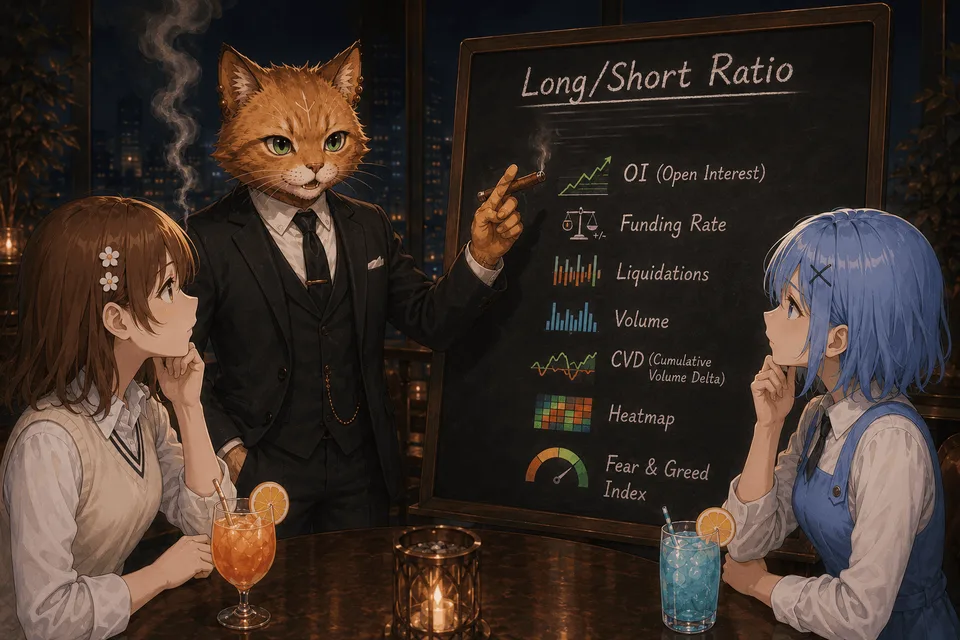
Open Interest
If the Long/Short Ratio shows participants' sentiment, then Open Interest shows how much money is generally held in open positions.
OI is rising + Long/Short Ratio is rising. A bullish trend with a serious capital inflow. Buyers are aggressive, and the trend is healthy.
OI is falling + Long/Short Ratio is rising. The price may stand still or rise slightly, but open interest is falling. This is a bearish signal. Bullish momentum is fading, and the market is “thinning out.” Longs are closing, and there is no movement.
OI is rising + Long/Short Ratio is falling. The crowd is aggressively shorting by opening new positions. The bearish trend is strong and backed by money.
OI is falling + Long/Short Ratio is falling. Shorts are massively taking profit. The downward trend is running out of steam, and an upward reversal is possible.
Funding Rate
Funding Rate shows which side is currently paying the fee. When there are too many long positions, the funding rate usually rises. This means buyers are willing to pay to hold their positions. Conversely, when there are many shorts, sellers pay funding to buyers.
High Long/Short Ratio + High positive funding. Critical overheating. Holding a long is too expensive, and the market is ready for a reversal or sharp correction. This is the ideal moment for caution.
Low Long/Short Ratio + Negative funding. Everyone is shorting, and short sellers are paying long holders. This is a classic environment for a short squeeze. The price can suddenly “shoot” upward, wiping out bears.
Liquidations
Another useful tool is the analysis of liquidations.
A large number of Long positions means that mass liquidations may begin if the price drops sharply. Conversely, a large number of Shorts increases the likelihood of a sharp rise due to a Short Squeeze.
Trading Volumes
Volume helps determine how much a move is supported by real trades.
If the price is rising, but volume is gradually decreasing, this may indicate weakening buyers.
CVD
Cumulative Volume Delta shows who is currently acting more aggressively: buyers or sellers.
Sometimes the price continues to rise, while CVD is already starting to decline. This may be the first signal that major players are gradually exiting the market.
Liquidity Map (Heatmap)
Liquidity Heatmap allows you to see levels where a large number of stop orders and liquidations are concentrated.
The price often tends to move specifically toward such zones, because they contain the liquidity needed by large market participants.
Sentiment Indexes (Fear & Greed)
The Fear and Greed Index is a composite indicator that takes into account volatility, volumes, bitcoin dominance, and more. It does not reflect positions, only emotions.
Long/Short Ratio gives a quantitative assessment of the crowd's actions (where the money was placed).
“Extreme greed.” An index > 80 together with an extremely high Long/Short Ratio almost always indicates an upcoming correction.
“Extreme fear.” An index < 20 together with an extremely low Long/Short Ratio has historically been a buying zone, but it is important to wait for confirmation from the price (for example, the formation of a bottom).
Mistakes in Applying the Long/Short Ratio

For beginners, the indicator seems like a kind of “Holy Grail”: you see that 80% are in longs, you short and get rich. But reality is harsher — let’s dive into it. In fact, everything is somewhat more complicated.
The most common mistakes are the following.
Buying only because Long is greater than Short.
Selling only because Short is greater than Long.
Ignoring Open Interest.
Not taking the Funding Rate into account.
Analyzing only one exchange.
Not looking at the history of changes in the indicator.
Taking extreme values as a guarantee of a reversal.