
Open Positions Indicator on Forex and Exchange Open Interest
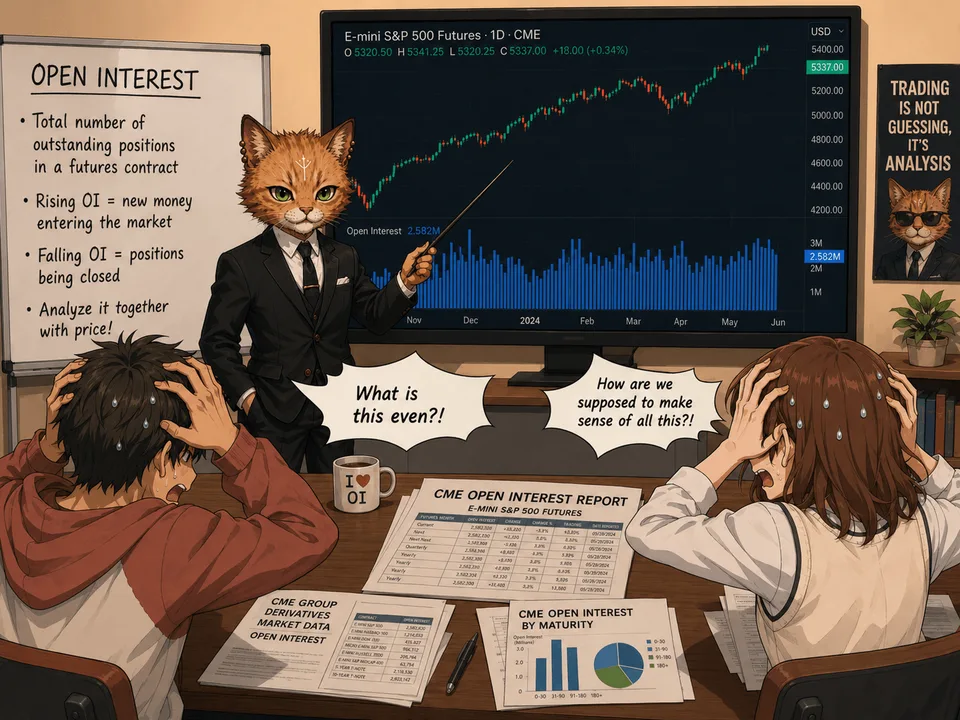
Open interest (Open Interest, OI) is one of the most underestimated tools for short-term and medium-term traders. Most market participants focus on price, volumes, and technical analysis, but it is open interest that helps determine whether new money stands behind a move or the market is simply redistributing already existing positions.
For futures and crypto futures, analyzing open interest on exchanges helps assess the strength of a trend, identify the accumulation of large positions, and determine the moments when a move begins to lose support from market participants.
The open position ratio indicator (often called Sentiment Indicator, Order Book, or Client Positioning) is a tool that shows the percentage or proportion of traders holding long (Buy) and short (Sell) positions on a currency pair in real time in the over-the-counter forex market.
In this article, we will examine how to use open position analysis for futures on indices, currencies (FX), oil, gold, and crypto.
What Open Interest Is on Exchanges
Open interest is the total number of outstanding futures or options contracts at the end of a trading session. If a new buyer opens a long position and a new seller opens a short one, open interest increases. If one of the parties closes a position, the figure decreases. That is why OI reflects the number of active obligations in the market, not trading volume.
It is important to understand the difference between volume and open interest:
Volume shows how many contracts were traded during the day.
Open Interest shows how many contracts remain open after the trading session ends.
You could say that volume shows activity, while open interest shows capital involvement. Rising OI usually means an inflow of new money into the market, while falling OI means capital is exiting and positions are being closed.
History of the Use of Open Interest
The concept of open interest appeared along with the development of organized commodity exchanges in the United States back in the first half of the 20th century. However, OI became a truly important analysis tool after the emergence of modern electronic venues and the publication of regular statistics by exchanges.
The analysis became especially popular after the U.S. Commodity Futures Trading Commission (CFTC) began publishing COT (Commitment of Traders) reports. These reports make it possible to see the distribution of open interest among different groups of participants: commercial hedgers, fund managers, large speculators, and other categories.
Today, open interest data is used not only in commodity markets, but also in index, currency, and cryptocurrency derivatives.
Official Data Sources
For OI analysis, it is critically important to obtain data from reliable primary sources.
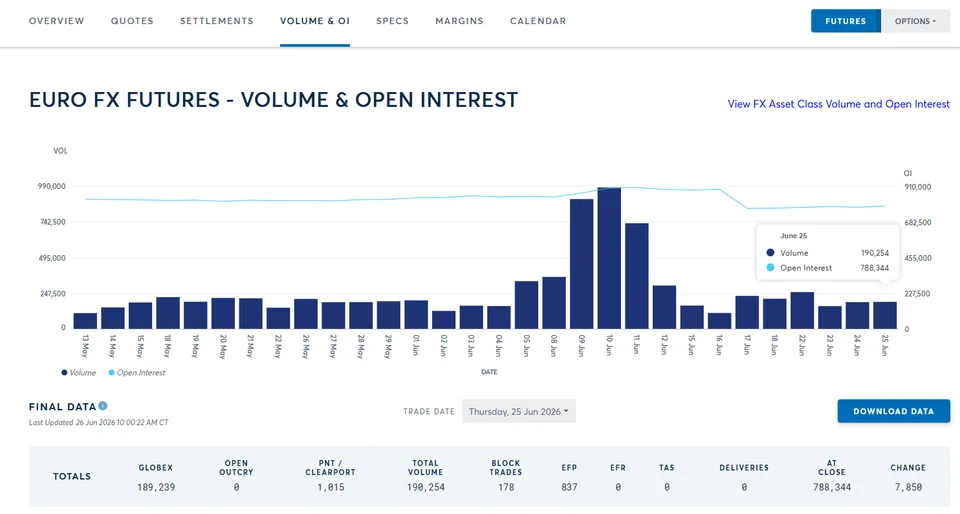
CME Group (USA) – the largest futures exchange. Its website provides daily “Volume & Open Interest” reports for all futures categories (currencies, indices, metals, oil, etc.), published after trading. They contain data on the current OI for each contract and the change compared with the previous day, and usually come out the next morning.
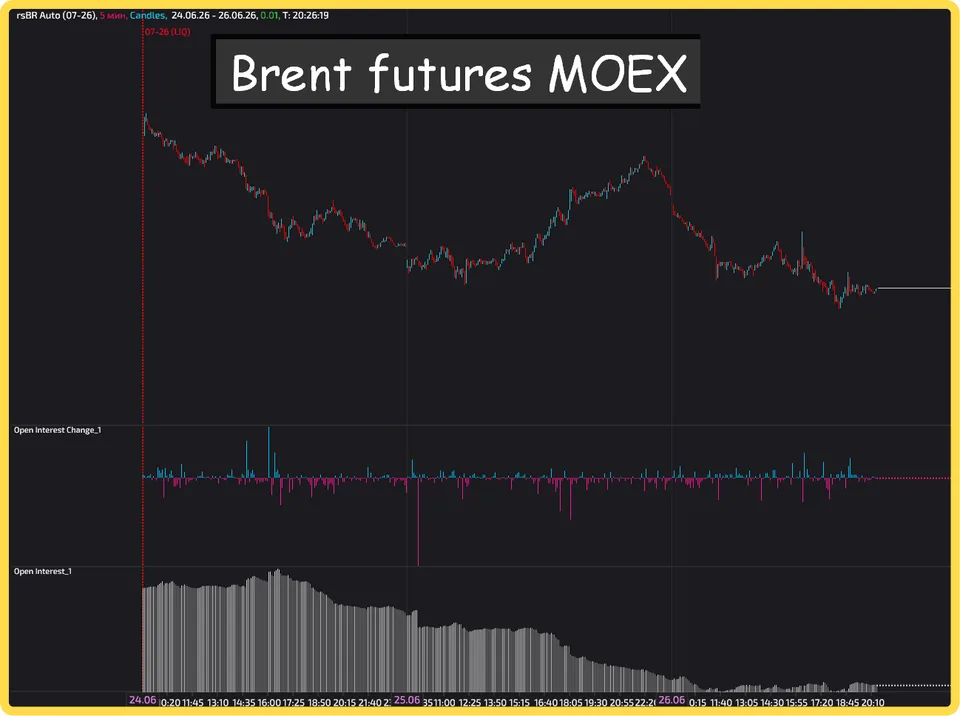
MOEX (Russia) – the Moscow Exchange publishes open interest in real time for all traded futures (with updates every 5 minutes). This data is easy to view through the web interface or the Moscow Exchange API. Many local platforms (QUIK, FinamTrade, etc.) also provide the OI indicator on futures charts.
Crypto exchanges – the largest derivatives venues (Binance, Bybit, OKX, Deribit, BitMEX, etc.) provide access to open position data for futures and perpetual contracts. Virtually each of them has a public API.
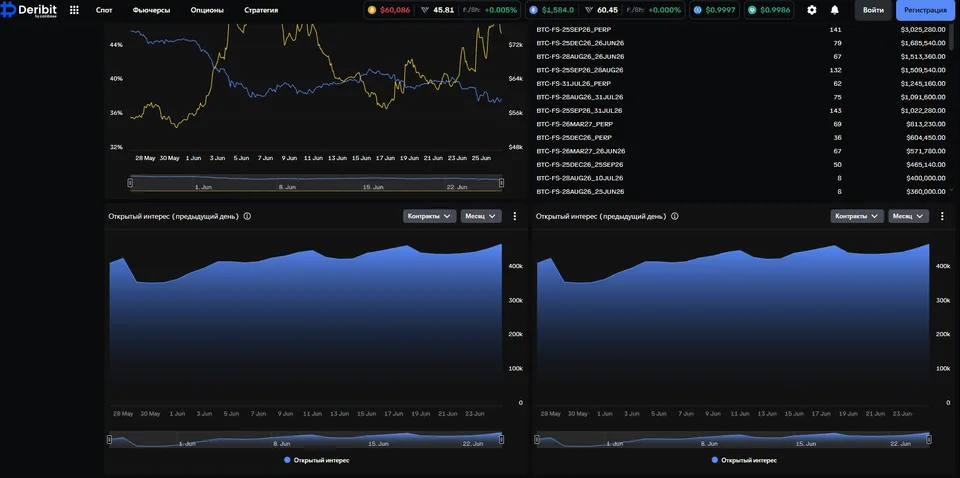
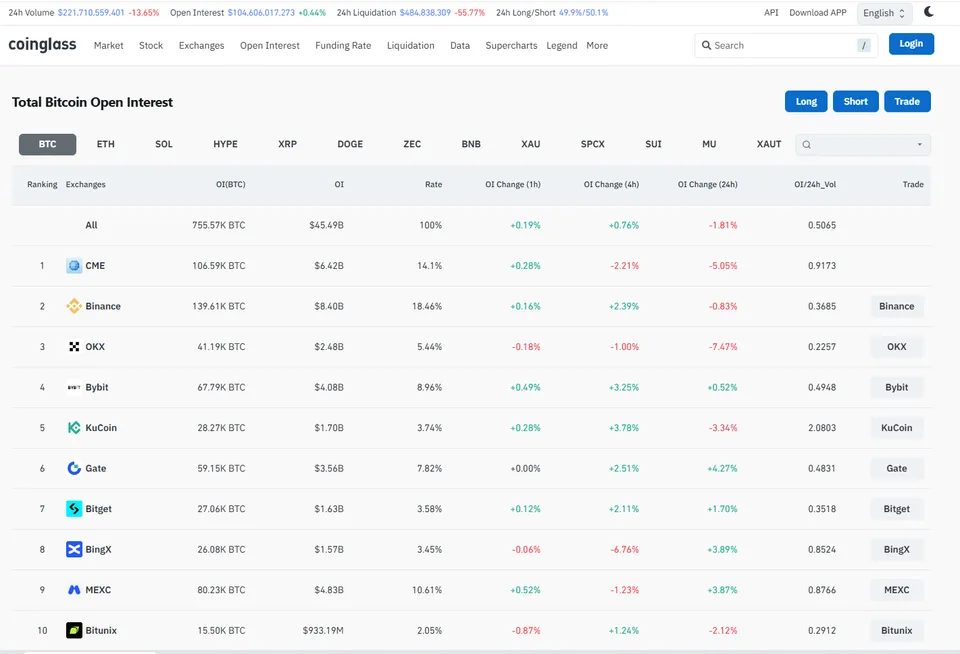
Aggregators and analytical services – services such as CoinGlass (formerly Bybt), Deribit, and others aggregate OI from many exchanges.
For example, CoinGlass provides open interest history for major cryptocurrencies across different platforms (there is a Web interface and a paid API).
Let us sum up.
Data sources | Metrics | Update |
|---|---|---|
CME Group | OI, volume, prices, opening/closing positions | Daily (morning) |
MOEX (Moscow Exchange) | OI, volume, prices | Every 5 minutes |
Binance Futures | OI, volume, price, funding, etc. | Instantly (API) |
Deribit | OI, volume, price, funding | Instantly (API) |
Coinglass | Aggregated OI for crypto futures | Minutes |
What the open positions indicator on Forex is
The open positions indicator (also called Open Position Ratio, Bull/Bear Ratio, Speculative Sentiment Index — SSI, or simply the Buy/Sell ratio) is a market sentiment tool that shows the percentage ratio of traders who are in long (Buy) and short (Sell) positions for a specific currency instrument.
The indicator aggregates data only on current open trades (excluding already closed ones). Data sources are:
Large brokerage companies (OANDA, FXCM, Dukascopy, Myfxbook, etc.)
Statistics collection services (ForexFactory, FXSSI).
The indicator is usually displayed as:
Percentages: Long 68% / Short 32%.
Ratio: 2.1:1 in favor of buys.
Real-time chart — bars showing the dynamics of position changes.
Sometimes they show not the number of traders, but the volume of open positions in money or lots.
It should be understood that most often the data represents only the clients of one broker — they may act differently from the entire market. In addition, large players (institutionals) are usually not reflected in retail reports.
The indicator often lags (updated once an hour/day), which reduces its value for scalping.
TLAP has developed a powerful and intuitive Forex open positions indicator for analyzing the ratio of Buy and Sell orders.
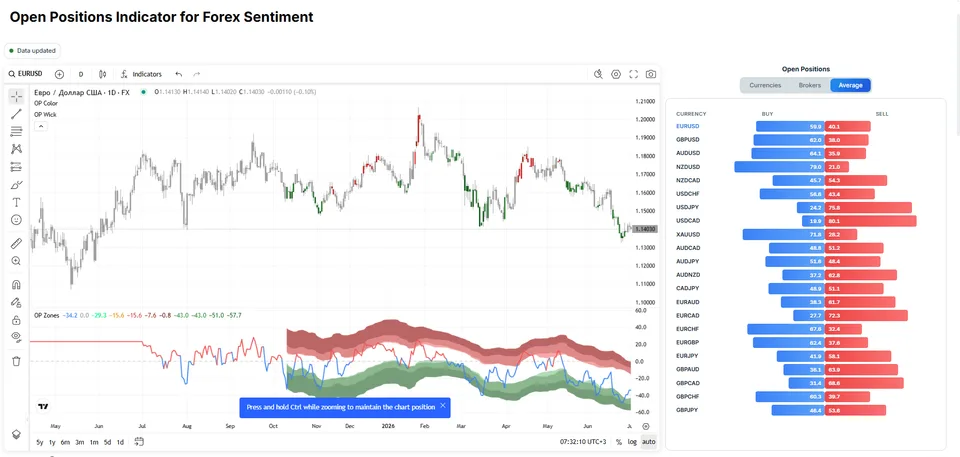
On the left, the chart of the selected currency is displayed (EURUSD in the example) with the OP Zones indicator, showing zones where Buy and Sell orders accumulate.
On the right, you can analyze open positions in the Forex market in more detail by selecting an instrument (14 currencies and gold), a broker (Oanda, Alpari, Myfxbook, FXBlue, DukasCopy), as well as the averaged value across all brokers.
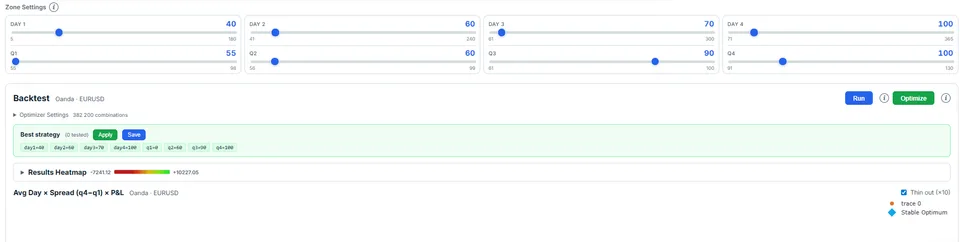
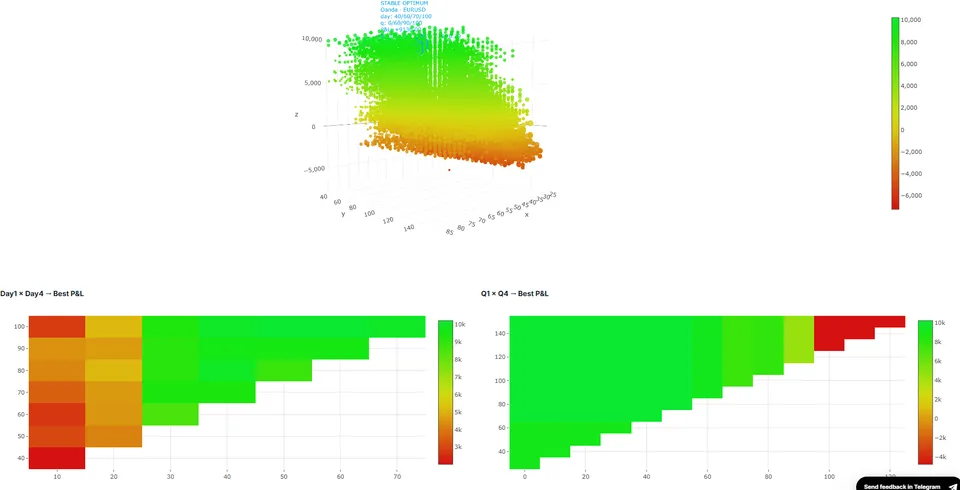
The strongest side of TLAP's Forex open positions indicator is the ability to backtest quote behavior on historical data depending on open positions.
Open Interest Analysis Methods

Open Interest on Exchanges
Comparison with Trading Volume (Correlation)
Since volume reflects daily trading activity, and OI is the aggregate number of positions, their joint analysis gives an idea of the “quality” of the move.
When the price rises, they check whether this is accompanied by an increase in OI and volume. Simultaneous growth of volume and OI indicates a strong trend (new participants are opening positions).
Divergences Between Price and OI
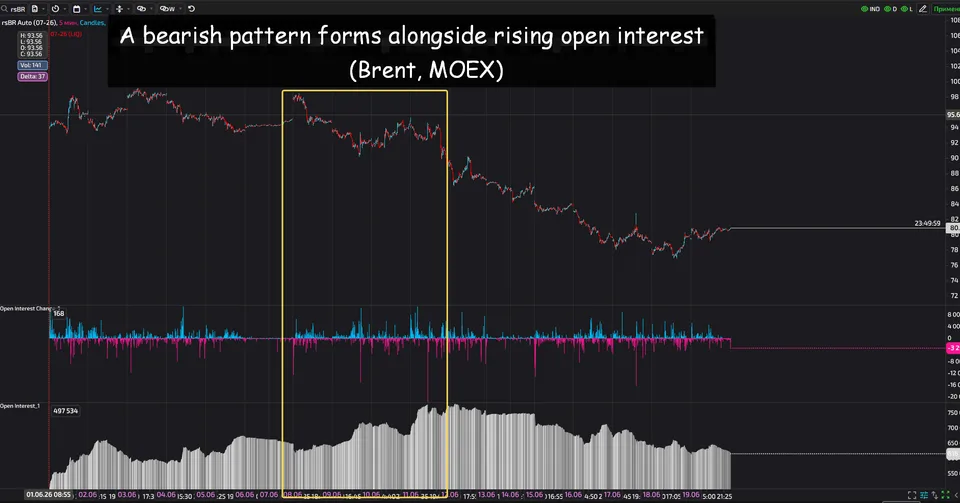
The classic approach is to compare the directions of price and OI changes. Scenarios:
Price rises + OI rises: the trend is confirmed, rising OI indicates an inflow of new positions (bullish signal).
Price rises + OI falls: the trend is losing support, many positions are being closed, a sign of a possible reversal or weakening bullish trend.
Price falls + OI rises: the bearish trend is strong (new shorts intensify the decline).
Price falls + OI falls: the trend is closing out, a decline in OI means participants are exiting sales, a precursor to stabilization or an upward reversal.
For reversal signals, it is important to check that volume does not contradict the picture.
Note that with a prolonged rise/fall in price and a sharp rise in open interest, a reversal may be preparing. In this case, you need to look at trend exhaustion, reversal formations, etc.
In balances, OI growth occurs at the boundaries in the opposite direction.
Liquidity Levels and Open/Closed Positions
OI serves as a liquidity indicator: high OI at specific price levels means a cluster of interest (support/resistance), low OI means a lack of participants. A change in OI (net position growth) shows how many trades led to the creation of new positions.
Calendar Effects (Expirations, Spread)
As a futures contract expiration date approaches, OI can sharply flow into the next contract (“contract spread”).
Thus, the OI chart for the near contract may fall abnormally at expiration, while OI for the far contract rises. Analysts take this into account: when rolling, they pay attention to the aggregate OI of several nearest contracts.
In addition, seasonal patterns (position reductions before holidays, the start of reporting periods) can create periodic “draining of the bathtub” (as Britannica metaphorically describes it). Spread strategies (calendar spread) also take into account the OI ratio of near and far contracts.
Open Positions on Forex
The main idea of analyzing open positions on Forex is that the “crowd” is often wrong at key reversals.
If there is an extreme predominance of Buy (e.g. >70–75%), the market is “overheated” with long positions, and the risk of a sharp downward correction is high.
If there is an extreme predominance of Sell (>70%), many have already sold; perhaps the bottom is near and an upward rebound will follow.
A moderate predominance toward the current trend (e.g. 60/40) may confirm continuation of the move.
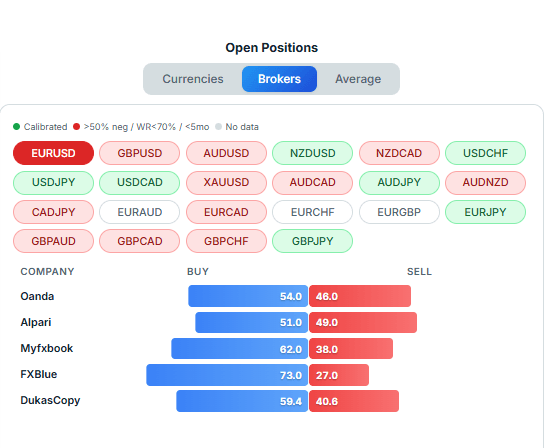
It is important to remember that reaching a significant imbalance level is not an instant signal. Price may continue moving against the crowd for a long time, and reversals occur when the market structure itself changes (levels, candlestick patterns, divergences). The indicator is better used as a filter or to assess the “extremeness” of sentiment.
At the same time, it is also necessary to understand that Forex players often build an average position against the trend and then take profit. This is where the “moves” against the crowd come from.
Practical Application in Medium-Term Trading (2–12 Weeks)
When trading on a 2–12 week horizon, OI signals are used to confirm the trend and choose entry/exit moments.
Entering a position. When a key level (support/resistance) breaks, it is desirable that the breakout be accompanied by growth in OI and volume, which confirms the seriousness of the move.
For example, if the oil price broke the previous high on high volume, and OI also showed a spike, you can open a long position (market entry or limit order just above the level).
Similarly, a sharp rise in OI while the price is falling may instead serve as a signal to open shorts.
Exiting a position. If, as a trend develops, the price continues moving, but OI begins to decline, this may mean participants are leaving (liquidating positions) and indicate an imminent slowdown.
In such a case, it is recommended to take profit. For example, if a rising EUR/USD trend has stalled, but OI is steadily declining, it makes sense to close part of the long and move the stop-loss to breakeven.
Risk management. OI helps manage risks: a decrease in OI when the price moves opposite to the expected signal can serve as an “alarm stop.”
Always set a stop-loss with volatility in mind; if the price moves against the trend and OI falls (the seller has closed out) – reduce lots. Keep in mind that high OI means high liquidity, but also increased participation by major players, which creates strong impulses.