
Funding in Perpetual Cryptocurrency Futures: Who Pays Whom and How Much

In the world of cryptocurrency trading, perpetual futures have long become the main instrument for speculation and hedging. Unlike classic futures with a fixed expiration date, perpetual or "everlasting" futures, or, as they are also called, perps, allow positions to be held for as long as desired: days, weeks, months, or even years.
To keep the price of such a contract from drifting far away from the actual spot price of the underlying asset (BTC, ETH, SOL, etc.), exchanges introduced a special mechanism: the funding rate, or simply funding.
In addition, analyzing funding makes it possible to assess whether a coin is overbought or oversold, which provides an extra and at the same time highly objective signal for a countertrend entry.
In this article, we will take a detailed look at what funding is, the methods of calculating it, as well as ways to use funding as a reference point when making trading decisions.
What Funding Is in Simple Terms

The idea of perpetual futures was first implemented by BitMEX in May 2016 on the XBTUSD contract. Instead of expiration, the funding rate mechanism was introduced. Later, all major platforms copied the model: Binance, Bybit, OKX, Deribit, dYdX, Hyperliquid, and others.
According to Coinglass, in early 2026 the daily trading volume of perpetual futures exceeds $100–200 billion, while open interest (OI) in BTC often exceeds $30 billion.
Funding is periodic payments between holders of long and short positions. It is not an exchange fee: the money moves directly from one group of traders to another. The goal is simple: to keep perp prices as close to spot as possible.
Without funding, the price of perpetual futures could move into endless contango (premium) or backwardation (discount), making the instrument useless for long-term holding. Funding solves this problem by imitating the cost of carry of traditional futures.
If the market is overheated with bullish sentiment and the futures contract is trading at a premium to spot, longs begin paying shorts. If bears dominate and the futures contract is at a discount, shorts pay longs. This mechanism creates an economic incentive to open opposite positions and pull the price back.
The goals of the funding mechanism are:
- ensuring market stability by preventing a prolonged divergence between futures and spot prices;
- encouraging traders to open positions in the direction that will return the price to fair value;
- reflecting market sentiment through the size of the rate.
Funding payments are made regularly, usually every 8 hours (at 00:00, 08:00, and 16:00 UTC) on most crypto exchanges. Some DEXs and Bybit during periods of high volatility make payments every 1–4 hours.
What Affects Funding
The size of the rate is influenced by:
- Market volatility. Sharp price moves increase the divergence between futures and spot.
- The volume of open positions. A large number of longs or shorts can cause an imbalance.
- Market sentiment. Traders' optimism or pessimism affects demand for long and short positions.
- Liquidity. Low trading volume amplifies price deviations.
- External events. News, regulation, and halvings can sharply change the dynamics.
Funding Calculation

For a trader, it is important to understand not so much the mathematical formula for calculating the rate itself (that is the exchange's job), but rather how much he personally will pay or receive. The calculation is extremely simple:
Funding fee = Position value x Funding rate.
Where: Position value is the size of your contract in dollar terms at the time of calculation.
- Positive funding (> 0): perp price > spot. Longs pay shorts. This happens in a bull market when there is an excess of long positions with high leverage. High positive funding (0,03–0,1% per period) signals overheating: longs are "overpaying" to hold, which encourages traders to open shorts and sell.
- Negative funding (< 0): perp price < spot. Shorts pay longs. Typical of a bear market or panic. Negative rates make shorting expensive and encourage buying (going long).
- Neutral funding (around 0 or ±0,01%): the market is balanced.
Payments are credited only to those who hold a position at the moment of calculation (funding timestamp). If you close the position 1 second before funding, there will be no payment. The exchange acts only as an intermediary: there are no exchange fees of its own for funding.
Calculation examples for long and short positions

Let us look at simple examples to see how leverage affects the absolute size of the payment.
Example 1: Positive funding (Long pays)
- Conditions: You opened a LONG on SOL. The funding rate is +0,05%.
- Situation A (without leverage): You have 10 000 USDT, and you open a position for exactly this amount. Calculation: 10 000 × 0,05% = 5 USDT. Result: You will pay 5 USDT to short holders.
- Situation B (with 10x leverage): You have 10 000 USDT, but you use 10x leverage and open a position for 100 000 USDT. Calculation: 100 000 × 0,05% = 50 USDT. Result: Even though your collateral is 10 000 USDT, you pay the fee on the full position value (100 000 USDT) — 50 USDT.
Example 2: Negative funding (Short pays)
- Conditions: You opened a SHORT on ETH. The funding rate is -0,1%.
- Situation: The value of your short position is 50 000 USDT. Calculation: Since the rate is negative, shorts pay longs. 50000 × 0,1% = 50 USDT. Result: 50 USDT will be deducted from your account in favor of long position holders. If the rate were positive while you were short, you would receive those 50 USDT.
The funding fee is charged from the available balance, not from the position margin. If there are insufficient funds in the balance to pay negative funding, the exchange may forcibly close the position.
Funding as an indicator of market sentiment

Funding is an excellent indicator of market "overheating." Extreme funding (> +0,1% or < –0,1% for most high-cap cryptocurrencies) is often an indicator that the move is ending.
Abnormally high positive funding indicates excessive greed and the dominance of a disproportionately large number of leveraged long positions. The market becomes overbought.
As soon as the flow of new money dries up, the high cost of holding positions forces longs to close, which can trigger a cascading price drop (a long squeeze). This often foreshadows a correction or a downward trend reversal.
Deeply negative funding indicates panic and an excessive number of shorts (oversold conditions). This is a signal that the market may "shoot" upward, as short sellers will begin to take profits or will be forced to close on the slightest rebound, adding fuel to the fire of growth (a short squeeze).
Analysis in combination with open interest
Experienced traders rarely look at funding in isolation. Its analysis paired with open interest (OI) provides key information.
- Price increase + OI increase + High positive funding: A classic bubble. The market is rising on borrowed money. There is a high risk of a sharp correction.
- Price decline + OI increase + High negative funding: Bears are actively increasing shorts. If the price stops falling, this can lead to a powerful short squeeze.
- Price decline + OI decline + Negative funding: Capitulation. Longs have been massively liquidated, and the market has been "cleansed" of overheating. This often serves as a signal that the bottom will be reached soon.
In addition, it is worth paying attention to the liquidation map and the Max Pain zones to combine signals.
Bybit funding rate calculation formula
Bybit uses one of the most balanced and transparent funding models among all crypto exchanges. The Bybit funding formula is almost identical to Binance, but with tighter caps and dynamically changing intervals during volatility.
You can view the current funding rate at the link above.
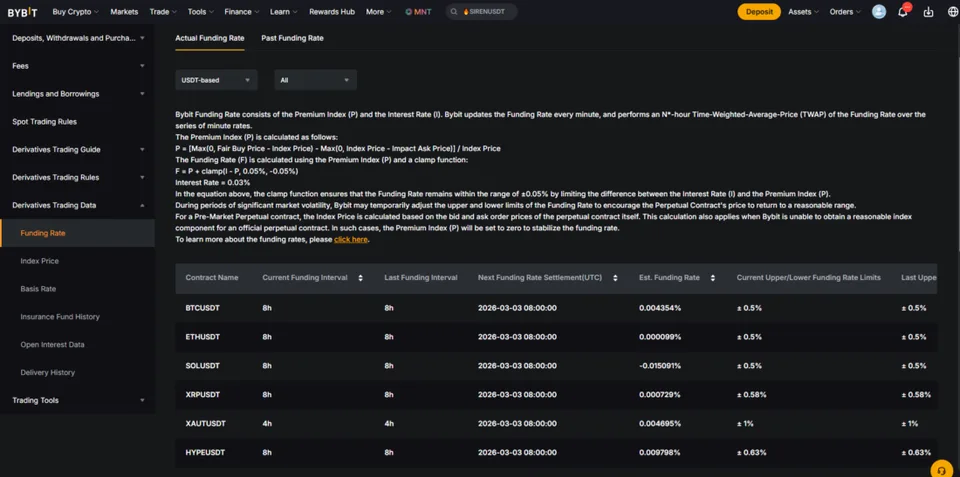
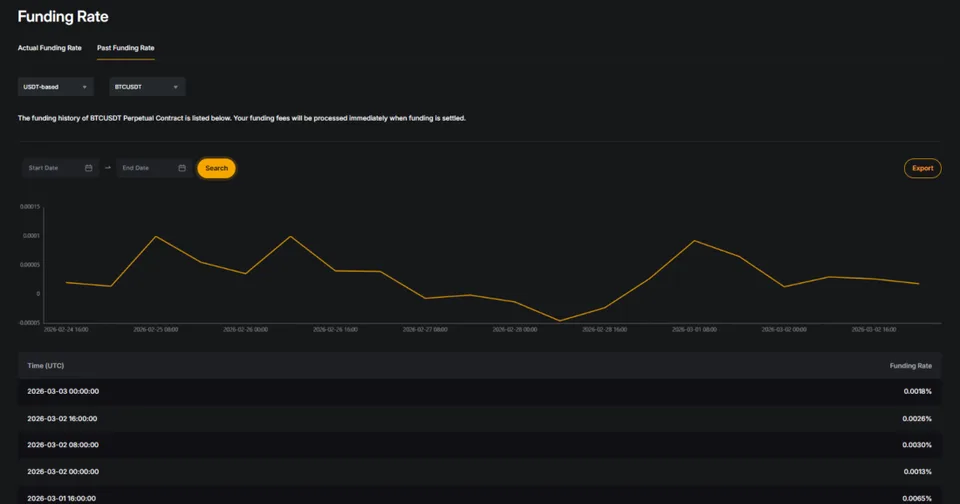
In addition, here you can view the history of funding rates in graphical and tabular form. Data on funding values can be exported to Excel for further analysis.
1. Core Funding Rate (F) formula
F = clamp [ P̄ + clamp(I − P̄, −0,05 %, +0,05 %), Upper Limit, Lower Limit ]
Where:
- P̄ — Average Premium Index (the average premium index for the entire period)
- I — Interest Rate (interest rate)
- clamp(x, a, b) — a function that limits the value of x to the range
- Upper/Lower Limit — dynamic funding limits (cap/floor)
This formula is applied every minute and published in real time on the trading page. The final rate is fixed precisely at the settlement (payout) moment.
2. Interest Rate (I) — fixed component
I = 0,03 % / (24 / Funding Interval in hours)
- With the standard 8-hour interval → I = 0,01% per period.
- For most USDT pairs (BTCUSDT, ETHUSDT, etc.) — 0,03% per day.
- For some pairs (USDCUSDT, ETHBTCUSDT, etc.) — I = 0%.
- For USDT pairs, a value of 0,06% per day (0,02% per 8 h) is sometimes used — check the contract page.
I is the "base cost of carry" that always tends to keep funding close to zero in a balanced market.
3. Premium Index (P) — market premium/discount
Formula (calculated every minute):
P = / Index Price
Components:
- Index Price — Bybit spot index (the weighted average price from Binance Spot, Coinbase, Kraken, Huobi, etc.).
- Impact Bid Price — the average execution price of a large buy order with volume = Impact Margin Notional (IMN) on the bid side of the order book.
- Impact Ask Price — the same on the ask side.
- Impact Margin Notional (IMN) — a fixed volume in USDT that depends on the pair (for example, 30 000 USDT for BTCUSDT/ETHUSDT, 22 500 USDT for XRPUSDT, 15 000 USDT for BNBUSDT). This makes it possible to account for order book depth.
P shows how much above or below spot the futures is trading, taking liquidity into account.
4. Average Premium Index (P̄) — weighted average (TWAP with increasing weights)
Bybit's most important feature is not a simple average, but a Time-Weighted Average with linearly increasing coefficients closer to the payout moment.
For an 8-hour interval (480 minutes):
P̄ = (P₁×1 + P₂×2 + … + P₄₈₀×480) / (1 + 2 + … + 480)
Where P₁ is the value in the first minute of the period, and P₄₈₀ in the last minute (the largest weight).
The sum of the weights = 480×481/2 = 115 440.
This makes the rate very sensitive to the final hours before payout — sharp price movements at the end of the period strongly affect funding.
5. Double clamp and final limits
- Inner clamp: clamp(I − P̄, −0,05 %, +0,05 %) → if |I − P̄| ≤ 0,05 %, then the second term = I − P̄; otherwise it is rounded to ±0,05 %. When the premium is small, F ≈ I.
- Outer clamp: Upper Limit = min( (IMR − MMR) × 0,75 , MMR )Lower Limit = −Upper Limit IMR — Initial Margin Rate (at maximum leverage) MMR — Maintenance Margin Rate (the lowest risk tier) The coefficient 0,75 may temporarily change to 0,5–1,0 when spot/futures divergence is strong.
Examples of limits as of March 2, 2026, 08:00 UTC:
- BTCUSDT: ±0,5 %
- ETHUSDT: ±0,5 %
- SOLUSDT: ±0,5 %
- DOGEUSDT: ±0,58 %
- BNBUSDT: ±1 %.
6. Calculating the Funding Fee on Bybit
Funding Fee = Position Value × Funding Rate
Positive F → longs pay shorts. Negative F → shorts pay longs.
Position Value depends on the contract type:
| Contract Type | Position Value Formula | Example (10 BTC position, Mark Price 95 000) | Fee at F = +0,01 % |
|---|---|---|---|
| USDT Perpetual | Qty of contracts × Mark Price (in USDT) | 10 × 95 000 = 950 000 USDT | 95 USDT |
| Inverse (BTCUSD) | Qty of contracts ÷ Mark Price (in BTC) | 10 000 contracts ÷ 95 000 ≈ 0,1053 BTC | 0,00001053 BTC |
| USDC Perpetual | Qty × Mark Price (in USDC) | 10 × 95 000 = 950 000 USDC | 95 USDC |
Leverage does not affect the size of the funding fee - it is always calculated from the full notional value of the position.
Using Funding in Trading Strategies
In 2026, funding remains one of the most important indicators of market sentiment.
As a reliable intraday / intraweek sentiment indicator, it works better on altcoins of medium and high capitalization, whereas in the top coins (BTC / ETH) small reversals are not always visible.
Funding works best as a predictive tool in the balance phase: near the upper boundaries it turns positive, near the lower ones negative. Values above +0,03% and below -0,03% may indicate a trend reversal within the balance.
Sell signal (short): If the funding rate has reached substantial values (for example, above 0,01% per 8 hours for SOL), and the price continues to rise but looks overheated, this is a signal to look at shorts. The high funding cost will sooner or later force the "weak hands" to close longs, pushing the price down.
Buy signal (long): A prolonged period of deeply negative funding (for example, below -0,01% per 8 hours for SOL) against a backdrop of price consolidation may be a signal to build a long position in anticipation of a bounce.
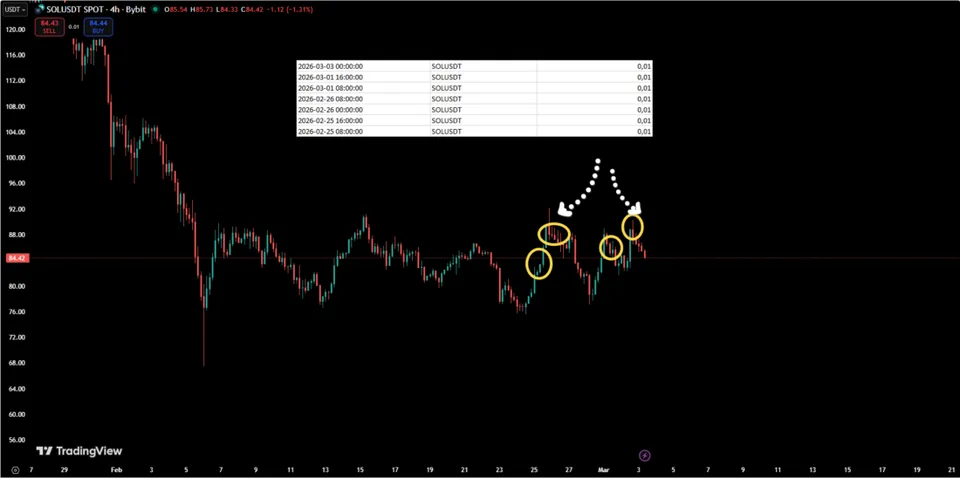
In the image below, the funding values are 0,01 for SOL at the balance extreme.
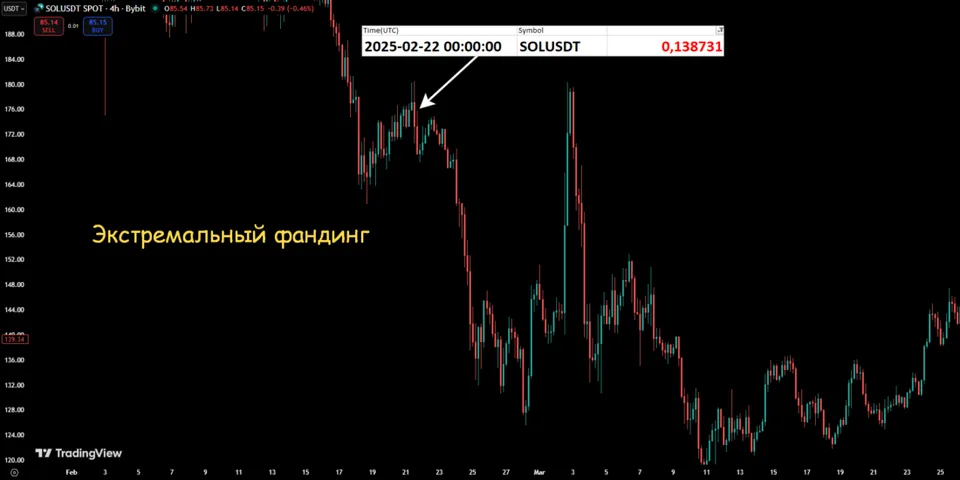
Extreme values (above +0,1% or below –0,1% over an 8-hour period) often precede the end of a correction in the impulse phase.
In the example below, an extreme funding value is marked at the end of a short-term correction: funding of 0,13% before a 25% collapse.
In the impulse phase, extreme funding values indicate a temporary pause, but not a change in trend.
In the example below, the maximum negative funding values are marked at the lows, after which this area becomes support for some time.
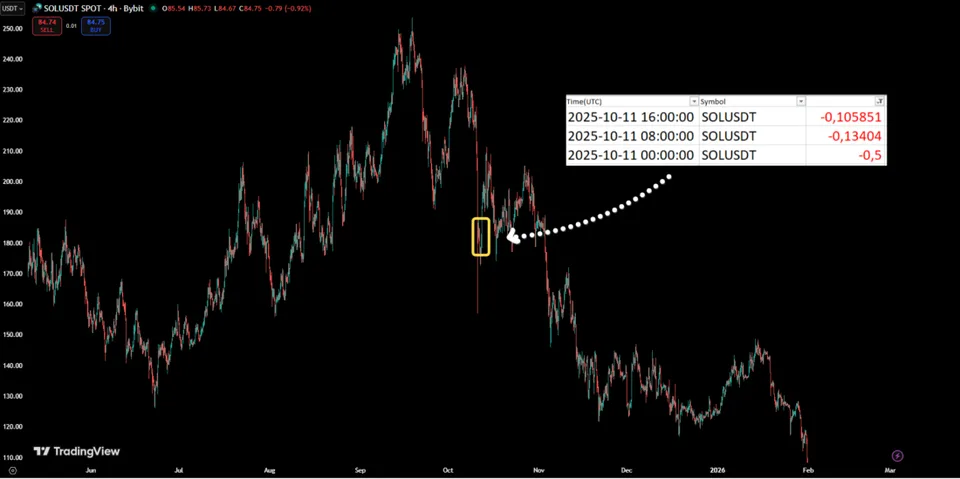
It is worth noting that extreme funding values in the impulse phase may occur during a downward quote breakout. The example below shows extremely negative funding at the moment of a downward quote breakout.
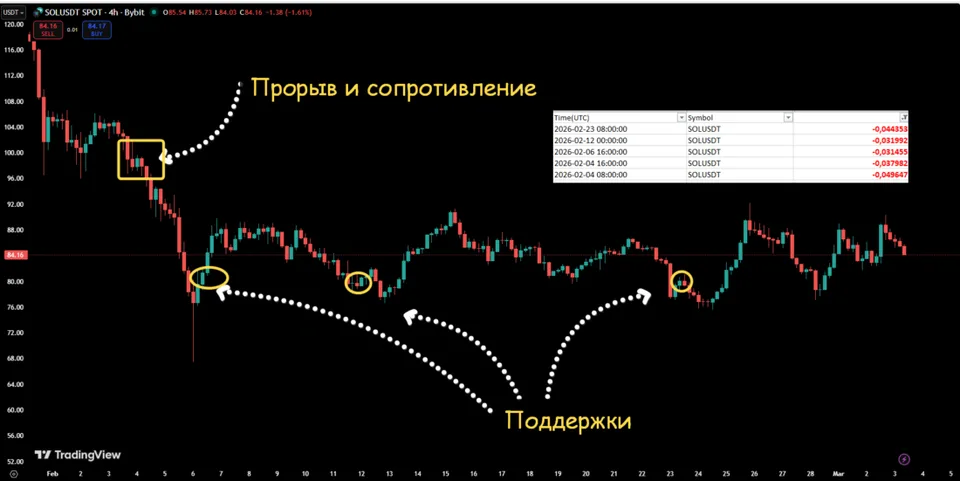
Therefore, funding analysis should be carried out together with other types of analysis.
Instead of a Conclusion
It is important to remember that the funding fee is charged against the available balance, not the position margin. If there are not enough funds in the balance to pay the funding fee, the exchange may forcibly close the position.
At high leverage (×50–×100), even a modest rate of 0,001% turns into serious daily expenses/income: for example, with $1000 of your own funds, $900 as collateral, and ×100 leverage. In this case, $90 will be deducted from the free $100 by the end of the day.