
CVD Indicator: Simple Logic and Strong Results

The CVD indicator is a modern technical analysis tool that has gained wide popularity in recent years, especially among participants in the cryptocurrency market.
Imagine a situation: the price is confidently rising, breaking local highs. At first glance, the trend is strong. But how can you tell whether this growth is really caused by aggressive buying from large players? It is precisely to answer this question that the CVD indicator (Cumulative Volume Delta, or cumulative volume delta) was developed.
Unlike classic volume indicators such as On-Balance Volume (OBV), which draw conclusions about trend strength based only on the direction of the candle close, CVD goes much further. It analyzes not just the amount of the asset sold or bought, but who exactly took the initiative: aggressive buyers willing to pay more, or aggressive sellers seeking to get rid of the asset at any price.
This material is for informational purposes, cannot and should not be regarded as a consultation or advice.
What the CVD indicator is and how it is calculated
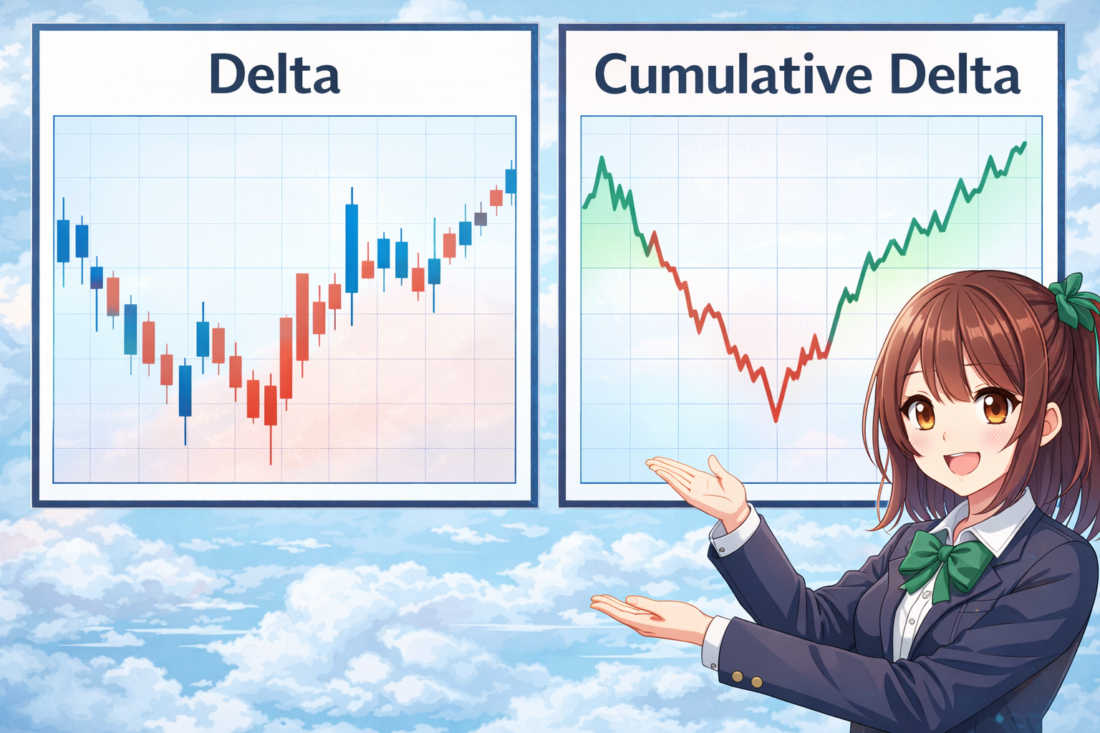
What delta is and how to calculate it
The basic logic of CVD is simple. First delta is calculated, and then the deltas are summed over the period.
Delta is the difference between the volume of aggressive market buys and aggressive market sells over a certain period of time (for example, one minute, 5 minutes, or one hour). Put simply, it is the "net" volume that reflects the pressure of buyers or sellers.
There are three types of delta:
- The first delta is exchange delta (aggressor). The values of exchange delta are broadcast by the exchange: it provides the initiator (aggressor) data for each trade.
- The second is tick-direction delta (tick direct). Delta is marked by the direction of the tick and then the bar: if the price goes higher, such trades are marked as buys, if lower, as shorts. Volumes here are real, i.e. exchange-traded.
- The third is synthetic. In this case, tick volumes are summed and the open-close direction is determined on a lower TF, after which the volume and delta value are built on the working TF depending on open-close, and then the cumulative delta is calculated.
If buyer activity is stronger, delta is positive; if selling is stronger, delta is negative. Then these values accumulate from bar to bar within the chosen period, and this is how the CVD line or histogram is formed.
On each tick or bar, delta is calculated simply:
Delta = Aggressive Buy Volume − Aggressive Sell Volume.
- Buy Volume means trades executed at the Ask price or higher (aggressive buyers "hit" the asks).
- Sell Volume means trades at the Bid price or lower (aggressive sellers "hit" the bids).
CVD is the cumulative sum of all deltas over the selected period (session, day, last N bars). Formula:
CVD (current) = CVD (previous) + Current Delta.
NinjaTrader describes Cumulative Delta as a running result that shows who controlled the market and how strongly. Thanks to this approach, CVD turns into a line that clearly demonstrates the balance of forces in the market. TradingView clarifies in its documentation that CVD sums the results by bar and resets the accumulation at the start of a new period.
It is important to understand: the absolute CVD reading (for example, "+1500" or "-200") often does not matter. Traders analyze not the numbers, but the slope and direction of the CVD line, as well as its relationship with price.
CVD works best as a contextual tool rather than as a standalone indicator.
CME Group especially emphasizes in its educational materials the importance of market orders, the best bid/best offer, and the degree of trade fills in liquid markets; it is in such markets that the flow of aggressive trades is read more meaningfully. If the market is wide, choppy, or volume data is incomplete, the interpretation of exchange CVD becomes less reliable.
How CVD differs from ordinary volume
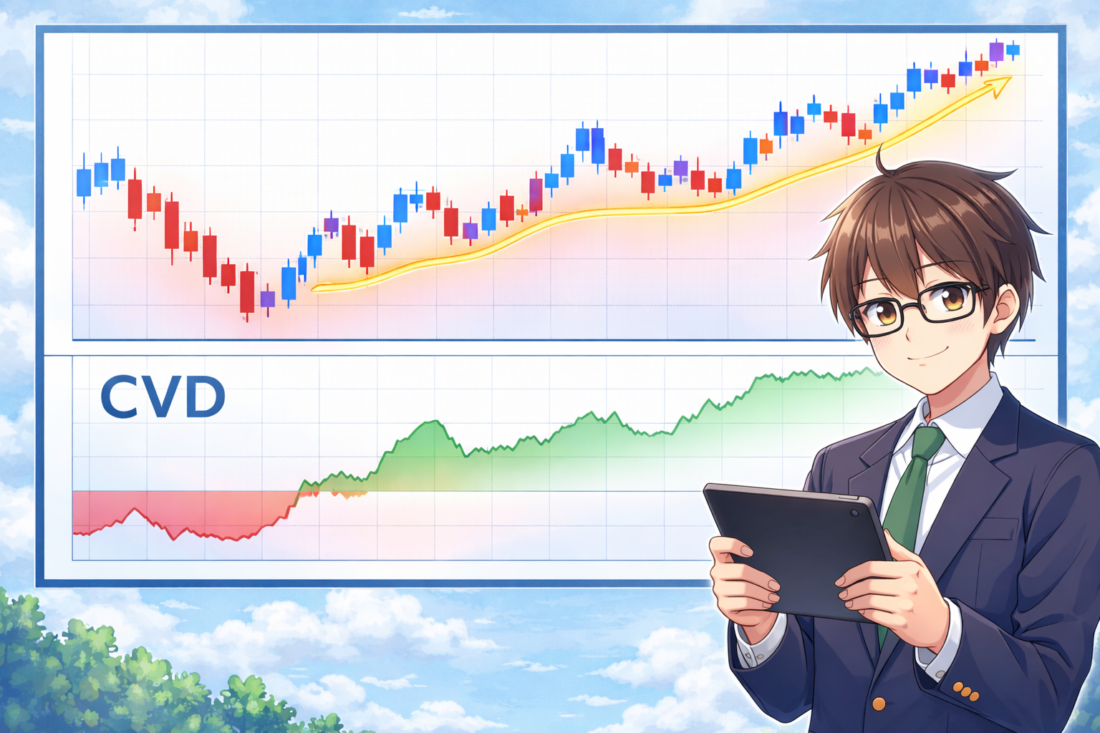
Ordinary volume answers only the question of "how much was traded." CVD shows which side was more active.
The difference between Volume Delta and Cumulative Volume Delta is that the first indicator shows delta for an individual bar, while the second accumulates it over time. Consequently, two moves with the same volume may have completely different meanings if in one case buyers dominated consistently, while in the other sellers kept pressing to the end.
That is why CVD is especially useful when assessing order flow. NinjaTrader notes that Cumulative Delta helps determine market direction, trend strength, as well as support and resistance levels. Bookmap, in turn, writes that traders often look for early signs of reversal in divergences between CVD and price. In other words, CVD is useful not as an "entry signal," but as a way to understand how much the price move is confirmed by a real aggressive flow of trades.
By the way, daily delta is precisely the cumulative delta of the selected timeframes (for example, hourly ones).
Interpreting CVD: reading the language of smart money
CVD offers several levels of analysis, from simple trend confirmation to the detection of hidden reversals.
Trend Confirmation
The most basic way to use CVD is to check the "health" of the current trend:
- Healthy bullish trend. Price is rising, and the CVD line / histogram is moving upward in sync. This means the price rise is supported by real aggressive demand. Buyers are willing to overpay, and the trend will most likely continue.
- Healthy bearish trend. Price is falling, and the CVD line is moving downward in sync. This indicates the dominance of aggressive sellers (panic selling), which confirms the strength of the downward move.
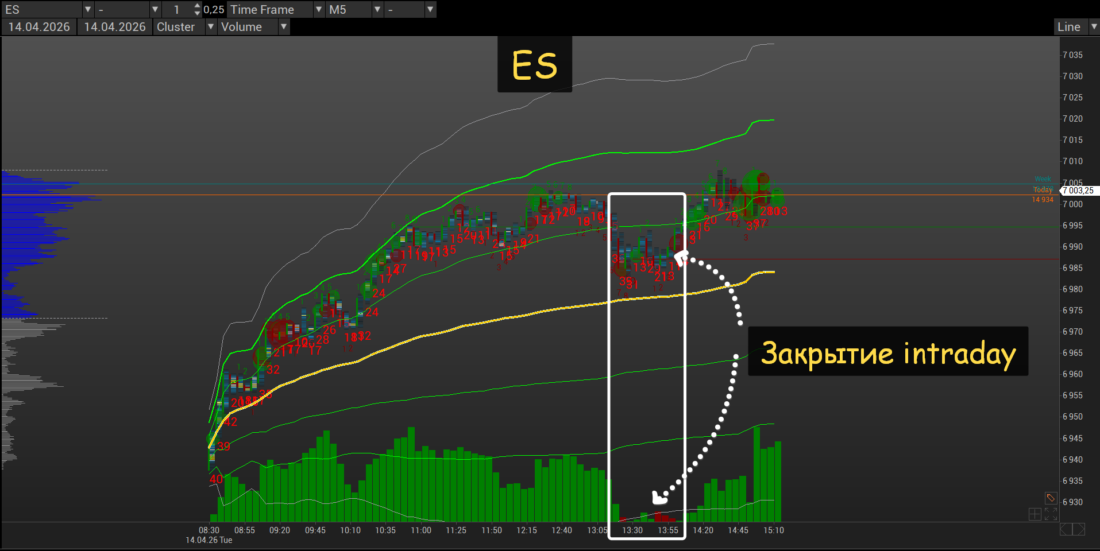
In professional sources, CVD is viewed specifically as a trend-confirmation tool: if price rises against a rising CVD and falls against a declining CVD, the move looks more "healthy." CVD is also useful because it helps distinguish an ordinary pullback from a change in trend.
That is why NinjaTrader directly links cumulative delta with assessing trend direction and strength.
Trend Weakness
If the synchronicity between price and CVD is broken, this is the first warning signal.
- Price is rising, while CVD is flat or declining. This indicates that the rise is most likely caused not by aggressive buying, but by the temporary absence of large sellers (passive behavior). Such growth is unreliable and may end quickly.
By the way, in currencies, especially EURUSD, cumulative delta often has the opposite direction: during growth, cumulative delta is directed to the negative side (sellers are working in the market), and during a decline it turns green.
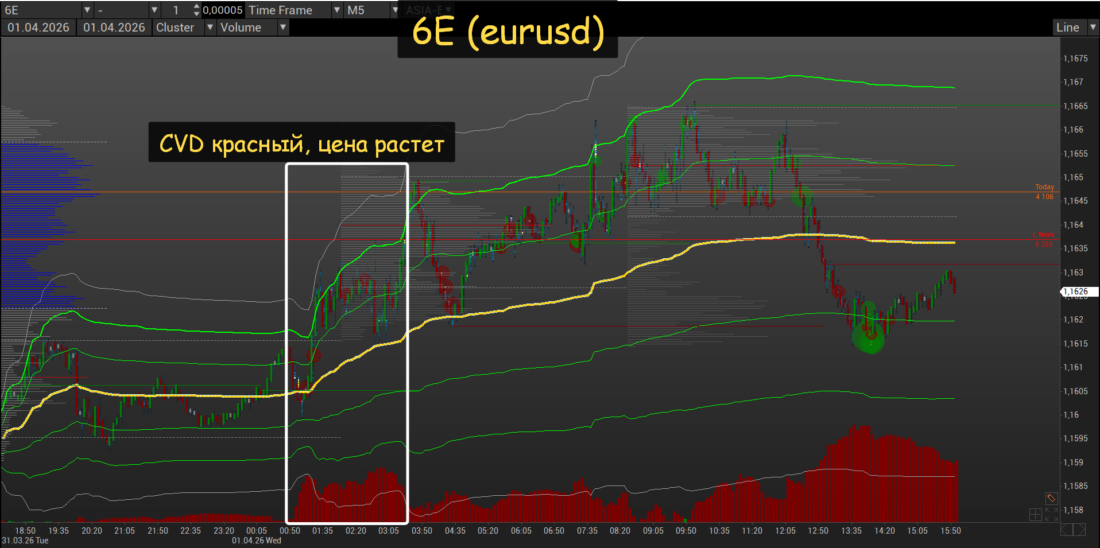
The first reason is that the DOM is packed to the brim with limits and market participants do not have enough liquidity to push through the book. The second reason is that currencies are usually in a medium-term or long-term balance, which means you can sell as they rise and buy as they fall (this is how grid strategies trade). At the same time, potential losses are usually hedged with options.
Divergences (Divergences) are the most powerful CVD signal
Divergence occurs when the price chart draws a new extreme (a new high or low), but CVD does not confirm it. This indicates exhaustion of the current trend and the market's readiness for a reversal. CVD is considered a "leading" indicator because its signals often appear earlier than similar signals from RSI or MACD.
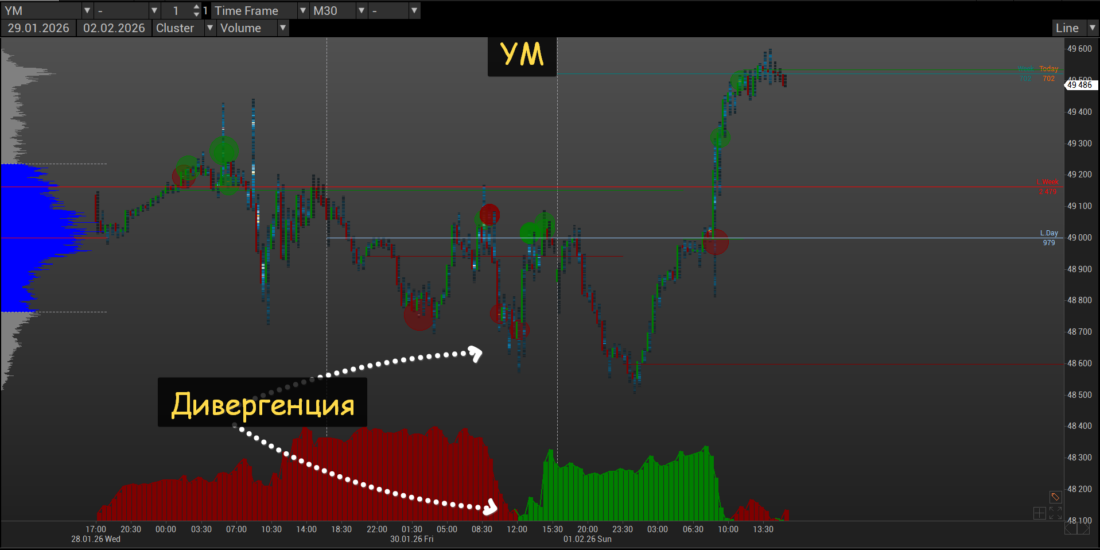
- Bearish Divergence Signal 1: price reaches a new high (Higher High), while CVD forms a lower high (Lower High) or simply cannot renew its previous peak. Signal 2: price does not reach the high, while CVD forms a larger "green" high. Interpretation: aggressive buyers are losing strength and leaving the market. The price rise is not finding support from large capital. This is a powerful harbinger of a reversal downward.
- Bullish Divergence Signal 1: price falls to a new low (Lower Low), while CVD forms a higher low (Higher Low) or remains at the same level. Signal 2: price does not reach a new low, while CVD forms a large "red" high. Interpretation: seller pressure is drying up. Large players ("smart money") begin quietly accumulating the asset, absorbing sales at low prices. This is a signal of possible strong growth.
Strategies for using CVD
Example 1: Trend Following
On January 10, 2026, Bitcoin was trading in a descending channel at the start of the day (M5 chart).
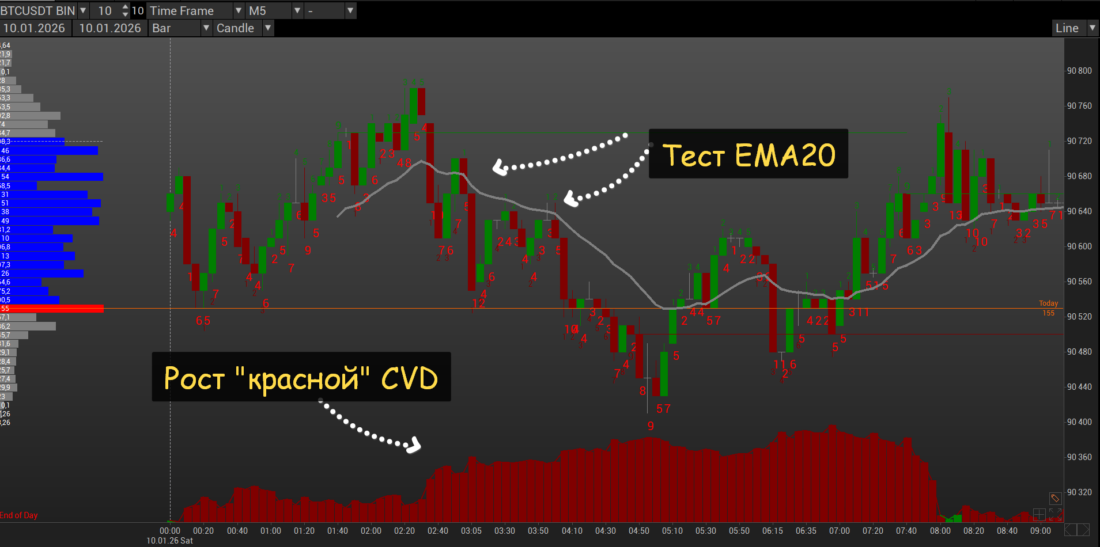
Each time price updated a local low, it was accompanied by a new peak on the CVD indicator. This is a signal to open or hold a short position.
A price correction to the moving average (for example, EMA 20) can be used to add to the position while CVD continues to rise (in our case, the "red" histogram is rising).
Example 2: Breakout Entry
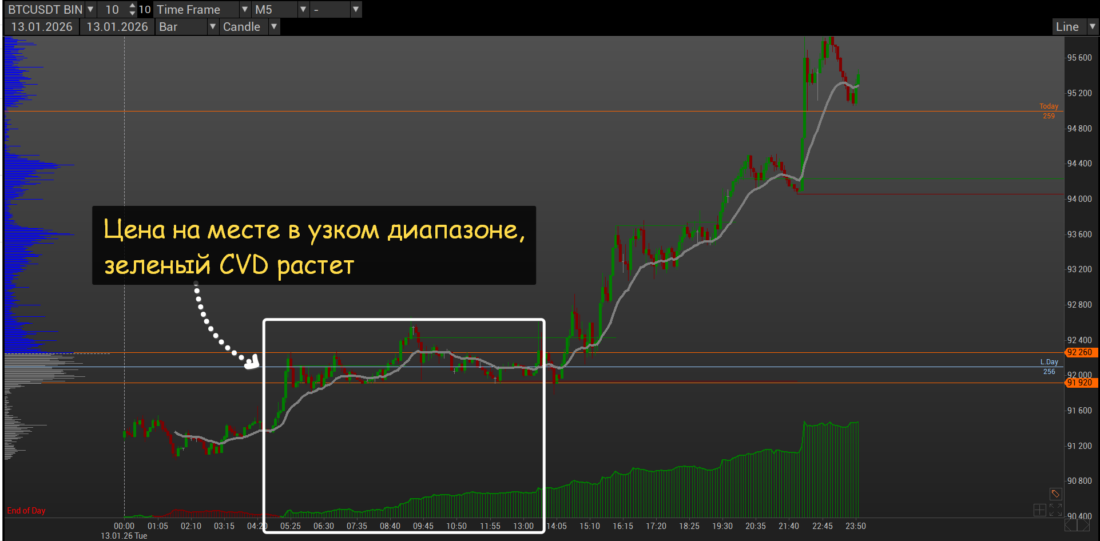
Price consolidates in a narrow range. At the same time, CVD is rising (green histogram), although price is standing still. This indicates hidden accumulation. When the price finally breaks through the lower boundary of the range, it is a powerful signal to enter short, because the breakout is supported by real selling volume.
Example 3: Divergence Exit
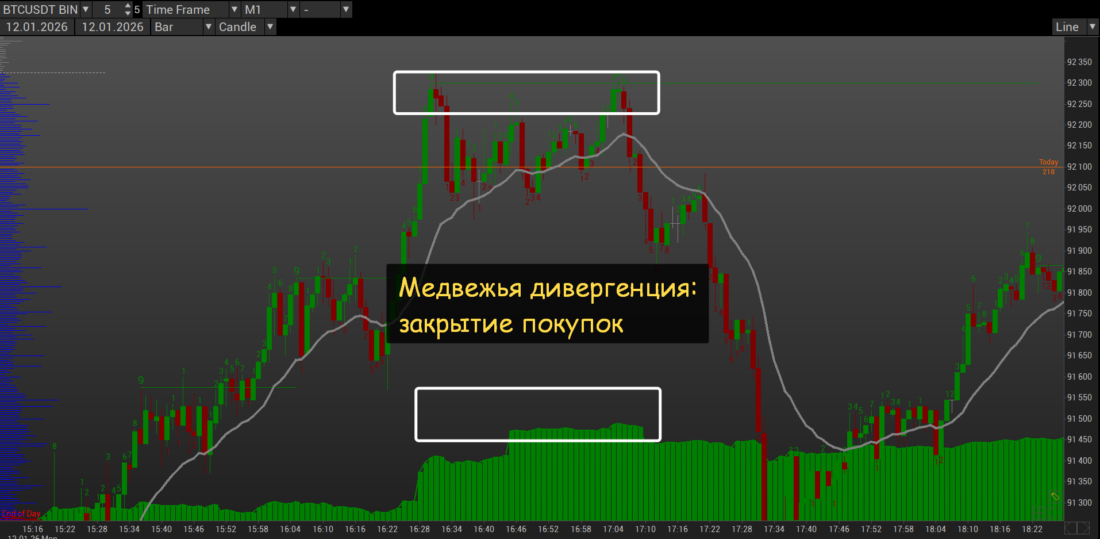
BTC price (Binance) forms a double top. However, CVD at the second top is significantly higher than at the previous price peak. After a sharp move downward in price, a bearish divergence is formed.
This is a weighty reason to take profits or, at the very least, tighten the stop-loss, since the probability of a correction or reversal rises sharply.
The CVD indicator on TradingView
The CVD indicator is widely represented on the Tradingview platform. Thus, searching for CVD lets you find 30 custom indicators, some of which have even made it into the editors' pick selection.
Personally, I did not really like the implementations of this indicator from the editors' pick selection, so I settled on The Cumulative Volume Delta (CVD) Suite, which was developed by QuantAlgo.
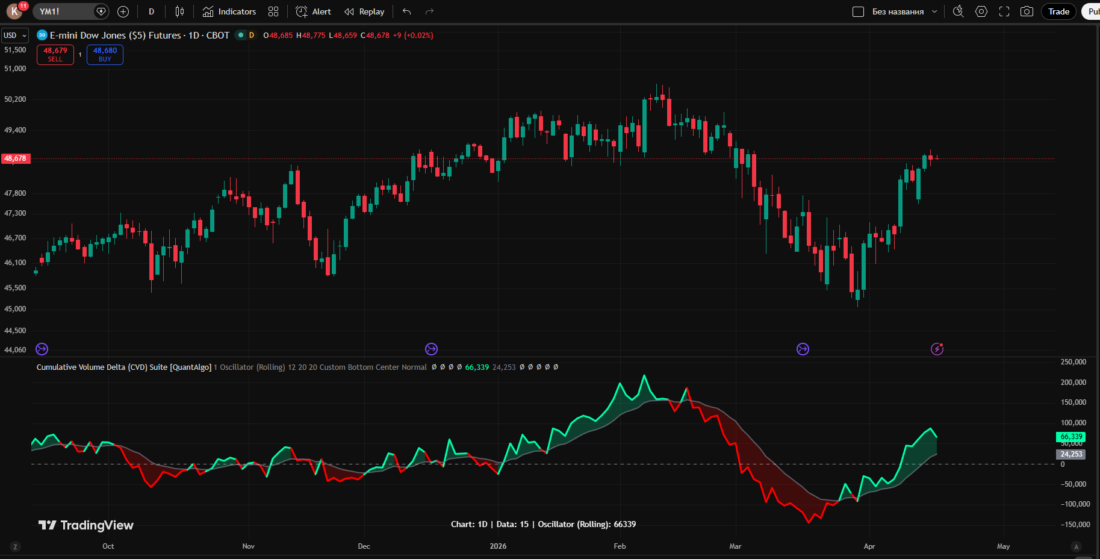
Among the advantages of this indicator, it is worth noting the automatic calculation of the optimal timeframe for calculating synthetic delta. For minute charts, synthetic delta is calculated from second-based data, and for M5, from 5-second values.
After the bar closes on the working timeframe, the following happens: if the close is above the open, then the entire volume is marked as buyers' volume.
The indicator offers five different visualization modes, each intended to display different aspects of the dynamics of volume flows and suitable for different trading strategies and market conditions.
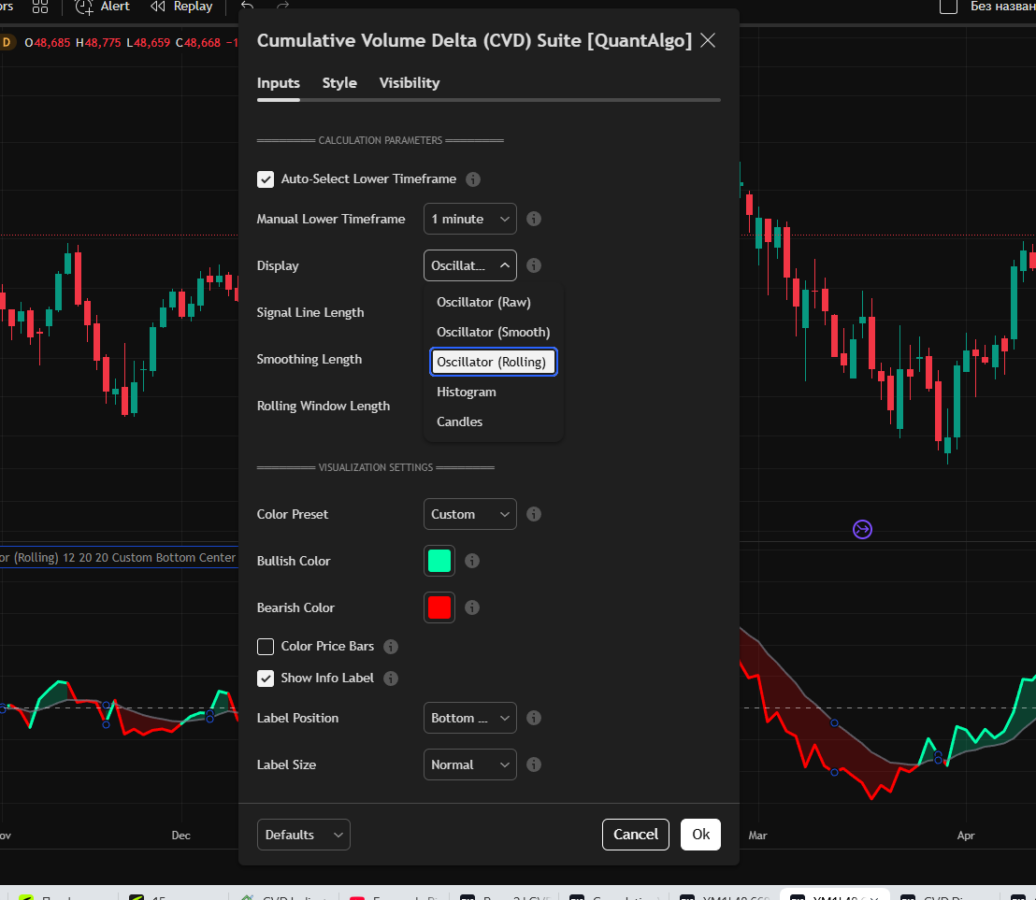
- Oscillator (Raw - unprocessed). Displays cumulative volume from the start of the chart build, as well as an EMA signal line that helps determine trend direction and momentum shifts.
- Oscillator (Smooth - smoothed). Applies a simple moving average to the raw CVD data to filter out noise while preserving the structure of the main trend and making signal-line crossings smoother. Suitable for trending moves.
- (Rolling - rolling). Calculates cumulative delta only for the last N bars (adjustable window length), effectively zeroing the baseline and removing the influence of distant historical data. This approach focuses exclusively on current market dynamics, which makes it possible to react quickly to recent changes in trading volume. It is especially useful in markets where sentiment is shifting.
- Histogram. Displays volume delta for each bar as separate histogram columns rather than as cumulative values, showing the immediate pressure of buyers or sellers that arose during the formation of each specific candle. This mode is excellent for identifying sudden volume spikes and points of exhaustion, when large deltas do not lead to price movement.
- Candles. The indicator transforms CVD data into the format of Japanese candles, where the opening of each candle represents the CVD value at the start of the bar, and subsequent intrabar delta changes create the high, low, and close values. This type of CVD construction helps determine the acceptance or rejection of volume at certain CVD levels, just as candles show the acceptance or rejection of price levels.
Conclusion
The CVD cumulative delta indicator allows you to look behind the "curtain" of the price chart and see the real struggle between buyers and sellers. Whatever type of delta underlies CVD, the indicator works well in different markets and instruments.