
Liquidations in Crypto: What They Are and How to Analyze Them

Every day, crypto traders excitedly discuss how many positions of yet another whale were liquidated on yet another exchange.
Liquidations on crypto exchanges, and on any exchanges trading derivative instruments (futures), are an ordinary matter. For the sake of objectivity, it is worth noting that, in my opinion, liquidation is not only a full stop-out on the account, but also the closing of a trade by a regular stop-loss.
Often, zones where stop-losses accumulate can amazingly coincide with liquidation zones. The reason lies in trader psychology: systematic traders calculate risk and limit losses in a certain zone, while gamblers place stops so that the money will last for some move against them. Usually these stop or stop-out levels coincide.
In this article, we will look at what liquidations are, where to view them on Coinglass, and how to manage risks taking the knowledge gained into account.
What Liquidations on Crypto Exchanges Are in Simple Terms
Liquidation is the forced closure of a margin (leveraged) position by the exchange or clearing house when the trader's margin falls below the maintenance margin level. During liquidation (upon reaching the stop-out level), the collateral is sold to cover the debt on the position.
In the liquidation process, two basic situations can arise: long liquidation, when long positions are closed because the margin call level is reached, and short liquidation, when short positions are closed as the price rises. Exchanges or brokers, if we are talking about forex, usually publish the formula/threshold for calculating the liquidation price (stop-out) and the closing rules (auto-deleveraging/ADL).
Crypto exchanges have a unique capability: they show the levels at which large liquidations of leveraged traders will take place.
What Liquidations Mean
Technically, liquidation levels are a simple forced closure of positions opened using leverage. In this case, the collateral passes from liquidated traders to the market (the broker / exchange / the other side of the trade).
In this sense, liquidation levels serve as a magnet, where it is often interesting for a large participant, who is often the other side of the trade, to pull prices so that money flows from "weak hands" to "strong hands"; this is also called stop hunting. After such an event, a reversal begins and a strong move in the opposite direction follows.
From the market's point of view, large waves of liquidations often amplify price movement (a cascading effect): when many stops and margin calls are triggered in one direction, this creates an additional flow of market orders that pushes the price further.
Such events are described in the news as "billions in liquidations" and are usually accompanied by a sharp spike in volatility.
This was especially clearly visible in the silver futures market, where cascading liquidations crashed the price by almost 50% at the end of January 2026, when in two days nearly 14 thousand futures quoted on CME were liquidated. In fact, there were substantially more of them, since sell openings were clearly taking place at the same time.
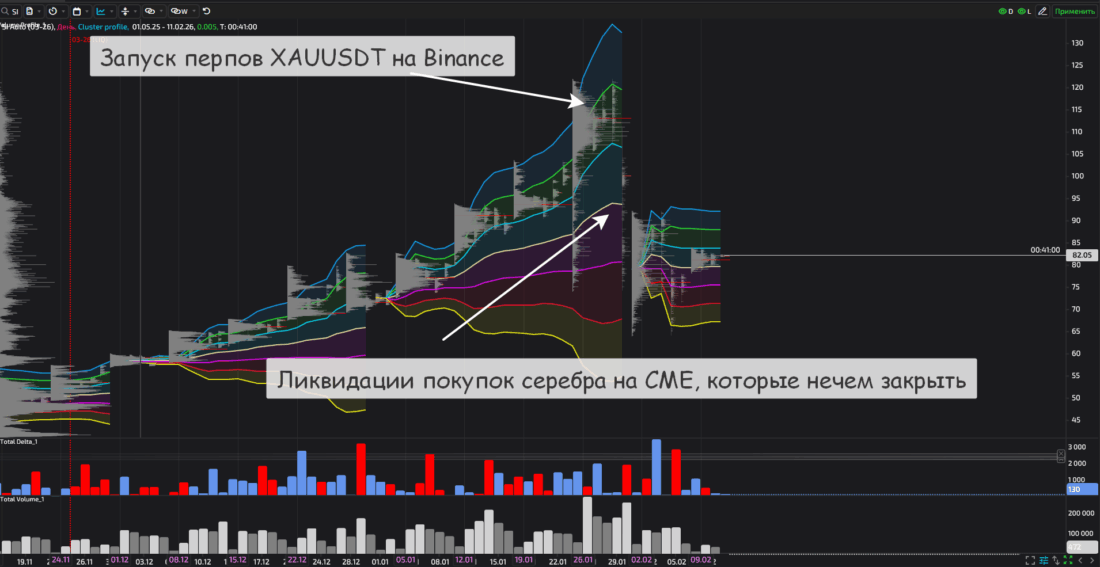
Silver is used as an example here for a reason. At the end of 2025 and the beginning of 2026, a great deal of speculative liquidity flowed here from the crypto market. Also, on the day the liquidations started (the short market), Binance launched XAUUSDT perpetual futures for gold and XAGUSDT for silver, an amusing coincidence.
It is important to remember that a large liquidation is not an indicator of a trend change: it is rather an indicator of the weighted-average leverage level in active positions and of the market vulnerability associated with that leverage.
How the Liquidation Price Is Calculated on the Bybit Exchange
Liquidations on Bybit occur when the mark price (reflecting the spot price on major exchanges in real time) reaches the liquidation mark at the bankruptcy price (0% margin).
The Bybit exchange allows trading in isolated margin mode and in cross margin mode.
The advantage of isolated margin mode lies in isolating the trade collateral from the main account. In fact, this mode makes it possible to limit losses only to the margin, and it can be called a hidden stop-loss.
The formula for calculating the liquidation price in isolated margin mode looks as follows:
Liquidation Price (Long) = Number of Contracts /
Liquidation Price (Short) = Number of Contracts /
To understand the margin calculation formulas, it is necessary to understand the terms included in the formula:
- Position value = Number of contracts / Average entry price
- Initial margin = Position value / Leverage
- Maintenance margin = (Position value × Maintenance margin rate) - Maintenance margin deduction
- The maintenance margin rate depends on the risk limit level
- The fee for closing the position(s) may differ slightly from the actual liquidation price
Example.
The trader buys BTC/USD for 100 000 USD. The entry point is 50 000 USD, leverage is 50x. The maintenance margin rate is 0,5%, there is no additional margin.
In this case:
- position value = 100 000 / 50 000 = 2 BTC;
- initial margin = 2 / 50 = 0,04 BTC;
- maintenance margin = 2 x 0,5% - 0 = 0,01 BTC;
- liquidation price (LP) = 100 000 / = 49 261,08 USD.
The main difference between cross margin mode and isolated margin mode is that the liquidation price may change depending on the available main balance. Liquidation is triggered only when the available balance is insufficient and there is not enough maintenance margin to hold the open position.
The formula for calculating the liquidation price in cross margin mode is as follows:
Liquidation price (long) = Number of contracts /
Liquidation price (short) = Number of contracts /
Example.
All parameters are the same as in the previous example. The only difference is that the trader's entire balance is taken into account.
- balance - 0,5 BTC;
- liquidation price (LP) = 100 000 / = 39 525,69 USD.
Thus, cross margin mode is more flexible, but its use within active trading across different instruments can lead to a sharp change in available liquidity and, consequently, a shift in the liquidation level.
Isolated margin mode is less flexible and is in fact a hidden stop-loss, i.e. from a risk management standpoint it is safer: stops are closer, but position risks are strictly separated.
How to Interpret Liquidation Levels
The key things to watch simultaneously:
Heatmap / liquidation clusters — levels where the lion's share of liquidations is concentrated (for example, "many longs at the 40 000 level"). These are potential areas where, as price moves, one can expect momentum to strengthen if the quote is in an impulse phase, or reverse dynamics may begin after the level is reached (in the balance phase).
Open Interest (OI) — growth in open interest during a one-sided move shows increasing leverage: if OI is very large on the long side and price is falling, the risk of major long liquidations increases. Open interest helps to understand the degree of market overheating.
Order book (depth) and volumes — if there is no good opposing market liquidity at the liquidation level, then triggered liquidations will provide fuel for the continuation of the move.
Background (news / funding rate / volatility) — liquidations are triggered more easily against a negative news background or extreme funding rates.
Why the Market Maker "Pulls" Quotes Toward Liquidation Levels
Market makers/whales need to execute large orders, and this requires opposing liquidity.
Clusters of stops/liquidations turn into a guarantee of execution: a stop-loss / stop-out is specifically a market order at the moment of execution, not a limit order, so price "goes" toward liquidity to allow large orders to be closed without unnecessary slippage at the best price. This is the classic liquidity hunting mechanism ("hunt for liquidity").
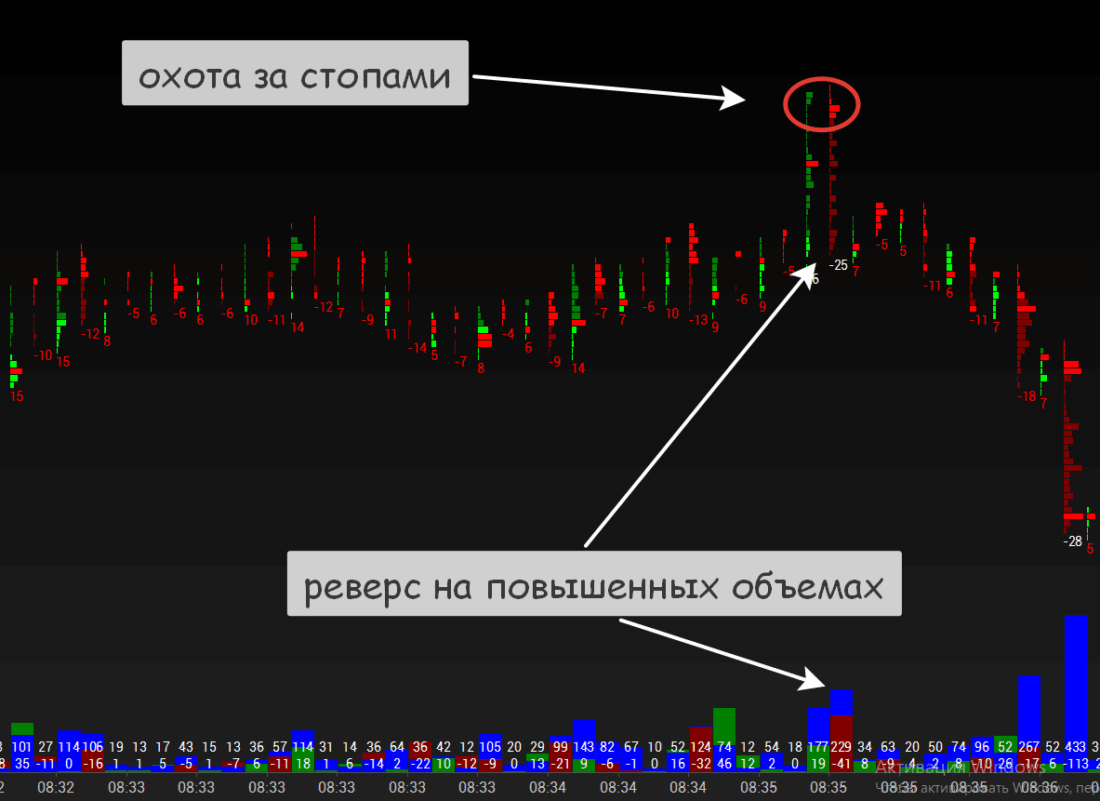
Suppose a cluster of liquidations / stops is located at the 100,000 level. When 100,000 is reached, a large number of market orders appear, which are immediately closed by limits in the opposite direction. After that, a large participant begins moving the price in the desired direction using market orders.
But if there are not enough limits at the level, then the price goes further, to the next level, especially in the absence of large market liquidity for a reversal.
Hedging and rebalancing risk positions. A market maker with large exposure may shift quotes to improve their risk parameters.
Profit from volatility. "Stop hunting" is not necessarily illegal (unlike outright fraud), but it can be considered a break in market structure. A classic story that no one will prove, but that always takes place. Before a run on stops, a very large market order appears that eats all the liquidity in the order book. This makes it possible to sharply pull the price toward clusters of stops, collect those stops, and move in the desired direction.
Where to Look for Liquidation Levels
The most popular place to look at liquidation levels is Coinglass. Here you can see the total liquidation volume, the "liquidation heatmap," and time series, which is very convenient for a quick overview and for checking whether there is a heatmap for crypto pairs. That is why Coinglass serves as a reliable liquidation tracker for many traders.
In turn, crypto exchanges (Bybit, OKX, etc.) themselves provide the liquidation price calculation for each open position and often publish real-time liquidation feeds.
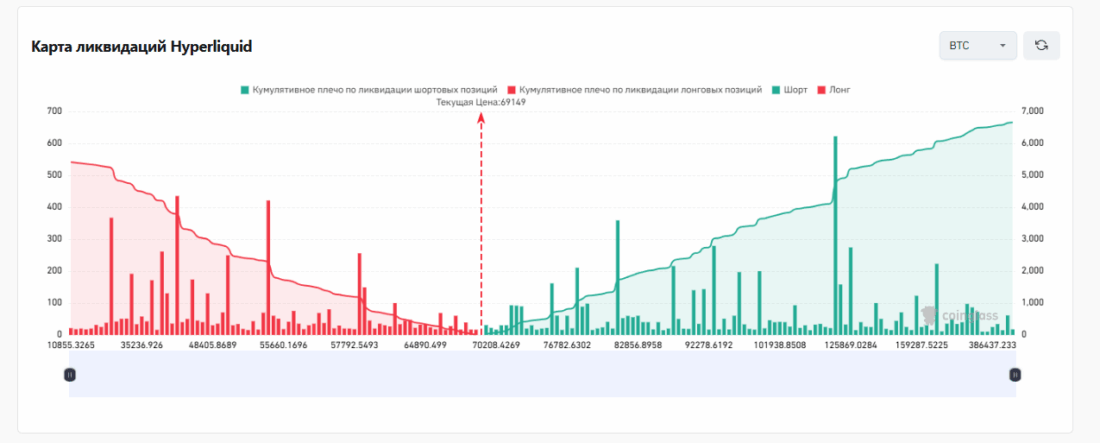
We should also definitely mention Hyperliquid, which is a powerful decentralized cryptocurrency platform in the Perp DEX category and a blockchain network of the same name. It was launched in 2024 and supports high leverage.
It is also worth mentioning the TradingView platform, where you can track liquidation levels using convenient indicators.
Coinglass Liquidation Indicators
On the main Coinglass page dedicated to liquidations, you can find the following information.
The first indicator block, "Liquidation Heatmap," shows the volume of liquidations across different instruments over the past 1 hour / 4 hours / 12 hours / 24 hours.
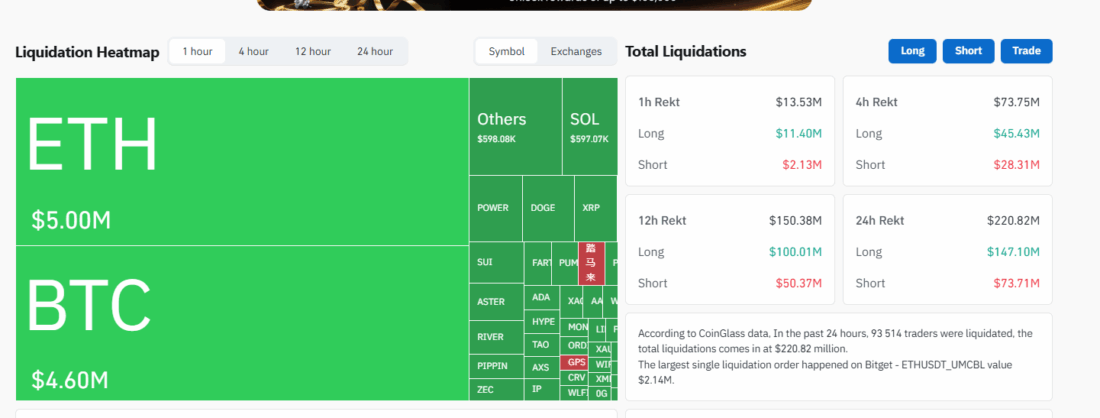
You can also select a liquidation report across various exchanges:
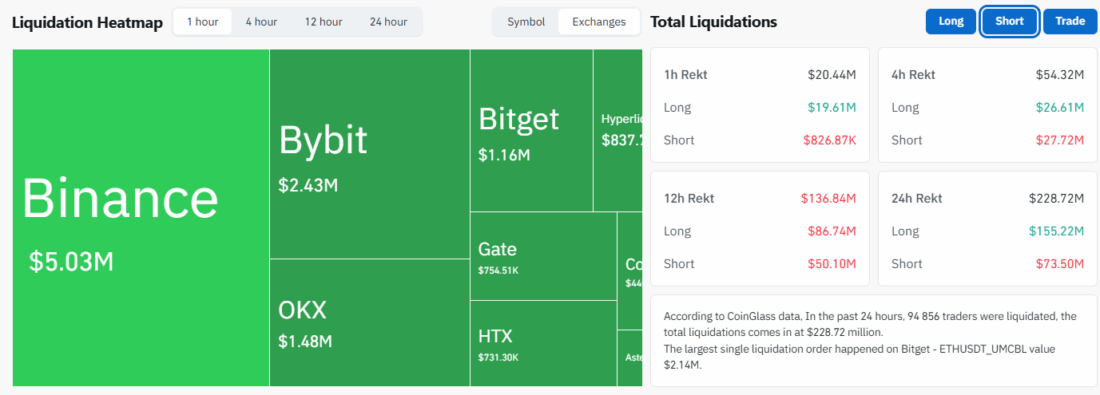
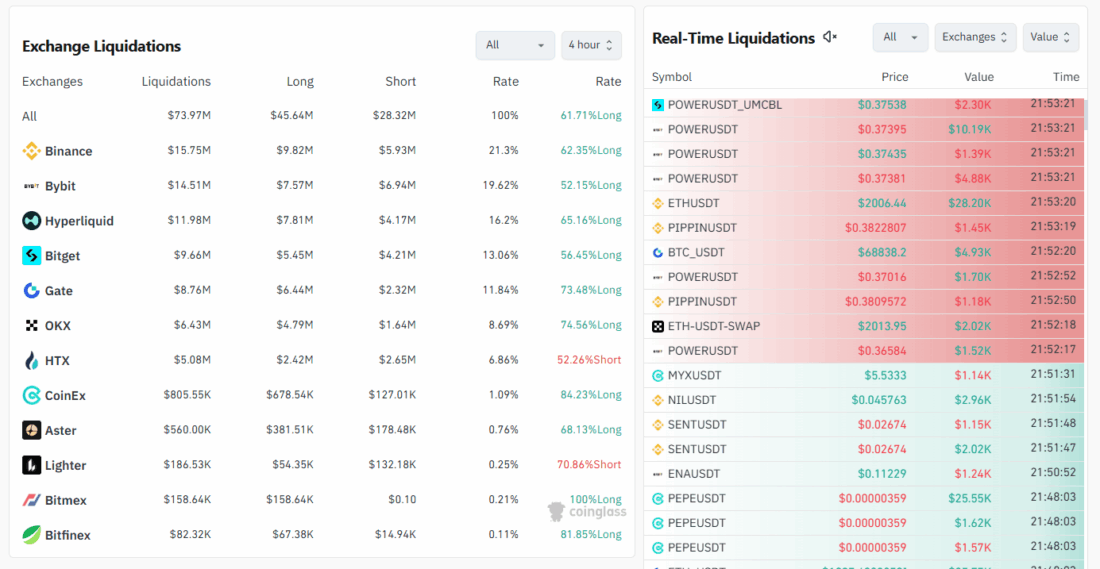
The block on the left shows liquidation statistics. Each block indicates the time period (1 / 4 / 12 / 24 hours), the total liquidation volume, as well as long and short liquidations separately.
The next block on the left presents liquidation information broken down by each exchange. On the left there is real-time information about liquidations of open trades: the instruments, prices, time, and volume are indicated. You can choose individual instruments, exchanges, and liquidation volume.
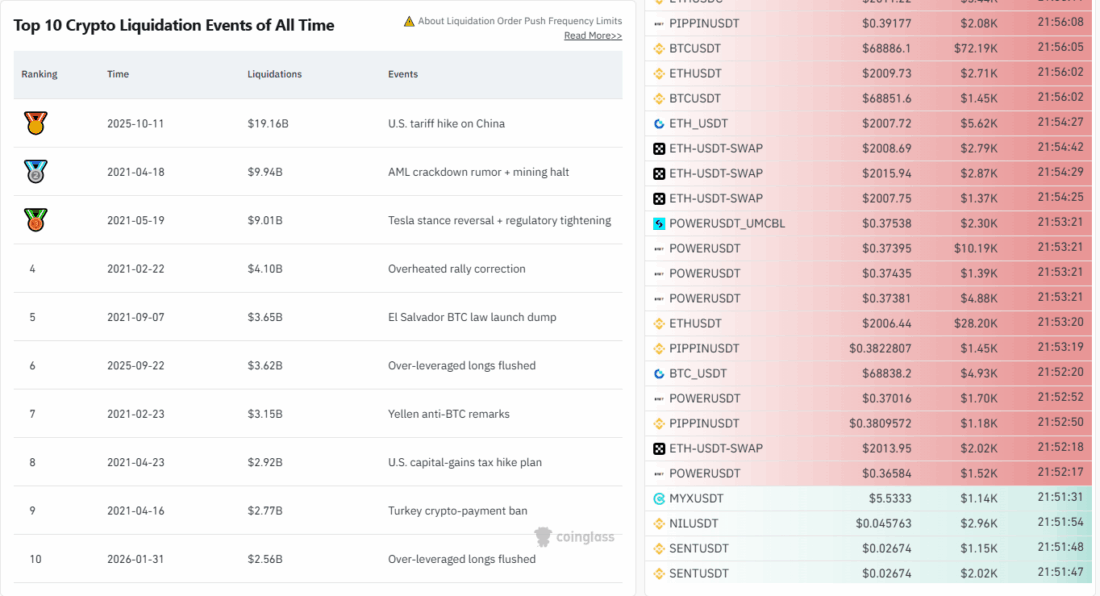
The next block is of a general informational nature and shows the top 10 liquidations of all time:
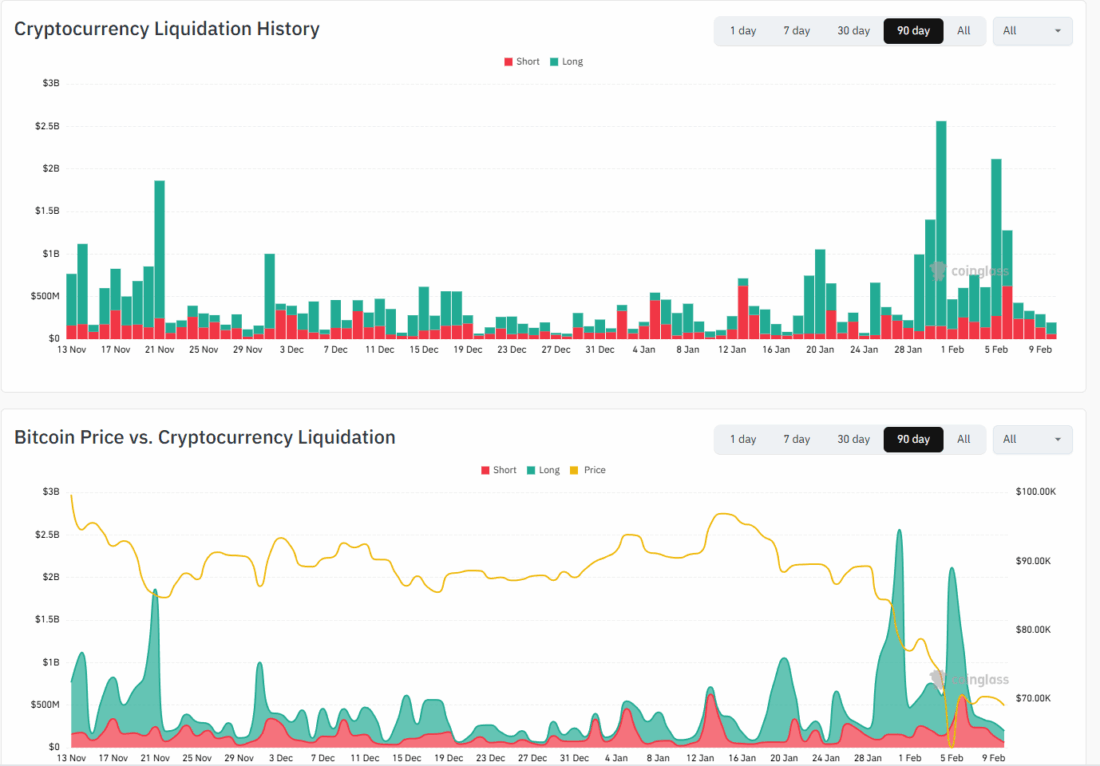
The next two blocks show the history of crypto futures liquidations, as well as the relationship between the price of Bitcoin and crypto liquidations. You can choose a period (1 / 7 / 30 / 90 days / all time) and an instrument (there are very, very many of them).
The last informational block contains data on which instrument had the most trades liquidated over the past hour.
The very last block presents a liquidation table for various cryptocurrencies. You can sort by the price change in % over 24 hours, as well as by long / short liquidations over 1 / 4 / 12 / 24 hours.
This toolkit makes it possible to quickly find instruments where active liquidations are taking place and to look at the market structure in order to assess entry opportunities.
Note that the liquidations page on Hyperliquid is a slightly less informative copy of this page on Coinglass.
Liquidation Levels Page (Liquidation Levels)
The Liquidation Levels page presents information about estimated liquidation price levels.
Liquidation levels are statistical estimates based on historical data and real-time data provided by some crypto exchanges.
You can select the instrument, time, leverage level (high / medium / low), and adjust the visualization using the Line and Bubble sliders.
Liquidation levels are aggregated from data from various exchanges.
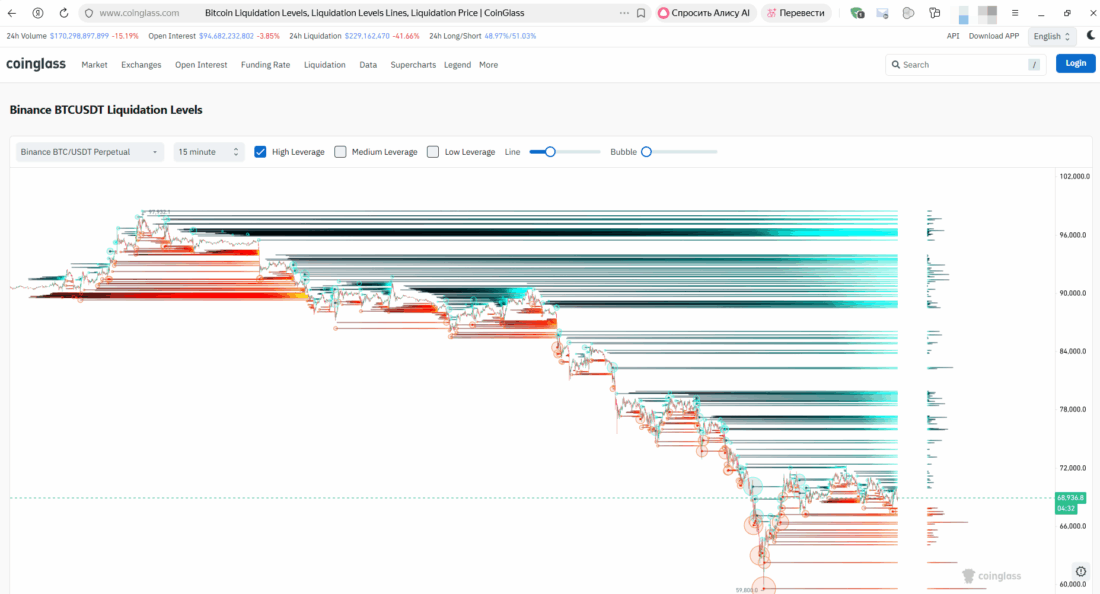
In my opinion, this information is more convenient to view on TradingView: the visualization is better there.
Liquidation Map Page (liquidation map)
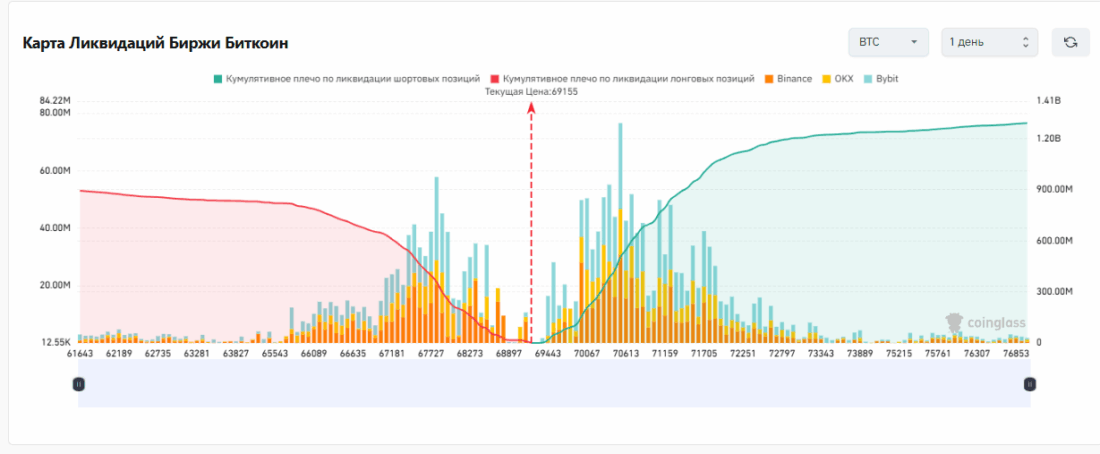
Various combinations of leverage and time frames form liquidation clusters. The density of the clusters can influence price movement when a level is reached.
On the Liquidation Map page, you can find an excellent liquidation map of positions on the BTC/USDT perp across various exchanges for 1 / 30 / 90 / 180 days and for a year.
The chart shows estimated information about the cumulative (total) liquidation leverage of shorts or longs (the curve), and also shows the liquidation distributions of 10x / 25x / 50x / 100x leverage (vertical bars). In addition, the map displays the current BTC price.
Note the presence of a slider under the chart, which when scrolled makes it possible to move liquidation levels closer to or farther from the current price, allowing you to assess the situation at the moment.
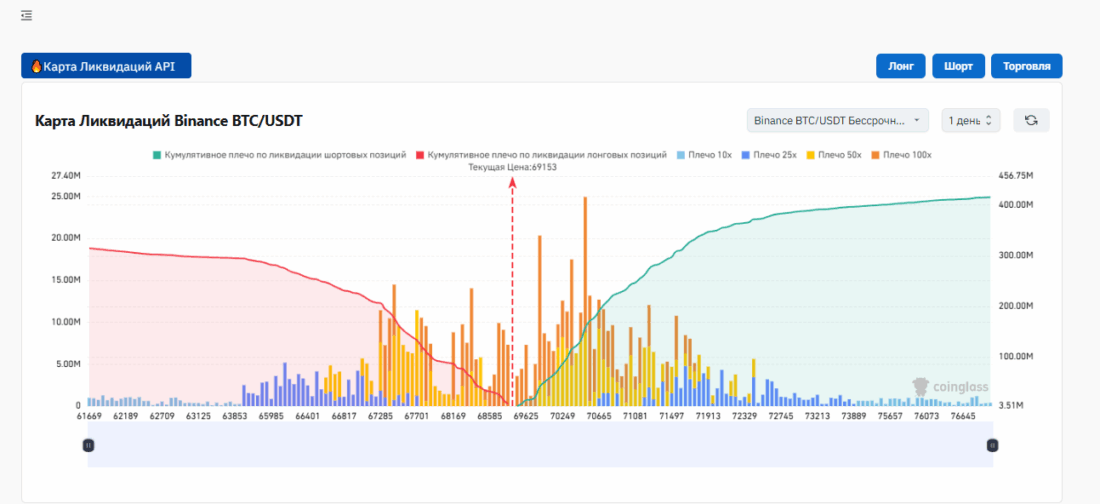
The next chart, the “Exchanges” liquidation map, is a complete analogue of the previous one. The difference is that you can select the instrument, but you cannot select the exchange at the same time.
The last chart on this page is a liquidation map on the decentralized Hyperliquid platform:
Liquidation HeatMap Page (liquidation map)
This liquidation heat map is quite informative. You can see liquidation levels on the BTC chart across different exchanges if “Pair” is selected (top left). If “Symbol” is selected, then you can choose a pair to build the liquidation heat map.
On the heat map, you can disable the display of the liquidation level (leverage) and the price chart. You can also enable the liquidation map (on the right), but only when the “Pair” chart is selected.
The “Liquidity Threshold” slider is designed to highlight the most important liquidity clusters for estimated liquidation.
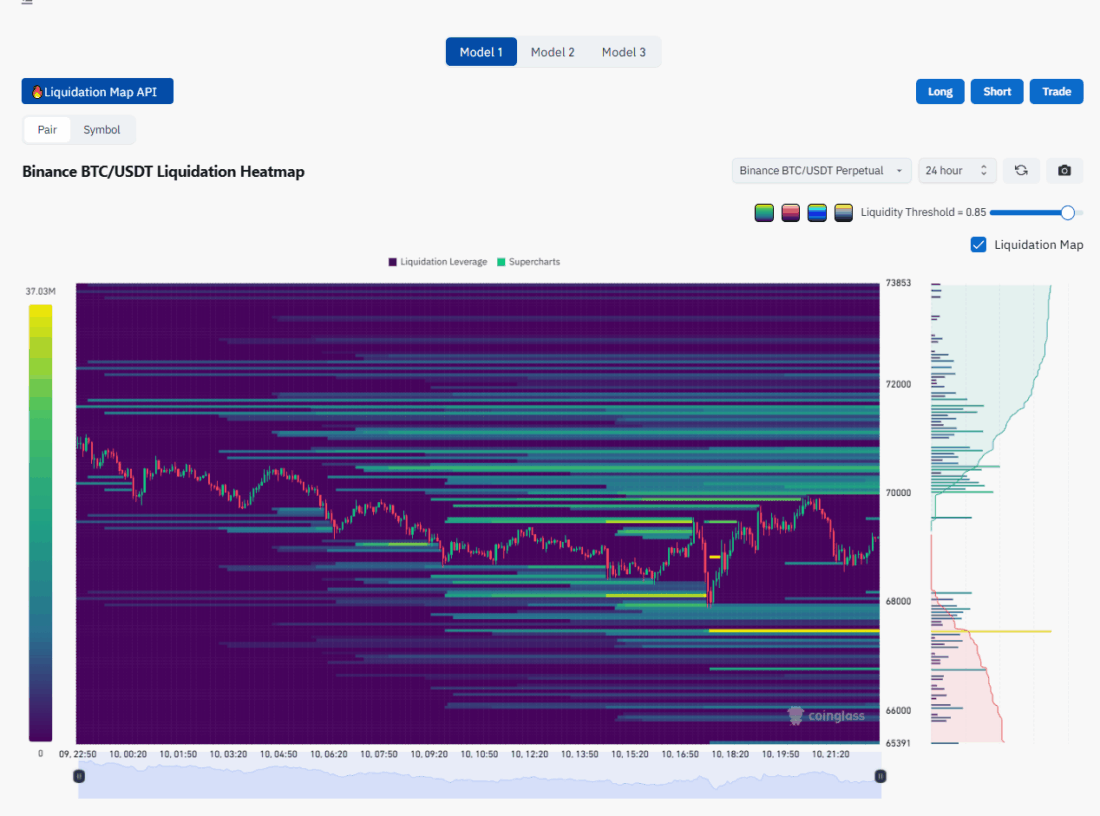
At the top of the page, you can choose the model type (1 / 2 / 3). The difference is in the visualization of the liquidation heat map. In addition, enabling the cluster liquidation map is possible only in model 1.
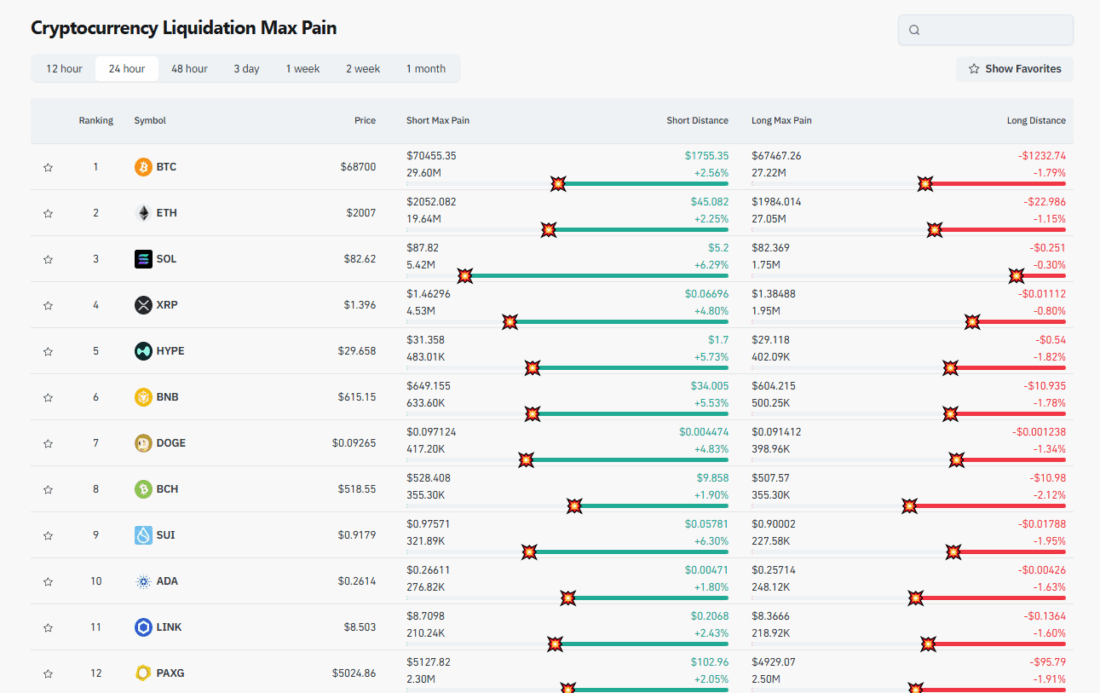
Cryptocurrency Liquidation Max Pain Page (cryptocurrency liquidations max loss price)
This page makes it possible to compare the current price with the max pain price of buy and sell liquidations. You can also see the distance the quote needs to travel to the strongest liquidation level, where the greatest number of players will be left without money.
TradingView Indicators
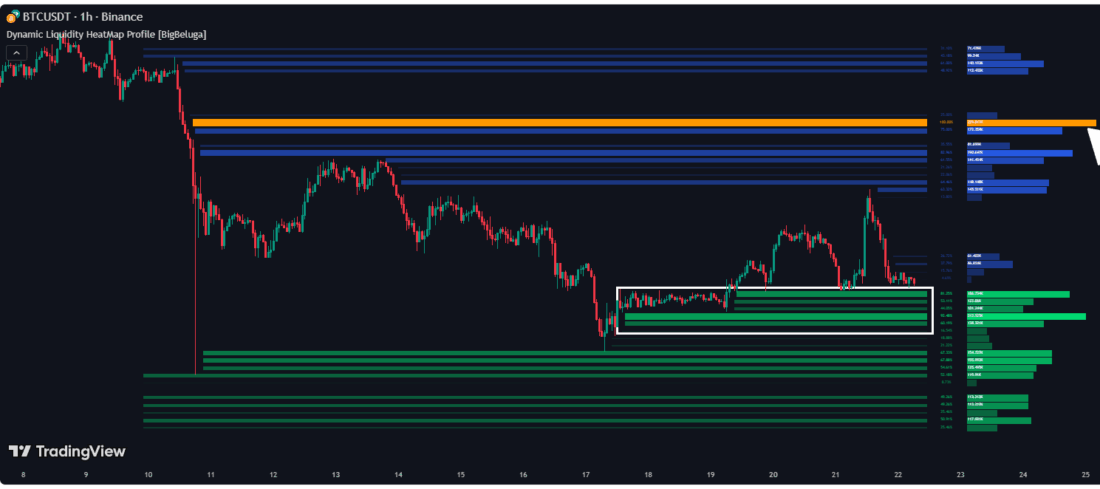
On the TradingView platform you can find a large number of liquidation indicators that in one form or another duplicate liquidation charts (cluster or heatmap charts).
For example, the Dynamic Liquidity HeatMap Profile indicator by BigBeluga builds similar cluster charts. True, it takes the information not from exchanges, but on the basis of traders' likely behavior.
In turn, the Liquidation Levels indicator by Leviathan shows liquidation levels based on objective exchange data.
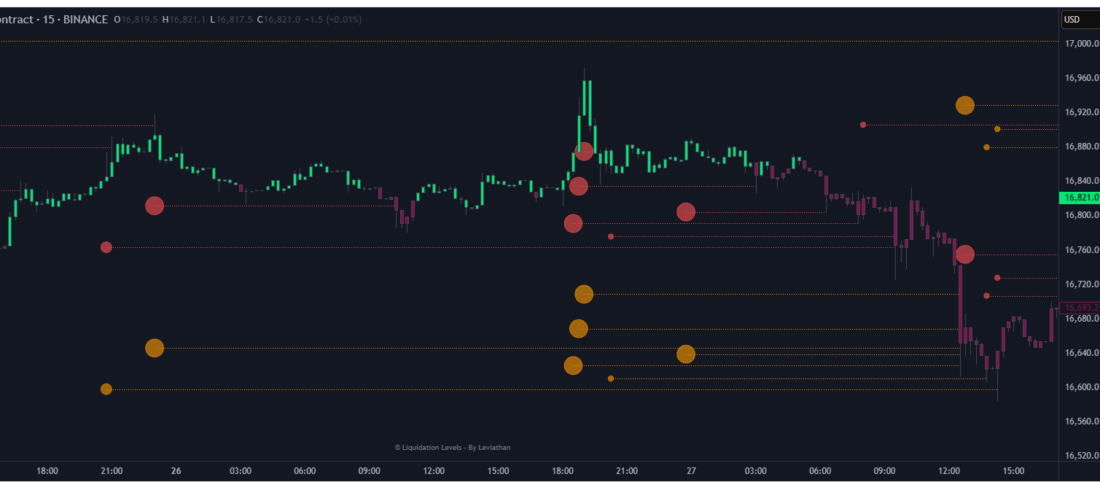
We will examine the most powerful liquidation indicators on TradingView in more detail in another article.
Conclusion
Liquidations strengthen the move in the impulse phase and reverse the price from the balance boundary.
In order not to become a victim of liquidation and not to look for money to replenish the deposit, it is necessary to carefully monitor:
- the leverage level (the lower it is, the smaller the chance of liquidation)
- the levels of total and maintenance margin and the liquidation price
- the heatmap, open interest, etc. to assess liquidation risk.
A complex stop (for example, one made up of three equal parts) helps quite well, reducing the loss and pushing the liquidation price farther away with the same financial risk.