
Bitcoin Fear and Greed Index: how to use the cryptocurrency sentiment indicator
The cryptocurrency market is a separate universe that serious state regulators have, of course, already reached, but where there are still many gray zones and even Fields of Wonders for new generations of Buratinos.
One of the main outward distinctions of crypto markets is extremely high volatility: if the stock market is characterized by average daily volatility within 1%, then for bitcoin it is about 3.5-4.5% and even higher in other crypto projects.
In moments of panic, cryptocurrencies easily lose 20-50% or more in a day. To assess potential risks, the cryptocurrency fear and greed index was created, helping speculators evaluate market sentiment.
At the same time, every self-respecting analytical resource or popular exchange has its own fear and greed index for bitcoin and other crypto.
Below the cut, the trader will find information about what kinds of volatility indices (this is another name for fear and greed indices) exist for cryptocurrencies in general and bitcoin in particular. The trader will also learn how to use the fear indicator in a trading system and how to trade volatility.
What the “Cryptocurrency Fear and Greed Index” is in simple words
The cryptocurrency fear and greed index (Crypto Fear & Greed Index) is, in essence, an attempt to express in numerical form the emotions of market participants, bounded by panic selling on one side and euphoric buying on the other.
In the crypto sphere, the fear indicator is most often created for bitcoin, while similar approaches are used to calculate indicators for altcoins or universal “crypto” indices.
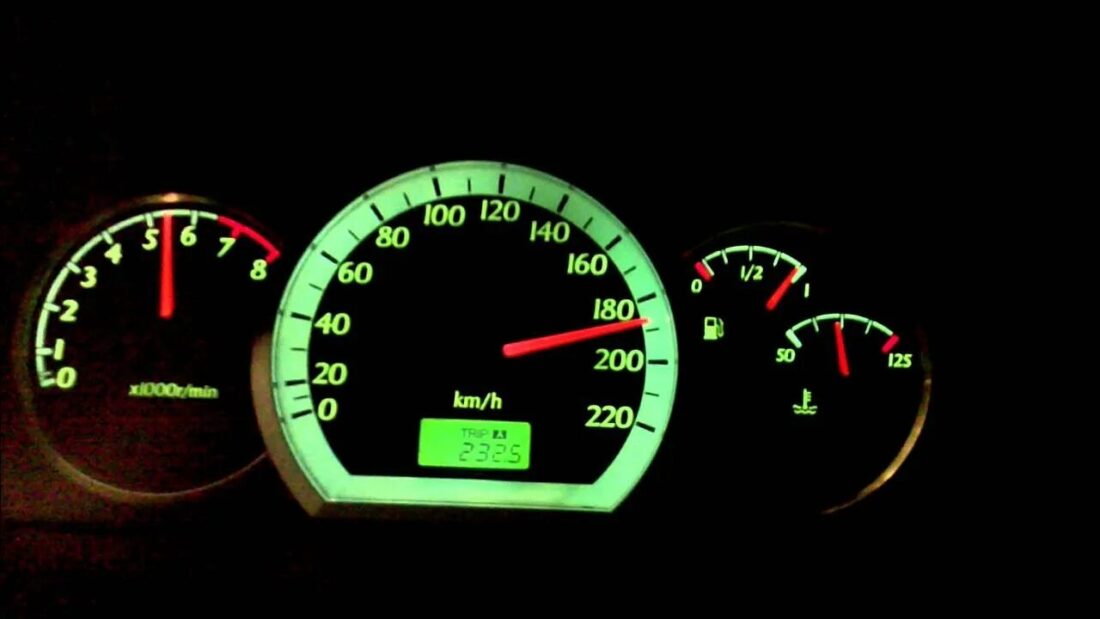
Calculating the bitcoin fear and greed index is a combination of several independent market metrics, each of which reflects a certain part of sentiment: fear, uncertainty, greed, or euphoria. These metrics are then normalized, weighted, and combined into a single number from 0 to 100, producing a convenient numerical indicator at the end: a speedometer.
The weights of the metrics may vary slightly from one provider to another, but the logic is similar, therefore the indicator values on different resources differ little from each other. In other words, there is no universal index.
The main difference between various indices lies in the set of data used for the calculation: technical, on-chain, social-media sentiment, derivatives. Thus, CoinMarketCap + Alternative.me + Glassnode are well suited for Bitcoin, Santiment + CVI + cfgi.io for altcoins, and CoinGlass + exchange versions for derivatives trading.
The developers of the bitcoin index and other cryptocurrency indices recalculate the indicator daily.
The value of different Fear & Greed Index versions is expressed in the range from 0 to 100:
- 0-24 — extreme fear zone
- 25-49 — fear zone
- 50-59 — neutral zone
- 60-79 — greed zone
- 80-100 — extreme greed zone
Below we will look in detail at several versions of the cryptocurrency fear and greed index.
Components of the CoinMarketCap cryptocurrency fear and greed index
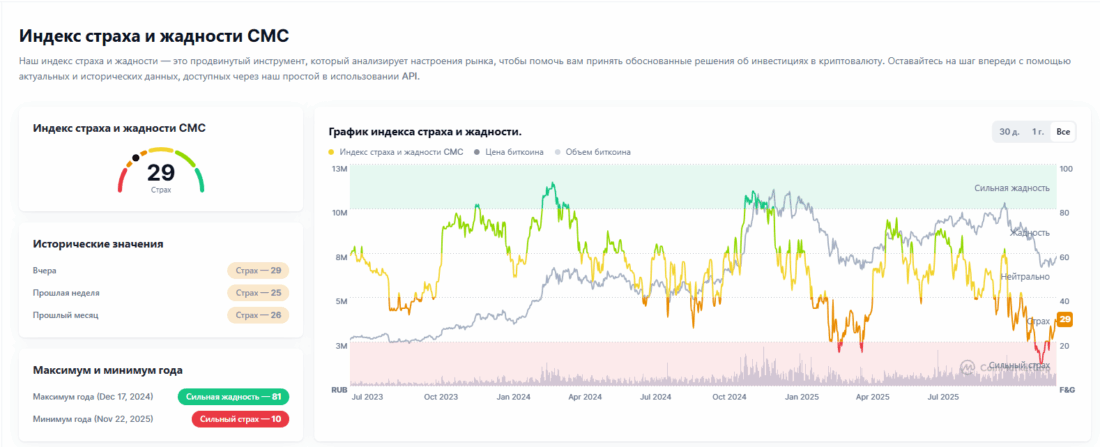
CMC Fear & Greed Index is one of the most popular in Russia. This index collects data from 5 key categories, each of which reflects a separate aspect of market sentiment. These components are then normalized, weighted, and combined into a final indicator.
1. Price Momentum (price momentum).
This component gives a comprehensive market picture by assessing how the top 10 cryptocurrencies by market cap (excluding stablecoins) are moving relative to the market. If the current trend is strong and supported by volumes, it is a signal of greed. If prices are weak or falling, it pushes the index toward fear.
2. Volatility (implied volatility with options).
Expected (implied) volatility differs from actual (realized) volatility and is estimated from options interest. CoinMarketCap uses Volmex Implied Volatility Indices:
- BVIV for Bitcoin
- EVIV for Ethereum
These indices show what volatility market participants expect over the next ~30 days on the basis of options. High expected volatility is often associated with fear of future moves (fear), while low volatility implies calmness and confidence (greed).
3. Derivatives Market (derivatives market).
The put/call ratio is an important sentiment indicator for experienced traders, because participants pay real premiums for protection or aggressive upside. Here the put/call ratio for BTC and ETH options is analyzed:
- More put options → participants expect a decline → fear.
- More call options → expectation of growth → greed.
4. Market Composition (market structure).
CoinMarketCap takes the Stablecoin Supply Ratio (SSR) into account, the ratio of Bitcoin capitalization to the capitalization of major stablecoins. It works as follows:
- Low SSR (a lot of stablecoin relative to BTC) → investors hold more stable value → fear.
- High SSR → BTC is stronger, people move into risk assets → greed.
As a result, it becomes clear where funds are going: into risky crypto or into stablecoins.
5. CMC Proprietary Data (CoinMarketCap's own data).
This includes analysis of user activity and social-media trends:
- Popular search phrases (for example, “crypto moon,” “Bitcoin bull run”).
- Audience engagement (likes, comments, views).
- Interest in specific topics or projects on the CoinMarketCap platform and in social media.
This approach makes it possible to capture the behavioral component of the market, especially among retail investors, who often influence short-term movements.
Components of the Alternative.me cryptocurrency fear and greed index
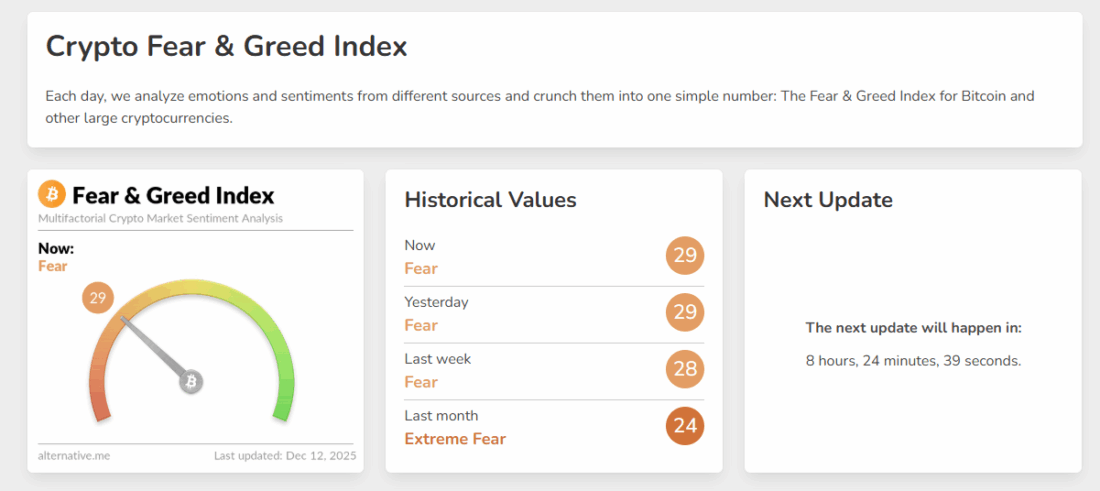
The Alternative.me cryptocurrency fear and greed index is popular in the United States.
1. Volatility (about 25%).
Current volatility and maximum drawdowns are compared with average values over 30 and 90 days. The higher the volatility, the scarier the market.
2. Market momentum / volumes (about 25%).
Comparison of current buying volumes with historical levels. Rising volumes and momentum are characteristic of a growing market and indicate a higher level of greed.
3. Social signals (15%).
Social media data (Twitter/X, Reddit), intensity of discussions, tone. A boom in mentions and “euphoria” on social media is a reliable signal of greed.
4. Google Trends (10%).
A sharp increase in search queries like “Bitcoin price manipulation” and “Bitcoin crash” hints at growing fear. An increase in queries like “buy Bitcoin” indicates growing greed.
5. Bitcoin dominance indicator (10%).
If BTC dominance is rising, this indicates that players are exiting altcoins and, therefore, that fear is growing. But when bitcoin dominance declines, more money moves into alts, and risk appetite (greed) grows.
6. Questionnaires/polls (15%).
Community survey data (about 2-3 thousand respondents) on market sentiment. They are conducted infrequently because the data is very volatile.
Other ways to calculate the cryptocurrency fear and greed indicator
The CFGI.io resource calculates fear and greed indices for various cryptocurrencies that include price signals, behavioral data from social media, and trading volumes.
In turn, CoinGlass focuses on derivatives in its calculation and evaluates volumes, OI (open interest), funding rate, and liquidations.
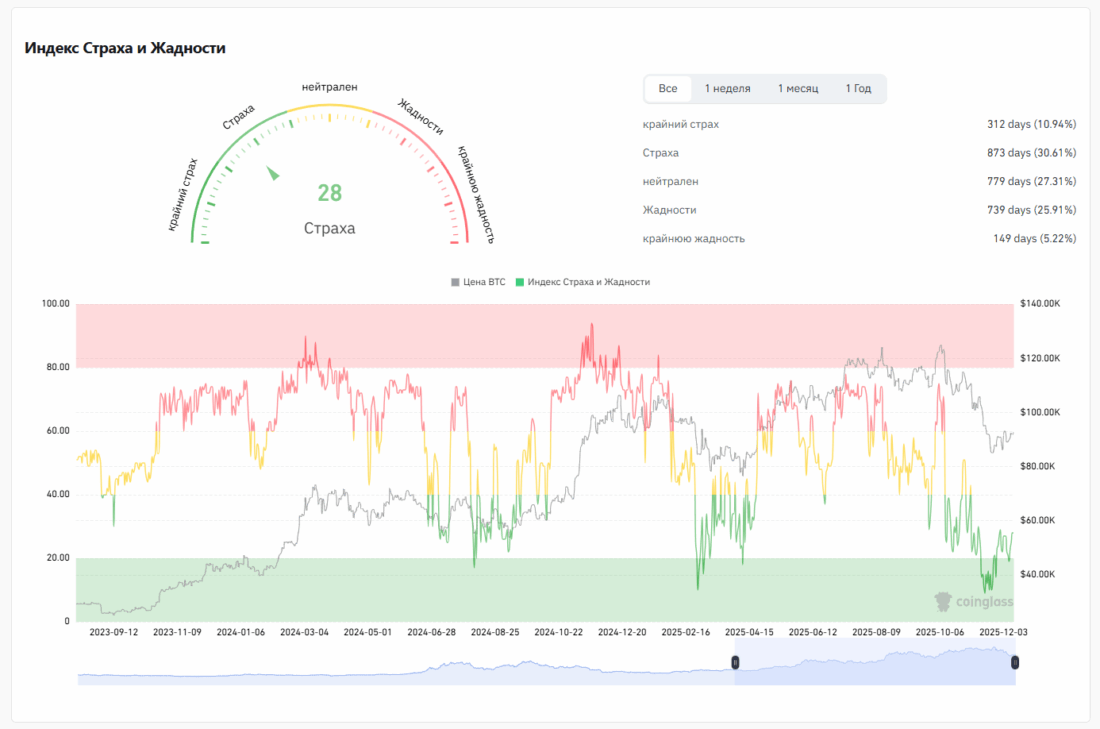
Why were exactly these metrics used to calculate the fear and greed indicator?
Because the cryptocurrency market is especially sensitive to:
- volatility → causes fear
- volumes and momentum → create euphoria
- social media → influence retail investors
- BTC dominance → an indicator of moving out of/into “risk”
- Google Trends → reflects the breadth of interest.
Thus, the fear and greed indicator evaluates emotional behavior and turns it into a simple number.
Cryptocurrency volatility indices are professional fear and greed indicators
Volatility indices are, in essence, professional fear and greed indicators.
Implied (expected) volatility is what market participants are ready to “pay” for protection. A sharp rise in implied volatility indicates an increased expectation of strong movements (fear), while a decline indicates calmness/self-confidence (greed).
VIX for the stock market is an index of expected volatility expressed through options (the implied volatility of S&P options). Several similar solutions have already appeared in crypto. Their charts can be found on TradingView.
BitMEX BVOL / BVOL24H are indices of historical/realized volatility and their variants, used to analyze the current “vol” of Bitcoin. These indicators appeared back in 2015 and measure how sharply the price changed in the past (realized volatility), which is useful when compared with implied volatility.
Deribit DVOL / Implied Volatility Index is one of the first “VIX-like” fear indicators for bitcoin: it aggregates implied volatility across option smiles and produces the equivalent of 30-day annualized volatility. Deribit also developed a similar index for ether, ETHDVOL.
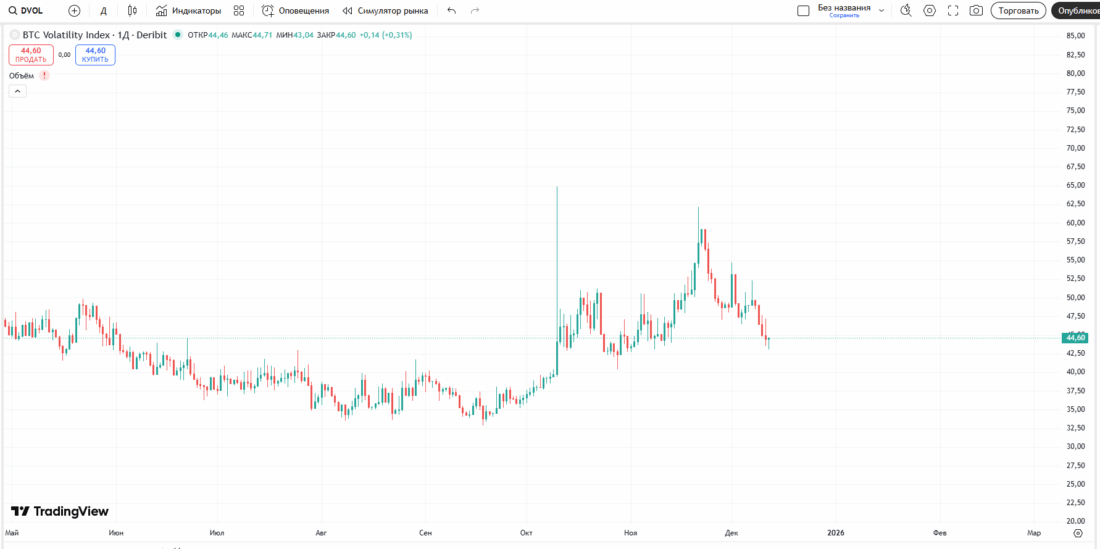
DVOL is used as the base reference for volatility products.
BVIV / EVIV are expected volatility indices calculated on the basis of options on BTC and ETH. They are created by Volmex Finance using a methodology that is as close as possible to the VIX calculation.
Exchange/industry initiatives (CME/CF Benchmarks, etc.) appeared at the end of 2025 as official benchmarks imitating VIX for BTC and other crypto assets (references, settlement, and real time), making implied volatility more standardized and suitable for hedging and regulatory requirements.
Other derived risk measures: put/call ratio (the ratio of put- and call-option volume), skew (option smile asymmetry), vol-of-vol (volatility of volatility). All of them provide a subtler “insurance” cross-section of market participants’ sentiment.
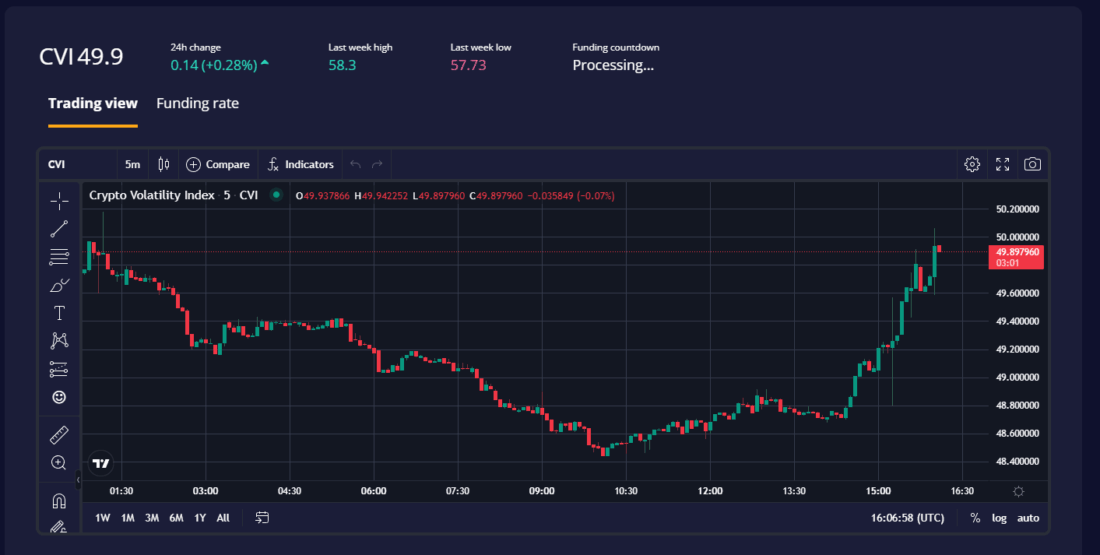
Let us also mention separately the decentralized cryptocurrency volatility index (CVI).
What BVIV and EVIV are in simple words
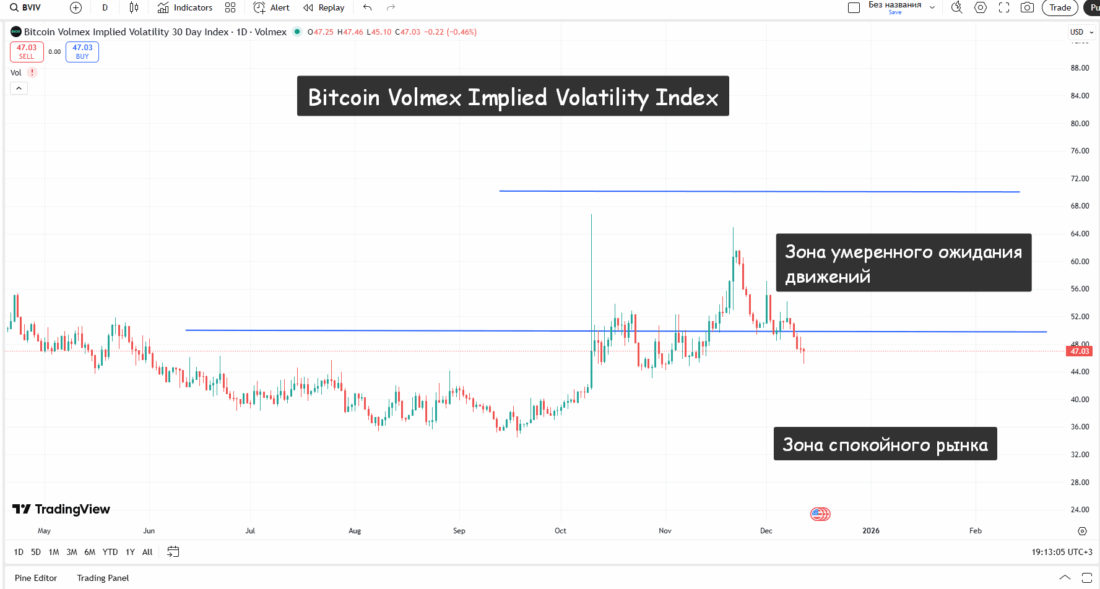
At present, a special place is occupied by the BVIV (Bitcoin Volmex Implied Volatility Index) and EVIV (Ethereum Volmex Implied Volatility Index) indices developed by Volmex Finance.
BVIV and EVIV show how strong a movement professional traders expect on the basis of options prices. They are crypto analogues of the traditional VIX volatility index, which is calculated from options on the S&P 500.
The calculation includes Call and Put option prices on BTC or ETH, several series with different strikes, the nearest expiration dates (usually ~30 days), and risk premiums embedded in the options. After the calculation, a volatility curve is built and recalculated into 30-day forward expected volatility (an analogue of the 30-day VIX).
That is, the index shows not vol right now, but the volatility the market expects over a statistical 30-day horizon.
If the index is high, the market expects sharp fluctuations (up or down). If the index is low, the market is calm and expectations of movement are weak.
Interpretations of BVIV index values:
- 35-50 — calm market
- 50-70 — moderate expectation of moves
- 70-100 — aggressive expectations of volatility
- 100+ — panic / extreme (an extremely rare event)
Interpretations of EVIV index values:
- 50-70 — neutral
- 70-100 — fast movements are expected
- 100+ — extreme turbulence
ETH volatility is usually higher, so normal values are higher as well.
On August 26, 2025, the ByBit crypto exchange announced the integration of the BVIV and EVIV indices and the launch of complex products based on these indices.
Analysis of combining the Fear & Greed Index with implied volatility (DVOL/BVIV/EVIV), derivatives, and volumes
There are several empirical rules for combining simple and professional indicators of crypto-market sentiment.
The greed and fear index and DVOL/BVIV/EVIV (expected bitcoin volatility)
| Fear and Greed Index | DVOL/BVIV/EVIV (implied vol) | What does it mean |
|---|---|---|
| Fear | Tall ox | The market is afraid of a sharp fall, the possibility of capitulation |
| Fear | Low ox | The mood is negative, but there is no panic – the market may stabilize |
| Greed | Tall ox | Speculative euphoria – often before a reversal |
| Greed | Low ox | Smooth bull run without panic |
If the fear and greed index is in the fear zone and DVOL/BVIV/EVIV is sharply peaking downward, this is often evidence of a good accumulation point. If the index is in the greed zone and DVOL/BVIV/EVIV starts to rise, this is often a harbinger of a sharp move down.
The cryptocurrency greed and fear index and Funding Rates (funding on futures)
| Fear and Greed Index | Funding rate | Interpretation |
|---|---|---|
| Fear | Low or negative | Leveraged longs exit → market clears |
| Greed | High funding | Overheated, the crowd buys on their shoulders |
Funding shows how traders working with leverage are positioned.
The simultaneous combination of greed and high funding rates indicates an overheated market, increasing the risk of buyer liquidity being captured in the form of a short squeeze and the sharp decline that follows. By contrast, the combination of fear and negative funding is characteristic of position-building zones.
The greed and fear index and open interest (Open Interest - OI)
| Fear and Greed Index | OI | Signal |
|---|---|---|
| Greed | High OI | Lots of leverage, risk of liquidations, market fragile |
| Fear | Sharp drop in OI | Liquidations have passed → the market has cleared |
| Fear→Neutral | Growing OI | Confident reaccumulation |
Open interest shows the number of open positions in the cryptocurrency derivatives market. Everything is quite simple here.

If the level of greed is high against a background of rising open interest, a near-term pause is possible. If greed is at an extreme level and open interest begins to decline, then a sharp reversal should be expected: smart money is leaving, while less smart money is buying the highs.
It is also important to evaluate the growth of open interest in the BTC futures contract quoted on the Chicago exchange. While the crowd is buying on crypto exchanges, smart money often hedges risk on official venues by opening short positions at the highs.
The greed and fear index and volumes (Spot Volume)
A very important combination for reversal points. If the level of greed is high while spot volumes and the daily range are declining, then a top has likely been reached. In the case of extreme fear values together with high volumes at the lows, one can speak of a bottom being reached.
The greed and fear index as a filter for signals
It is used as a filter in long strategies:
- F&G < 30 (fear)
- Funding is negative
- DVOL is falling
- Volumes are stabilizing
It is used as a filter in short strategies:
- F&G > 70 (greed)
- Funding is strongly positive
- OI is at highs
- DVOL is starting to rise
Conclusion
First of all, one must understand: the fear and greed indicator is not a trading signal. It is an analytical tool that shows crowd sentiment now (simple indicators) and expected volatility in the near future (complex VIX-analogue indicators).
The emergence of crypto variants of VIX (DVOL, BVOL, and industry benchmarks) provided more professional means for measuring and hedging risk, bringing the cryptocurrency market closer to the toolkit of traditional markets.
The fear and greed index is a useful tool for quickly determining the “mood of the crowd,” but by itself it has little value without confirmation from technical, on-chain, and derivatives metrics.
The basic working template for analyzing the cryptocurrency fear and greed index looks as follows:
- Check the greed and fear index to assess market sentiment.
- Check DVOL/BVIV/EVIV to assess smart traders’ expectations of rising volatility.
- Check Funding to assess where the crowd is betting.
- Check OI to assess the size of leveraged positions.
- Check spot volumes to assess them as confirmation of the trend.
- Make a decision: enter, wait, hedge, or take profit.
Respectfully,
Ivan Rusin