
Open Interest on Cryptocurrencies

Sooner or later, a moment comes when a trader outgrows the level of “just entered by a signal” and begins to see the market through liquidity flows.
If price shows the result of the struggle between buyers and sellers, and volume shows interest in a price range, then open interest (OI) lets you see how much money is generally involved in that struggle.
Thus, price and volume are the basic projection. Open interest adds a third dimension: it shows whether fresh capital is entering the market or positions are being closed.
Let us note right away that growth or decline in open interest is not an independent buy or sell signal. The situation must be viewed only as a whole.
The advantage of cryptocurrency exchanges is that they provide a great deal of information about derivatives (futures and bonds): this is not only open interest, but also values such as funding. The more information there is, the better the analysis of the current market situation.
What Open Interest Is in Cryptocurrencies
Open interest is the number of all unclosed contracts for a specific futures contract or perpetual contract (perpetual futures).
Every time one participant opens a long position (Long), and another opens a short position (Short), a new contract appears. It increases open interest.
For example:
Trader A opens a Long for 1 BTC perp.
Trader B opens a Short for 1 BTC perp.
One new contract appeared, which means open interest increased by 1.
If later one of the participants closes the position, the contract disappears, and open interest decreases. But the transfer of a contract from one trader to another leaves open interest unchanged.

It is important to understand the difference between volume and open interest.
If volume shows how many contracts were traded over the selected period, then open interest is the number of open contracts at a specific point in time.
You can observe a situation where volume is huge, but OI changes almost not at all — this means the market is actively redistributing already existing positions, while new money is practically not entering.
Conversely, a price rise together with OI growth indicates that new capital is coming into the market.
Does Open Interest Exist on Spot?
By its nature, open interest exists only in the derivatives market — futures, options, swaps.
The spot market is an immediate exchange of an asset. There is no concept of an “open contract” there, only a change in balances. Consequently, classic OI for spot does not exist. Therefore, you cannot view open interest for Bitcoin or Ethereum itself as a coin.
You can often find “Spot OI” charts on aggregators. This is misleading: as a rule, concepts are substituted, showing either trading volume or some derivative indicator like “Spot Cumulative Volume Delta”. For spot, only the flow and transfer of orders are correct (best viewed on Arkham) and volume.
Open interest exists only in derivatives markets (derivative instruments):
Futures OI (perpetuals, quarterly) — the main one.
Options OI — critical for major levels (Deribit dominates).
DeFi OI — open positions in on-chain protocols for options or structured products (Ribbon, Dopex, etc.) — a niche metric, but sometimes useful for assessing on-chain sentiment.
Thus, when people say “open interest on BTC”, they always mean derivatives.
Where to Watch Open Interest
Today, practically all major crypto exchanges publish open interest data. The most popular are:
Binance Futures;
Bybit ;
OKX ;
Bitget;
Deribit (especially for options);
CME (for institutional Bitcoin futures).
However, traders rarely analyze each venue separately. It is much more convenient to use aggregators that collect data from all major exchanges at once.
A good choice is the TLAP cryptocurrency open interest aggregator, which collects data from the five crypto exchanges mentioned above, as well as from CME.
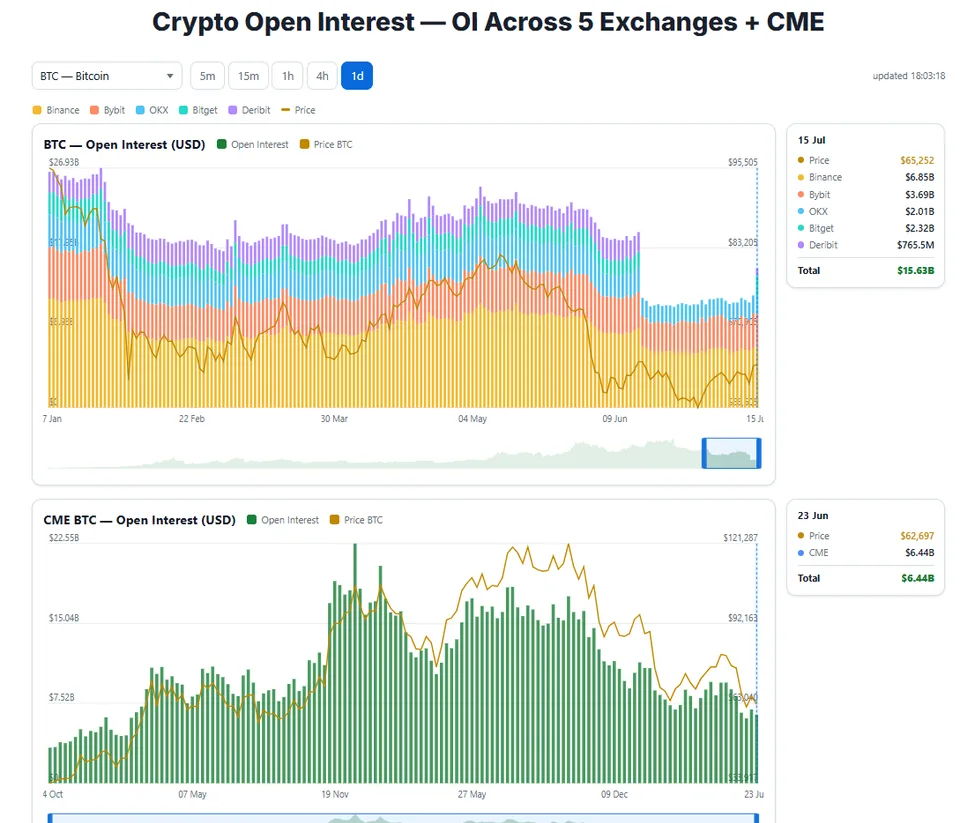
The chart shows aggregated OI in dollars: total open interest for the selected coin across all exchanges. Each chart column shows the contribution of each exchange (Binance, Bybit, OKX, Bitget, Deribit) at the point under the cursor.
The price line lets you assess how open interest changes over time.
Multi-year history and a zoom navigator: daily data since 2020 and scaling by period.
The CME Bitcoin Open Interest chart shows open interest in Bitcoin futures on the Chicago Mercantile Exchange (CME). The data source is weekly COT reports (CFTC). In this same article, you can learn how to work with data from these reports.
How to Use OI Data for Market Analysis
Open interest in cryptocurrencies by itself predicts nothing. It only shows how many participants are in the market.
The trader's task is to assess how OI changes relative to price. It is also worth paying special attention to volumes and the funding rate (funding).
Below are quite workable schemes for analyzing the market situation and making a trading decision.
Trend Direction: OI as Fuel for the Move
If open interest rises confidently during a strong trend, this is most often a strong signal of players' confidence in the continuation of the move.
Price | OI | Interpretation |
Rising | Rising | Strong bullish trend. Fresh longs are opening: the trend has fuel. |
Falling | Rising | Strong bearish trend. Shorts are being opened. |
Rising | Falling | Weak growth. Closing shorts (short squeeze) or taking profit on longs. The trend is losing steam. |
Falling | Falling | Weak decline. Liquidations of longs or taking profit on shorts. Potentially close to a bottom. |
This is a classic interpretation, and it works fairly well in cryptocurrencies. At the same time, caution is needed, since a decrease in open interest during a strong move is not always proof of trend exhaustion.
There are often situations, especially in the stock market, though they are possible in major coins too, when OI declines at the start of a strong move (almost always growth): this is “smart money” exiting protective positions.
Futures and options are a hedge (protection) of the underlying asset for large capital. If smart money is confident in the strength of growth, it aggressively closes short futures positions, thereby reducing overall OI.
Extremely High and Low OI and Reversals
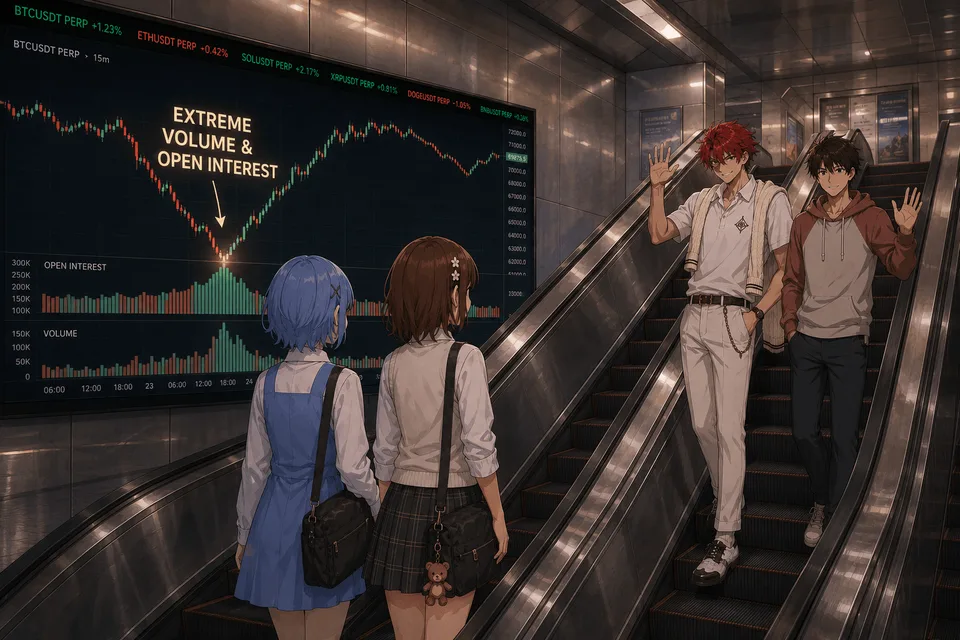
After a prolonged impulse move, open interest reaches peak values.
Record OI at price extremes, significant long-term highs or lows, means that:
the market is overloaded with positions in one direction, and any push, including profit-taking, can trigger a cascade of liquidations;
smart money opens positions against the trend, because in the medium or long term they expect or are forming a sharp reversal.
In turn, a sharp drop in OI after a prolonged move indicates smart money exiting while being unwilling to play the opposite side. At this moment, the market often moves into consolidation at new price levels.
Open Interest and Funding Rates: an Overheating Detector
High OI together with extreme positive funding is an almost guaranteed signal that longs are overloaded. The logic of a “crowd trap” works well here: when OI and funding are at their maximum, and the price cannot make a new high, a divergence appears.
A similar situation applies within short-side dynamics.
OI Cluster Levels as a Price Magnet
Large clusters of OI in options (by strikes) act as a magnet — the price often tends toward the Max Pain zone at expiration. Analysis of options OI on Deribit shows which strikes matter to market makers.
To conduct the analysis, it is worth identifying the strike with the maximum OI 2-3 days before the quarterly expiration of crypto options.
The price has a statistical tendency to move toward the maximum strike. This is not a guarantee, but it is a powerful contextual level where certain decisions can be made.
Intraday Analysis: OI and CVD
Moving to active intraday work with OI requires analyzing changes in OI over the shortest possible time intervals, preferably together with Cumulative Volume Delta (CVD) — the cumulative difference between market buys and sells.
If in the market:
CVD is rising, OI is rising, price is rising — aggressive buying with new longs being opened. Strong impulse; you can look for an entry point for continuation.
CVD is rising, OI is falling, price is rising — buying is closing shorts. The growth is unreliable and will soon dry up.
CVD is falling, OI is falling, price is falling — aggressive selling is closing longs (long liquidations). Potential seller exhaustion.
CVD is falling, OI is rising, price is falling — strong bearish pressure with shorts being opened.
OI as a Filter for False Breakouts
A level breakout without OI growth is very often a weak breakout. It is often a “bull/bear trap.” If the price leaves a range while OI is not rising (or is even falling), it means the move is not supported by new positions — most likely, a return will occur.
However, we should remember that the situation may be different if the breakout is to the upside, and the decline in OI in this case may simply be large players closing hedges.
If, after a level breakout, the price returns into balance, this may be an interesting situation for looking for a countertrend trade.
OI Anomalies on Individual Exchanges
Aggregators provide the overall picture, but sometimes OI behaves differently on one exchange.
For example, on Binance OI is stagnating, while on Bybit it is rising sharply during an upward move — this may indicate a local inflow of retail money and instability. Professionals monitor disproportions and assess the quality of the move.
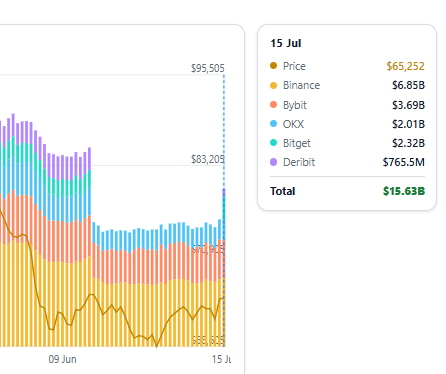
The “TLAP Cryptocurrency Open Interest” service allows you to analyze open interest across 5 leading exchanges.
It is worth paying attention to where open interest changes sharply: if OI is not rising on a market-maker exchange (Deribit), while it is rising on retail exchanges, the trend may be weak.