
What Open Interest and Put/Call Ratio Show in the Crypto Options Market

Options often seem to ordinary traders like simple and understandable analytical tools. At the same time, traders flatly refuse to understand how options are structured and what option metrics actually mean.
In the new article, we will examine such related concepts as Open Interest and the Put/Call Ratio, and also show how to use them to analyze the market situation.
What Open Interest (OI) Is, Where to View It, and How to Analyze It
Open Interest is the total number of active (unsettled) options contracts on a particular asset (for example, bitcoin or ether) with a given strike (exercise price) and expiration date.
To understand this, let us imagine an auction where people place bets on a future price. Each new bet is a contract. OI is the total number of all bets on the table. If OI is growing, it means new money is coming into the market and participants are actively opening positions. If open interest is falling, participants are closing positions.
It is important to understand that open interest is neither trading volume nor the number of completed trades. OI is precisely the number of active contracts, and it does not matter whether they were opened today or a month ago.
The simplest way to interpret open interest data is as follows:
- High OI at a specific strike (for example, at $60 000 for BTC) indicates a strong "zone of interest." Many traders expect the price to trade around this mark by the expiration date.
- Growth in OI together with price growth reinforces the current trend (a bullish signal).
- Growth in OI together with a price decline also reinforces the trend (a bearish signal).
In traditional stock options, you cannot split a contract, i.e., the minimum unit is 1 contract, which gives the right to buy or sell a quantity of the asset specified in that contract.
In crypto options, however, everything is a little different. Deribit, for example, allows options to be split into fractions, which makes trading accessible to players with a small balance.
For linear USDC options on BTC/ETH, Deribit officially allows orders starting from 0.01 contract for BTC and from 0.1 contract for ETH. Inverse options, however, can be split only for BTC, starting from 0.1 contract.
Now let us look at which open interest parameters can be analyzed and what they indicate.
Deribit: Open Interest By Strike Price
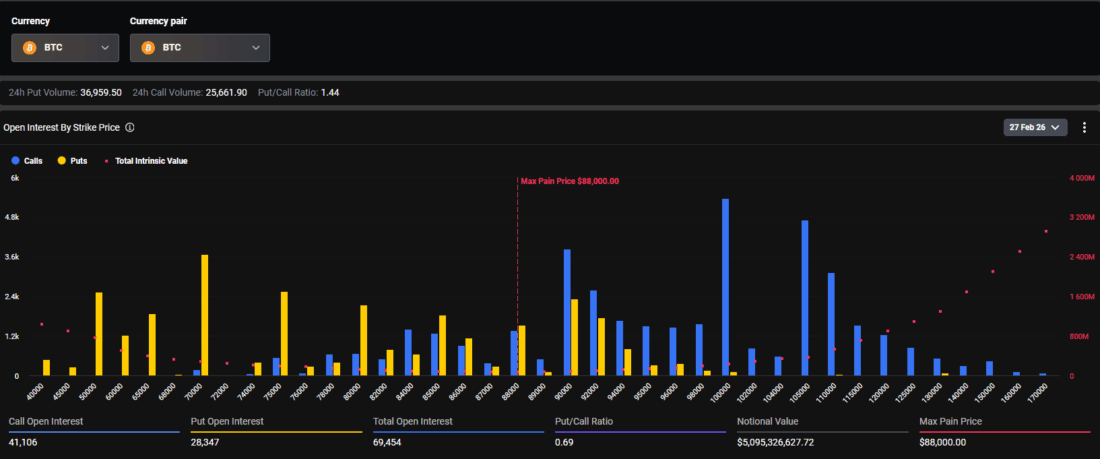
Here are the open interest data for the February monthly BTC option from the Deribit exchange. The data are published on the Metrics Options page.
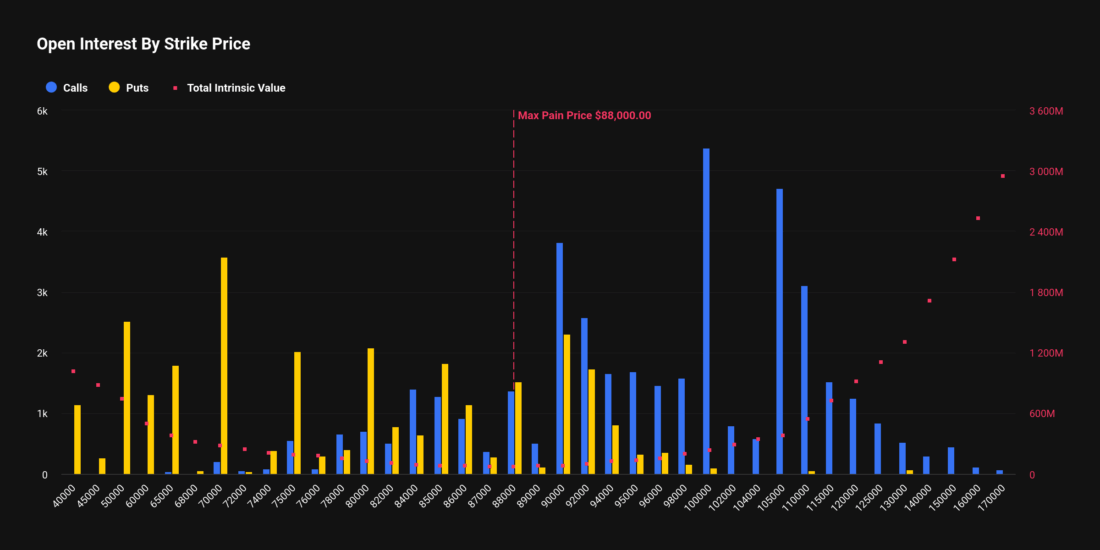
The picture shows the current open interest in put and call options matched against the exercise prices (strikes), on which the Max Pain price is overlaid. The chart also includes the intrinsic value of the options (intrinsic value for in-the-money options).
Below this image, the page also provides information on total open interest and open interest separately for put and call options.

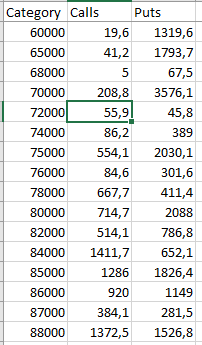
If you need to study open interest at each strike in detail, you can download the CSV file and work with the raw numbers:
Why is it necessary to know at which strike the maximum open interest is located?
There are two explanations and assumptions: either there will be a certain consolidation around this strike, especially closer to expiration, or this strike will act as a support or resistance level (maximum put OI as support and maximum call OI as resistance).
Deribit: Open Interest By Expiration
This chart shows the current open interest in put and call contracts, divided into in-the-money and out-of-the-money categories for each active contract.
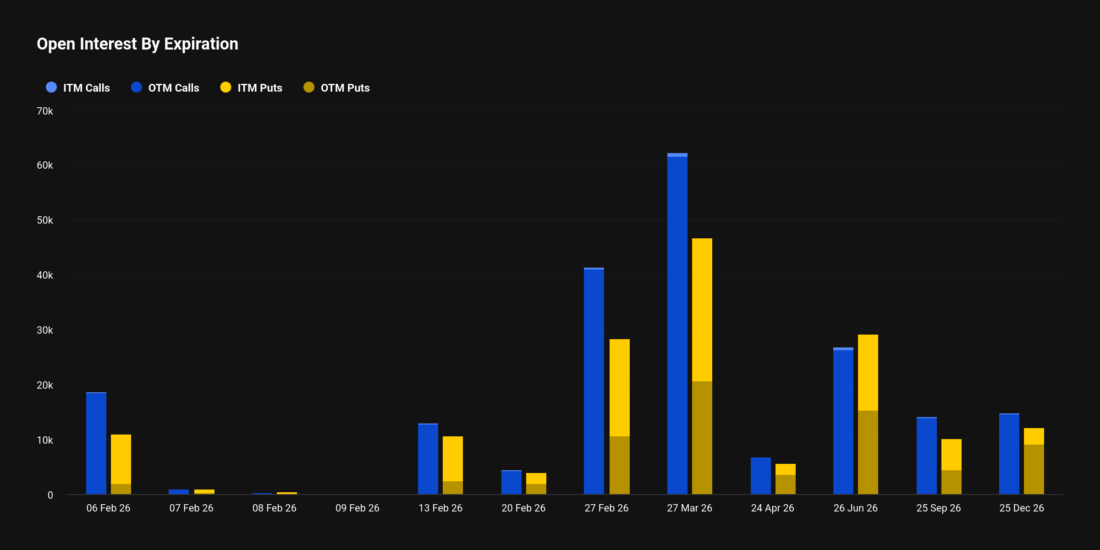
Above, we examined the 27 Feb 26 contract. Let us note right away that the second most significant OI is concentrated in this contract, therefore this instrument's expiration should be treated very carefully.
If you hover over the chart, you can see the distribution of in-the-money (ITM) and out-of-the-money (OTM) options. More about them is in this article, and here I will only remind you that ITM is an option with profit, while OTM is without profit.
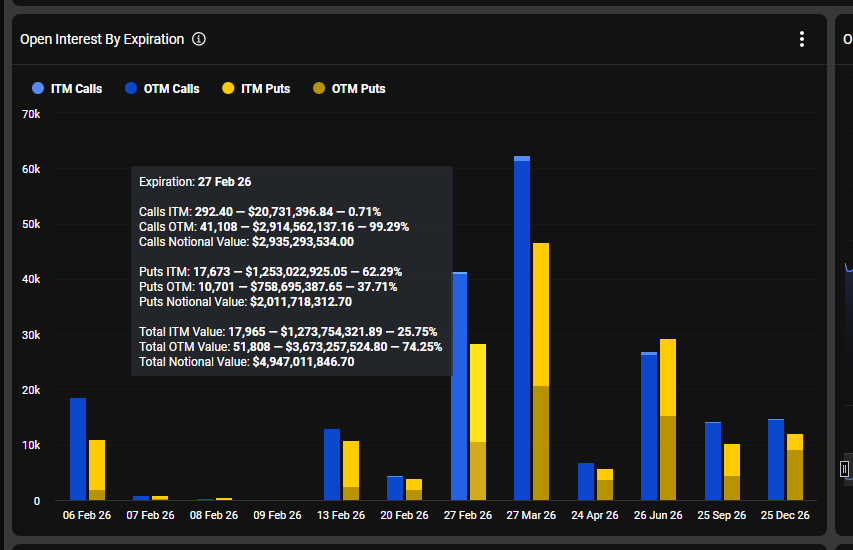
We can see that 17673 put options are currently ITM, which should please the buyers of these instruments. I do not recommend that particularly impressionable readers look at the dollar amounts, because this is the value of the assets under which the option is written, not the money invested in options.
You can also download a CSV file with these data.
This metric is important for assessing the market phase and the potential for further movement. In addition, thanks to this metric, one can assess the strength and importance of a level: the more open interest in different contracts is concentrated at one strike, the more important that level is.
Deribit: Open Interest (Prev. day)
The last metric on this page shows the change in total open interest by day. We remember that rising OI is good, while falling OI is not always bad.
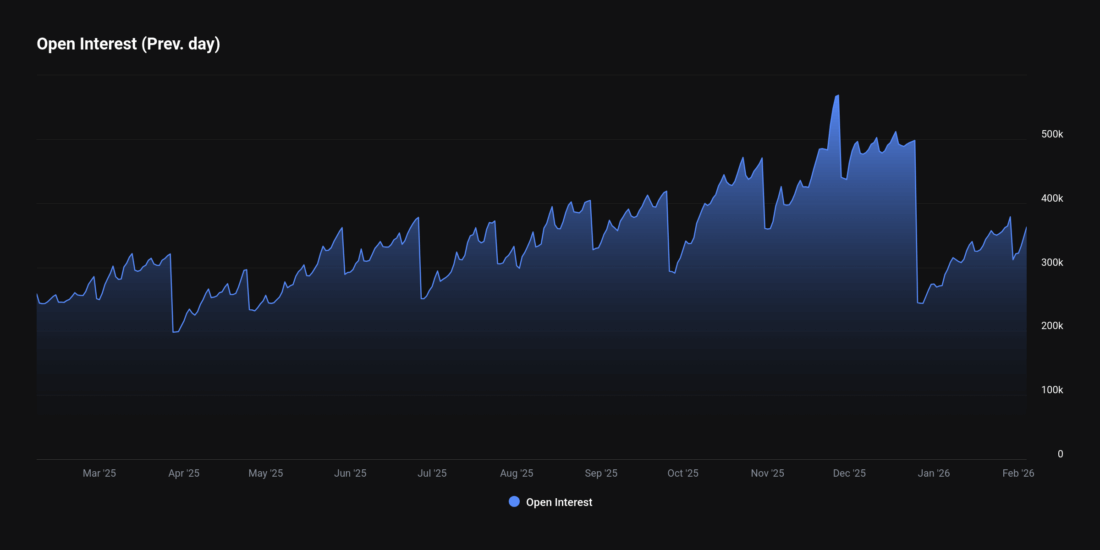
It is necessary to track how OI falls during the expiration of monthly and especially quarterly contracts, and also to find points of real OI growth, cleansed of the flow of liquidity from one monthly / quarterly option into another.
We have covered the general information that Deribit provides on open interest. It is worth noting that similar data can also be found on the Options Data page, only there they are presented less informatively.
Coinglass: Crypto Options VS Crypto Futures Open Interest Ratio
The options / futures OI ratio is the ratio of the total notional value of open options positions to the sum of the total notional value of open positions in perpetual and dated futures. This ratio can be used to assess the influence of options traders' hedging behavior on price changes.
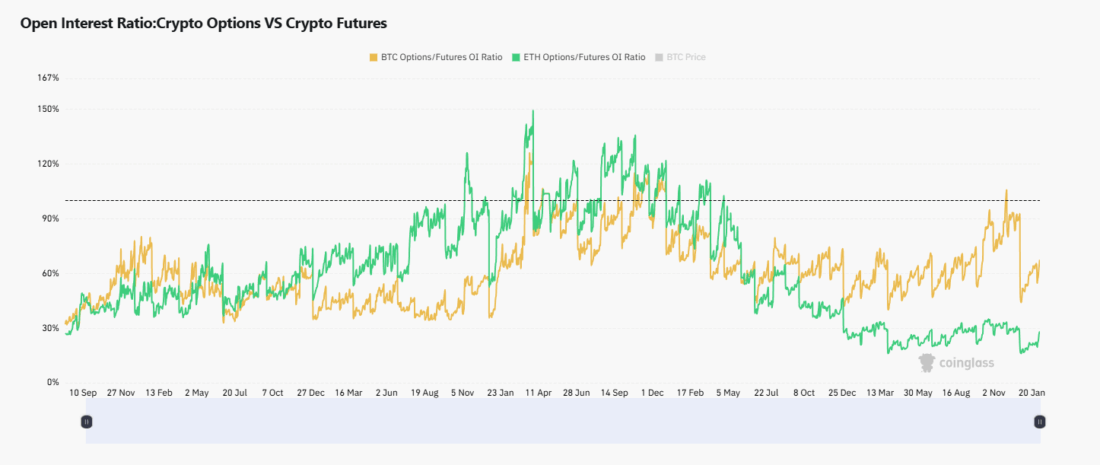
When the ratio is low (≤0.5), the behavior of options market traders usually has little effect on price. When this ratio is between 0.5 and 0.9, the influence of options on price becomes stronger, especially in a thin market. When the coefficient exceeds 1, with some exceptions, options have a significant impact on changes in the price of the underlying assets.
Why does the options-to-futures ratio work this way? Everything is very simple. Options are sold mainly by market makers. And if their position enters a risk zone, they begin to hedge it aggressively with futures and spot, shifting the price, because in this case they are working with market orders.
As for the other open interest metrics available on Coinglass, they are the same as on Deribit. Moreover, Coinglass takes these metrics from Deribit as well as from OKX and Binance, although volumes and open interest there are significantly lower than on Deribit.
Some of these metrics are visualized a little more conveniently, some less so, so we recommend taking a look and deciding for yourself where and what to watch.
What Put/Call Ratio (PCR) Is, Where to View It, and How to Analyze It
Put/Call Ratio (PCR) is an indicator of the ratio of the volume or open interest of put options (bets on a decline) to the volume or open interest of call options (bets on growth). It measures the overall sentiment of market participants and is often used as an indicator signaling potential reversals.
The formula for calculating the Put/Call Ratio is very simple:
PCR = (Put Volume or Put OI) / (Call Volume or Call OI).
PCR > 1: there are more puts than calls. Bearish sentiment prevails. Traders buy insurance against a decline or bet on a drop. PCR significantly above 1 indicates strong fear and can be a signal of oversold conditions and an imminent correction.
PCR < 1: there are more calls than puts. Bullish sentiment prevails. PCR significantly below 1 indicates excessive optimism. It is considered a sign of overbought conditions and warns of a possible correction.
Cryptocurrency markets differ from traditional markets in high volatility, so PCR is interpreted here with certain nuances. For example, a neutral value may be considered around 0.7 / -0.7 rather than 1 / -1, which is associated with the stronger influence of participants' emotions on trading.
Thus, extreme PCR values can often be a decent countertrend indicator.
| Column 1 | Column 2 | Column 3 |
|---|---|---|
| Mood/Signal | PCR value | Possible strategy |
| Excessive fear / Oversold | High (>1.3-1.5) | Countertrend: closing shorts, looking for buying points in anticipation of a rebound. |
| Excessive Greed / Overbought | Very low (<0.4-0.5) | Counter-trend: closing purchases, looking for shorts. |
| Trend confirmation | PCR grows with the price fall /PCR falls with the price rise | Trending: confirms the strength of the bearish trend/confirms the strength of the bullish trend. |
Naturally, we should never forget that signals obtained from PCR analysis must be confirmed by technical indicators.
How to Use OI and PCR to Analyze the Expected Move?

Identifying key support and resistance levels.
The most significant levels with maximum OI are highly likely to become magnets for price and key barriers. For example, if the OI peak for calls is at $70 000 and for puts at $65 000, then the $65k-$70k zone will be critical.
Assessing overall sentiment (PCR) and checking it against OI.
Scenario A. PCR is high (>1.2), while OI is growing at the lower put strikes. This confirms strong bearish sentiment and increases the likelihood of a move downward.
Scenario B. PCR is high, but OI at the lower put strikes is not growing or is falling. Perhaps this is already priced in by the market, or large players are closing bearish positions. Extreme PCR in such a situation can become a reversal signal.
A Practical Example of Analysis
Situation: BTC Price = $63 000.
- OI grew from 100 000 to 110 000 contracts -> +10% OI. The growth is concentrated in calls at the $70 000 strike.
- PCR (by OI) fell from 0.9 to 0.6 (i.e., call OI is now 1.67x larger than put OI) -> moderately bullish sentiment.
- OI distribution: The maximum number of calls is concentrated at the $70 000 strike (a huge wall), and the maximum number of puts is at $60 000.
Possible conclusion:
The market generally expects growth, but sees strong resistance at $70 000. The price will most likely begin to approach this level, although it may test $60 000 from above for support. As it approaches $70 000, the move may face difficulties if PCR does not continue to decline.
Conclusion

Open Interest shows how many contracts are "still on the table": OI is growing, new participants are entering the market; OI is falling, positions are being closed. Proper use of open interest indicators at different strikes makes it possible to see support / resistance zones, and also to determine zones where trading will be least interesting.
In turn, Put/Call Ratio shows the ratio of put options to call options: if PCR > 1, then there are more puts in the market, which means sentiment is bearish; if PCR < 1, then there are more calls in the market (bullish sentiment). Proper use of PCR lies in analyzing extreme values and the dynamics of change.