
How to Use Funding in Cryptocurrency Futures
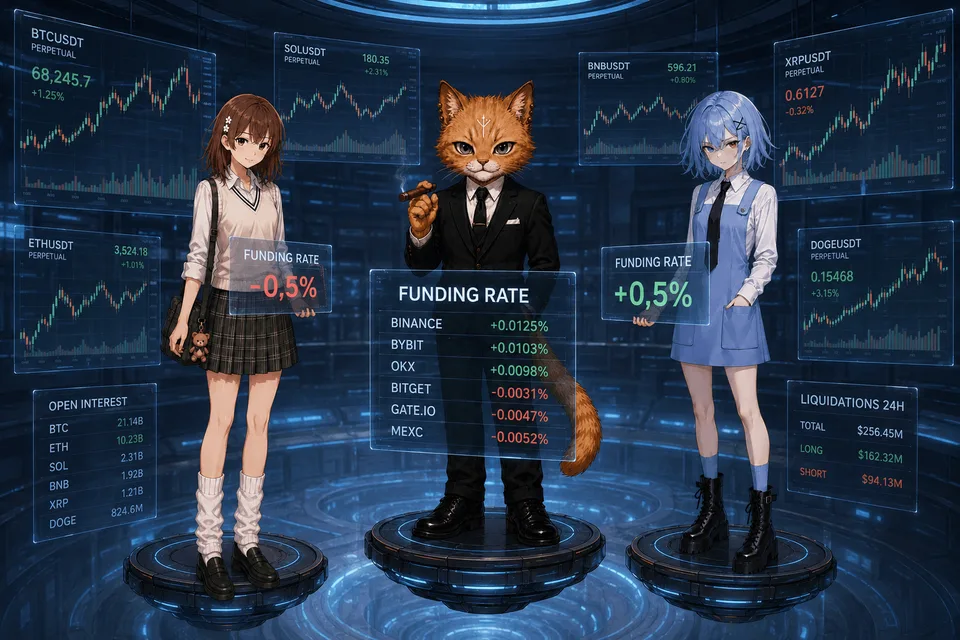
Most beginner traders perceive funding (Funding Rate) as just another exchange metric that only shows who pays whom for holding perpetual futures.
However, for professional market participants, funding is primarily an indicator of the imbalance between buyers and sellers. By itself, it rarely becomes a trading signal, but combined with open interest (Open Interest), the liquidation map, and Cumulative Volume Delta (CVD), it allows you to understand what is happening in the market much more deeply.
A Few Words About Funding
Most cryptocurrency exchanges offer perpetual futures (Perpetual Futures). Unlike classic futures contracts, they do not have an expiration date.
To prevent the price of a perpetual contract from deviating too far from the price of the underlying asset on the spot market, the funding mechanism is used. You can read more about funding in our article; below we will cover only the most important points.
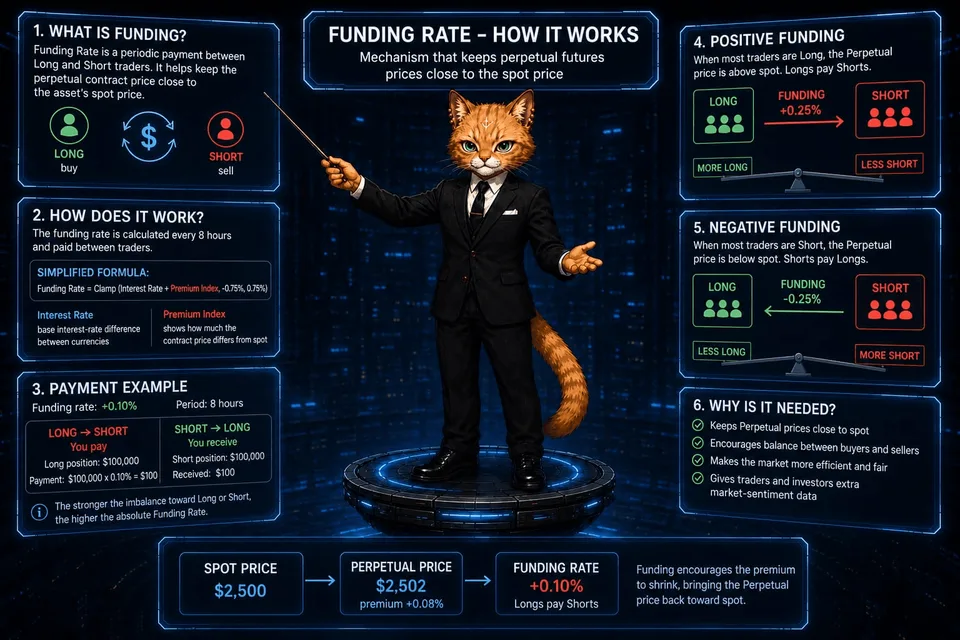
At certain intervals (usually every 8 hours, although on some exchanges the period may differ), traders exchange small payments with each other.
It is important to understand that:
the exchange does not receive this money;
payments occur only between holders of long (Long) and short (Short) positions;
the payment amount depends on the financing rate (funding) and the position size.
Thus, every 8 hours (as standard), long traders pay short traders, or vice versa.
If the futures price is higher than the spot price (the market is bullish, everyone wants to go long), funding is positive (+). Holders of long positions pay holders of short positions. Holding a long is expensive.
If the futures price is < the spot price (the market is bearish, everyone is shorting), funding is negative (-). Short traders pay long traders.
By itself, the payout amount is usually small. For example, a rate of 0.01% means that the owner of a position worth 100 000 USDT will pay or receive only 10 USDT for the settlement period.
It is necessary to clearly realize that values may differ somewhat for each instrument. For example, for Bitcoin, 0.1% is extreme. For some shitcoin, 0.1% may mean nothing at all; its funding norm is 0.5% and higher. Thus, the financing rate must be compared with the coin's average historical values.
Below is a basic understanding of funding values for Bitcoin in 2025.
Neutral zone: 0.01%. By and large, the market is in a consolidation zone.
Increased interest: up to 0.05%. Holding longs is still comfortable, but you need to be on alert.
Euphoria: More than 0.05% and above. The market is leveraged to the limit. A reversal is possible.
Panic: -0.05% and below.
Why Funding Reflects Market Sentiment
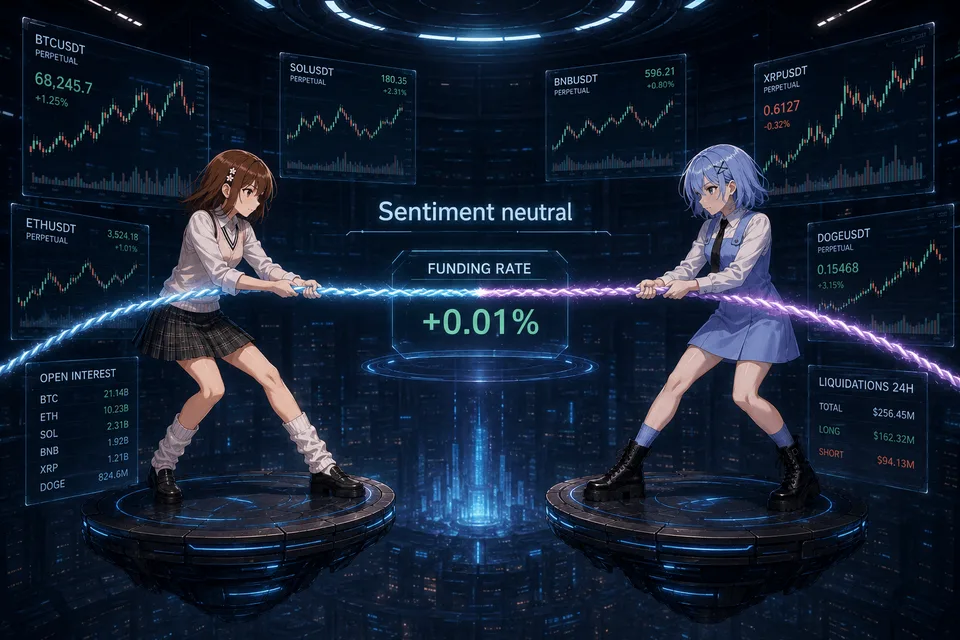
Funding essentially shows which side of the market is experiencing greater discomfort.
If most participants are confident in further growth, they continue buying futures even at a higher price. This leads to an increase in positive funding.
If, however, the market broadly expects a decline, the number of short positions increases, and the rate becomes negative.
Therefore, funding can be viewed as a kind of indicator of market consensus.
But here an interesting feature arises.
When almost everyone has already taken one side of the market, there are fewer and fewer new buyers or sellers left. It is precisely at such moments that the probability of the trend slowing down or even reversing increases.
Funding as a Leading Signal
Beginner traders often use funding incorrectly.
They reason like this: “Funding is high, so everyone is buying, so I should buy too.” But this kind of logic often leads to buying almost at the very top of the move.
Experienced traders interpret extreme values differently. Very high positive funding means:
the market is overloaded with long positions;
most participants already expect further growth;
a significant share of buyers has already entered the market;
any negative move may trigger mass closing of buyers’ positions.
Similarly, strongly negative funding indicates the market is overcrowded with short positions.
That is why extreme funding values are often viewed as a warning of a possible pullback or even a reversal, rather than as trend confirmation. But everything depends on the market phase.
Where to View Funding Values
Current and historical funding rates are available both on cryptocurrency exchanges themselves (in the perpetual futures card) and on specialized analytics platforms.
For most traders, the optimal choice for quickly getting the funding rate value is TLAP, because here you can quickly assess the situation across several exchanges at once and compare current rate values with historical ones.
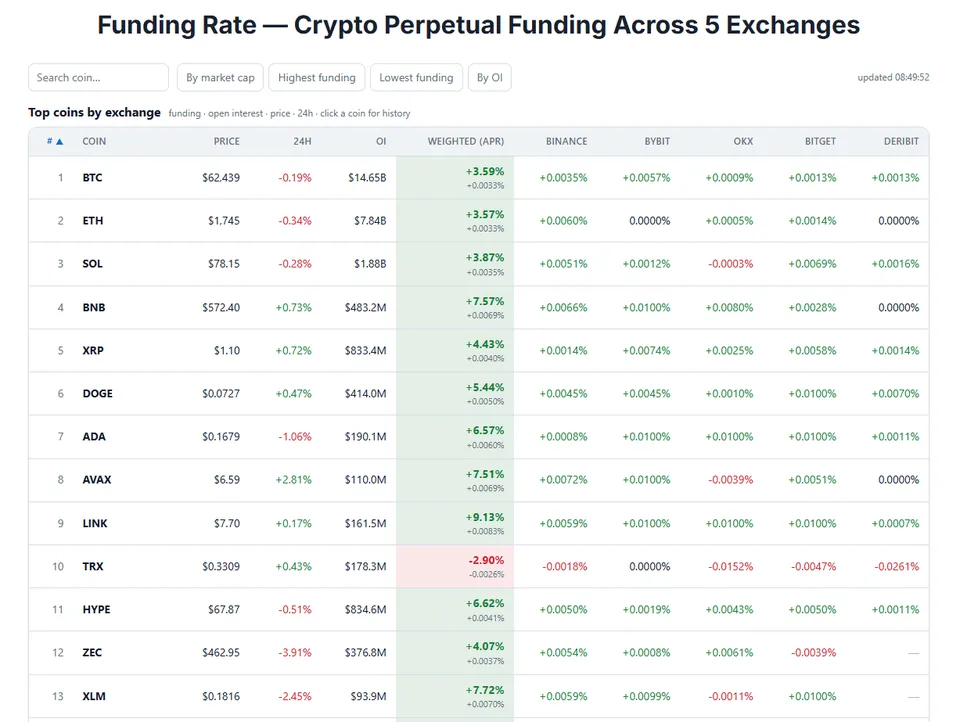
TLAP collects rates from five exchanges at once — Binance, Bybit, OKX, Bitget, Deribit — into one table for top coins by market capitalization.
The tool shows the following data.
Rate for each exchange — the current funding for the coin.
Consolidated OI-weighted rate — a single market rate that accounts for the open interest of each exchange.
Annualized rate — a rate normalized to the year with different calculation intervals.
Open interest, price, and 24h change — market context next to the rate.
Clicking a coin opens the funding rate history. The histogram on the right shows how funding changed over time and where it reached extremes (based on Binance data). On the left are the current rate, the predicted estimate of the rate value, the annual average value, as well as open interest and the funding rate update time for each exchange.
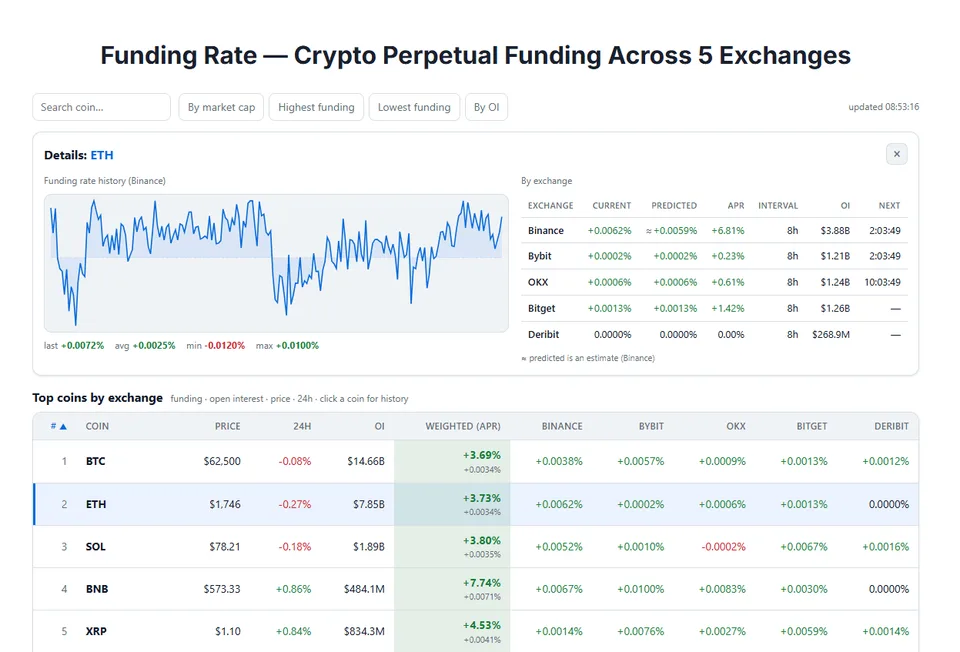
The tool allows you to quickly assess funding rate dynamics and carry out the corresponding analysis of the market situation with regard to the funding value.
Why Funding Alone Is Not Enough
Extreme positive funding means that most participants prefer long positions and are ready to regularly pay to hold them. But you cannot conclude from this that the market will necessarily fall soon.
During a strong bull trend, high funding can persist for weeks. The price keeps rising, while attempts to open shorts only because Funding is high end in liquidations.
The same applies to shorts. The price can fall for a very long time on extremely high negative rates. Simply because holding shorts is profitable. And it does not matter how much holding them costs.
Funding answers only one question: which side of the market currently has the greatest confidence. But other indicators help determine how justified that confidence is.
Funding Analysis for Making a Trading Decision
Application for Closing a Trend Position
Let us imagine a situation. Solana has been rising confidently for several weeks. The price is updating highs. Positive news prevails. Social networks are overflowing with forecasts of further growth.
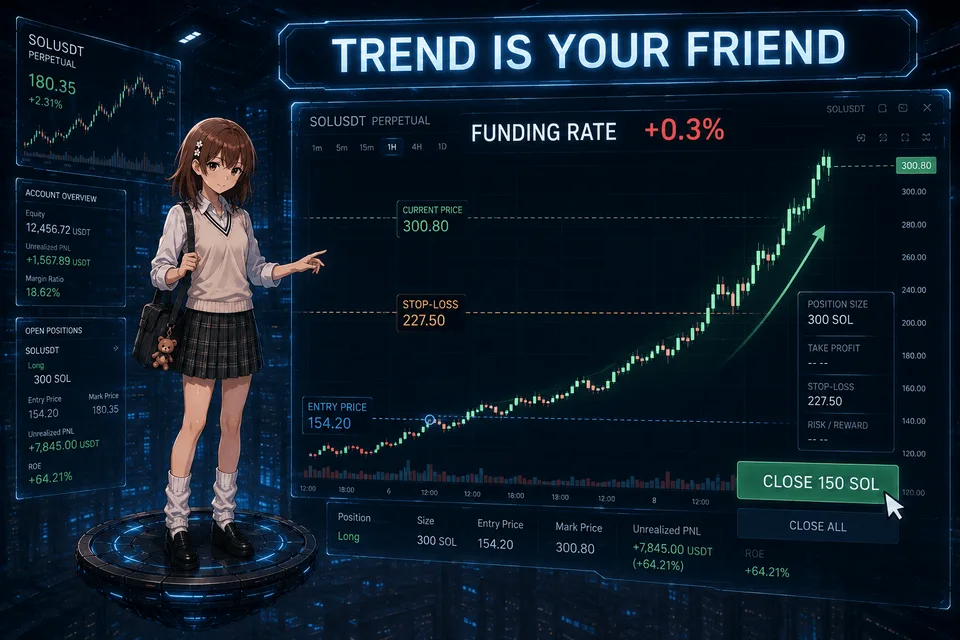
At the same time, the funding rate significantly exceeds its usual values, but this, as we know, still does not mean that the market will reverse immediately. However, the probability of the move continuing without a substantial correction gradually decreases.
For a trader who is already in a long position, such a situation may become a signal that it is necessary to:
tighten the stop-loss;
partially take profit;
reduce the position size;
stop opening new buys.
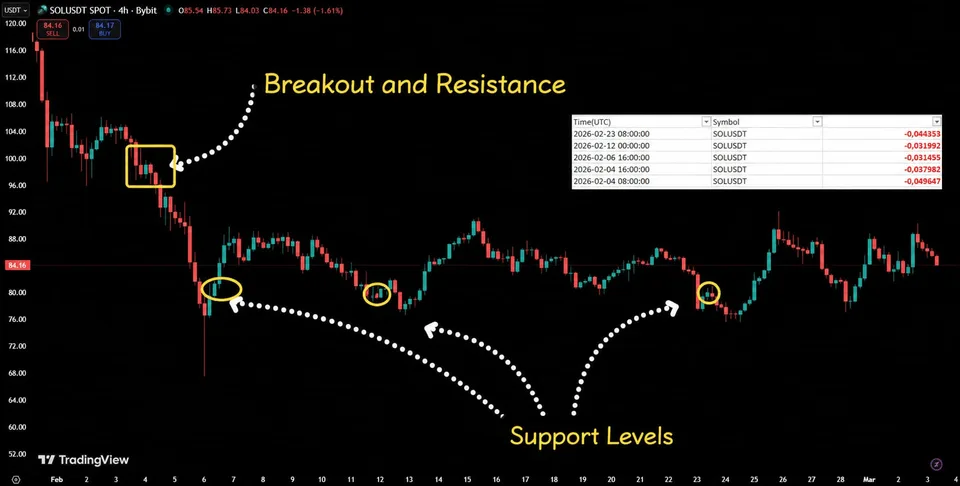
In the image above is SOL, but already in a short impulse. Extreme funding on March 4, 2026, works here not as a reason for an immediate buy, but as an indicator of the continuation of a strong move.
Using Funding to Find Countertrend Trades
Countertrend trading is considered one of the most difficult strategies.
High or low funding by itself should never be the reason for opening a position against the market, but it can show where the probability of a reversal becomes higher than usual.
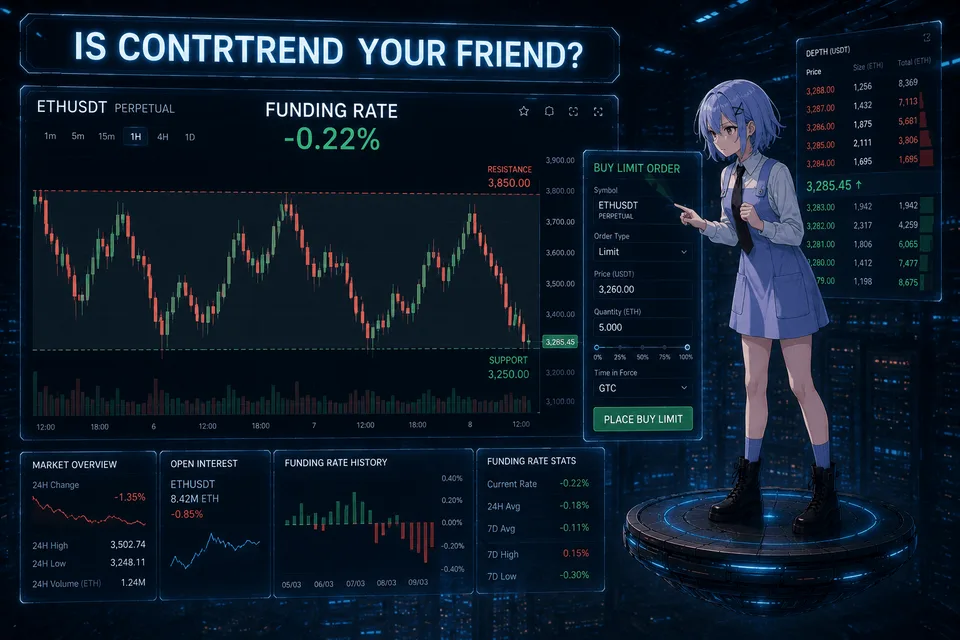
Searching for countertrend trades with the help of funding analysis works well in ranges (consolidations).
When the upper boundary of the range is reached, funding usually rises, and one can look for an entry point into a short. Conversely, when the lower boundary of the range is reached and funding reaches high values, one can look for buys.
In any case, first the trader notices extreme funding near the boundary of accumulation.
After that, he looks for additional confirmations:
a slowdown in growth or decline;
the appearance of reversal candlestick patterns;
a decrease in volume;
divergences on indicators;
signs of profit-taking by large participants.
Only after confirmation appears can opening a countertrend position be considered.
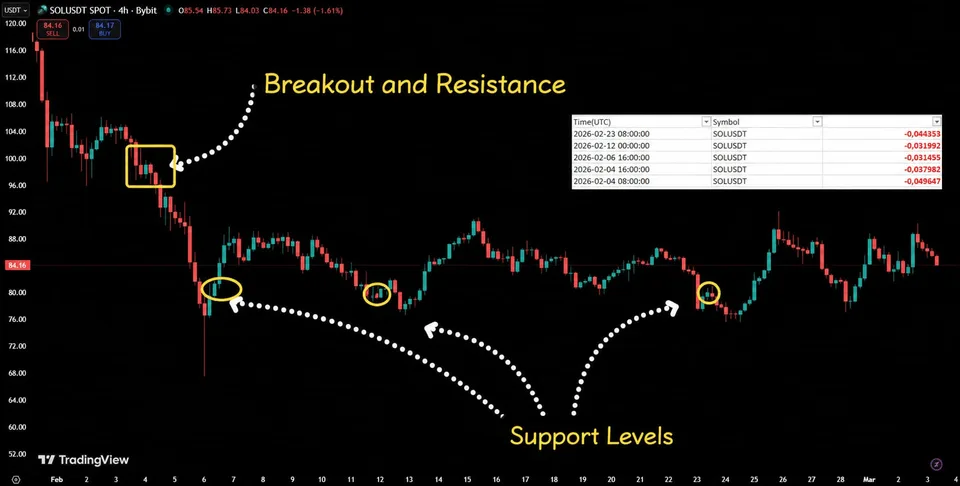
In the image above is SOL. High funding on March 4, 12, and 23, 2026, works here as a signal for searching for a countertrend trade.
Thus, funding becomes a filter that helps understand where the crowd may become too confident in being right.
Why You Cannot Trade Only by Funding
Funding is not an independent trading signal. As we have already said above, high positive funding can persist for several days in a row. And during a strong bull market, it sometimes remains high for weeks while the price continues to update highs.
The same is also true for negative funding during panic sell-offs.
Funding is best viewed as an indicator of market overheating, which starts working only together with analysis of price, volumes, open interest, and market structure.
A Few Words About Funding Arbitrage
In addition to being used as an indicator, funding can be an independent source of income.
The classic strategy is called funding arbitrage.
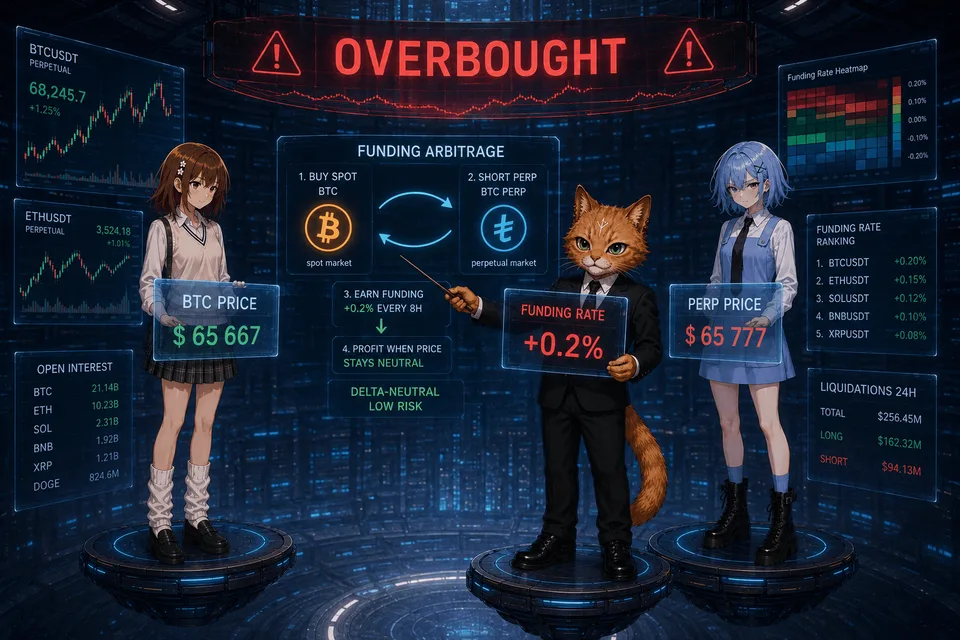
A trader simultaneously buys an asset on the spot market and opens a short position of the same volume on the futures contract. If the funding rate is positive, he regularly receives payments from holders of long positions, while changes in the market price have almost no effect on the overall result, since profit on one position is offset by a loss on the other.
Despite its apparent simplicity, such a strategy requires taking into account fees, rate sizes, liquidity, collateral requirements, and the risk of changes in funding itself. Therefore, arbitrage is usually used by professional market participants or algorithmic funds capable of quickly reallocating capital between exchanges and instruments.
You can read more about funding arbitrage in our article.