
MAGMA Indicator: a new look at liquidity analysis and finding strong price levels
Most traders build trading decisions based on the historical price chart. Support and resistance levels, trend lines, moving averages, oscillators, and other technical analysis tools are used for analysis.
However, all classic analytical systems have one common feature: they analyze market movement that has already happened. And that is no longer enough.
Modern traders, especially scalpers, make decisions based not only on technical analysis. For some time now, analysis of order distribution in the Order Book has become the foundation of scalping. It is the concentration of limit orders that often determines where price will slow down, reverse, or, conversely, accelerate after a level breakout.
The order book (DOM) has proven itself well on traditional and crypto exchanges, but what should Forex traders do, since Forex is an over-the-counter market?
Fortunately, there is a solution here too: every self-respecting broker provides an aggregated order book of its clients. At the same time, unlike the exchange order book, DOM on Forex shows not only limit orders, but also stop orders.
What MAGMA is and why it is needed
TLAP has long had convenient indicators available that allow full analysis of the Forex order book:
But it is not always convenient to analyze the market situation in three windows at once. Therefore, the TLAP team developed a new indicator for full analysis of the Forex order book — MAGMA.
The MAGMA indicator offers a combined approach to currency market analysis.
The main feature of MAGMA is that it shows not just volume clusters, but structurally significant zones while taking into account their position relative to the current price. Levels near the price carry more weight than distant ones, and market noise is filtered out, so only significant zones remain on the chart, not simply the “fattest” rows of the order book.
As a result, the trader receives three types of levels:
support — areas of high buyer concentration;
resistance — zones where sellers prevail;
counter-levels — areas capable both of stopping and reversing price movement and, in case of a breakout, becoming the place where price shifts into momentum.
Each level receives a strength rating on a scale from 0 to 100, which makes it possible to quickly identify the most significant zones.
How MAGMA differs from ordinary support and resistance levels
In a regular order book, order cluster levels are visible that are placed at levels or near support and resistance levels.
Recall that classic support and resistance levels are built from historical price highs and lows. This approach works well in calm market conditions, but it has several limitations:
a level becomes visible only after the movement has formed;
it is impossible to determine the real strength of buyers and sellers;
identical price levels can have completely different liquidity.
Instead of analyzing candles that have already formed, the MAGMA indicator evaluates the distribution of limit orders in the Forex order book and determines where maximum market pressure is concentrated.
Thanks to this, the trader receives information not only about where price has already been, but also where the potential interest of large participants is located, i.e., where the market may stop the movement or confirm it.
How the indicator works
The basis of MAGMA's operation is order book analysis.
For each price level, two values are known:
volume of buy orders ( Buy );
volume of sell orders ( Sell ).
However, simply comparing these volumes is not enough. An order placed several points away from the current price has a significantly smaller impact on the market than an order located directly next to current quotes.
Therefore, MAGMA uses a distance weighting system.
Step 1. Calculating net pressure
For each level, the net pressure indicator of buyers and sellers is calculated:
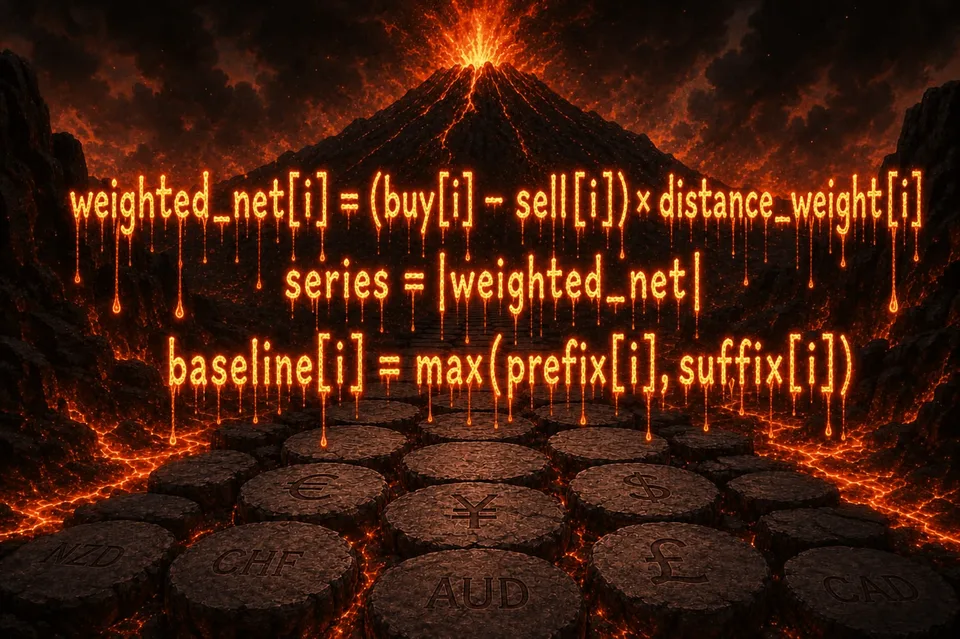
weighted_net = (buy − sell) × distance_weight
where
distance_weight = 1 / (1 + |i − price_idx|)
The closer the level is to the current price, the higher its influence on the final result. Distant levels receive less weight in calculations.
In other words, MAGMA considers not only the volume of orders, but also their practical significance for the current market movement.
Step 2. MAGMA Transformation (Heat)
After calculating weighted pressure, the indicator moves on to building the so-called liquidity heat map.
First, the absolute pressure value is calculated:
series = |weighted_net|
Next, two sequences of accumulated values are built:
prefix = Σ series
suffix = Σ series
They reflect the total pressure above and below each price level.
Step 3. Finding the equilibrium point
For each level, the baseline value is determined:
baseline = max(prefix, suffix)
In effect, the algorithm assesses which side of the order book has a greater impact: buyers or sellers.
Then the minimum value is taken as the balance point, after which the remaining values are centered relative to it.
This approach makes it possible to determine not just the largest volumes, but specifically the areas where the maximum concentration of liquidity is observed relative to the overall order distribution.
Step 4. Eliminating false levels
One of the problems of order book analysis is the presence of large single orders.
Sometimes one very large limit order can create the impression of a strong level, although in reality there is no significant liquidity around it.
To avoid such situations, MAGMA performs additional data processing.
For the twenty largest levels, their own contribution is adjusted, so individual outliers stop dominating the calculations.
After that, the values are inverted, forming the Heat metric, a measure of the structural concentration of liquidity. A high Heat value means that a level is strong not because of one large order, but due to the combined pressure of many market participants.
Step 5. Selecting the Strongest Levels
After the calculations are completed, the indicator selects the most significant heat price areas.
Top 3 resistance levels (above price) — areas of seller pressure.
Top 3 support levels (below price) — areas of buyer pressure.
Top 3 counter-levels — areas where the order book structure does not match the classic distribution.
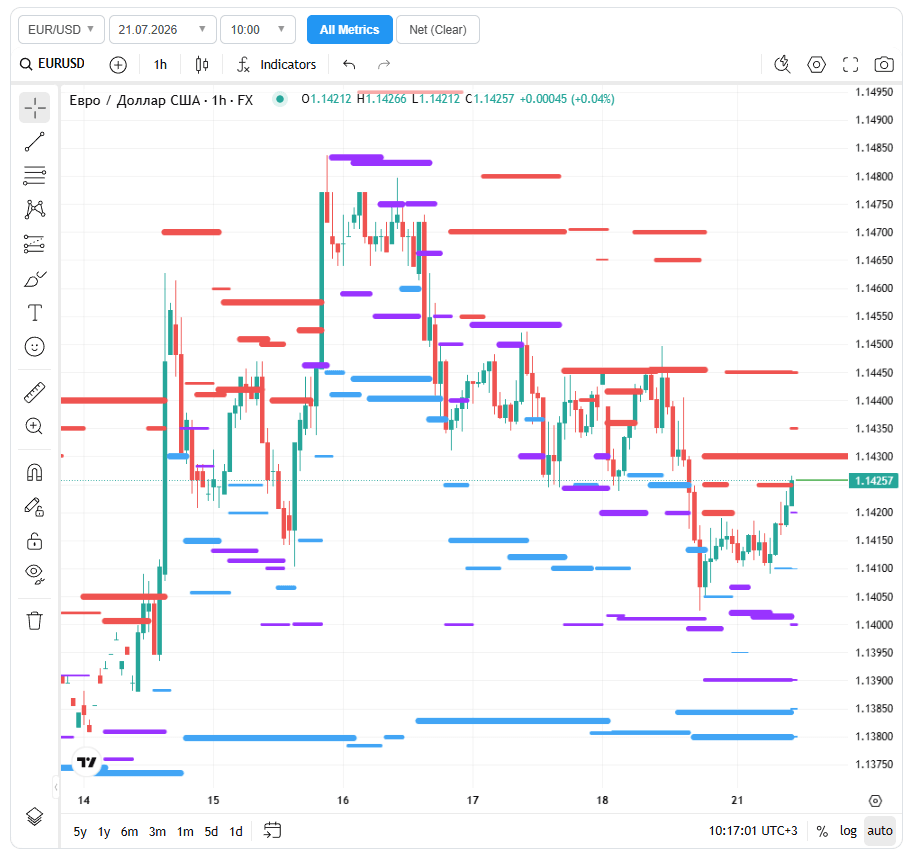
Then the values are normalized on a scale from 0 to 100, where 100 corresponds to the strongest level in the current order book. The level color depends on its direction: red denotes resistance, blue denotes support, and purple denotes a counter-level.
The resulting model makes it possible to analyze not only the current location of liquidity, but also its structure.
Unlike classic indicators based on price history and a linear interpretation of order book data, MAGMA shows areas where the probability of a market reaction is objectively higher due to the concentration of participants' orders. This makes the indicator a useful tool both for independent analysis and as a filter when using traditional trading strategies.
Three Types of MAGMA Levels and Their Meaning
One of the main advantages of MAGMA is that the indicator does not generate buy or sell signals on its own.
Its main task is to show the trader areas where the probability of a price reaction is significantly higher because of the concentration of pending liquidity.
The “fatter” the level (the higher the value from 0 to 100), the greater the probability of a reaction.
🔴 Resistance levels (red)
Located above the current price. These are areas where sellers are concentrated in the order book. When approaching these levels, an upward movement may slow down, stop, or reverse.
When price approaches resistance, a trader may expect:
a slowdown in growth;
the formation of a correction;
a reversal;
a false breakout followed by a return below the level.
If the market confidently overcomes strong resistance and consolidates above it, this may indicate the emergence of a new impulse and a change in the balance of power between buyers and sellers.
🔵 Support levels (blue)
Located below the current price. Buyers are concentrated here.
When price approaches such a level, several scenarios are possible:
a slowdown in the downward movement;
the formation of a local reversal;
position accumulation by large participants;
continuation of the upward trend after the correction is completed.
🟣 Counter-levels (lilac)
These are zones where buys above the current price and sells below the current price are concentrated in the order book. It sounds illogical, but this is exactly where their strength lies.
Counter-levels are places where buyers place limits above the market, expecting growth, and sellers place them below the market, expecting a decline. A breakout of such a level with consolidation is often a strong signal of an exit from consolidation and the start of an impulsive move.
On the other hand, these are exactly the zones where extreme stops or even trade-outs of a significant share of traders are often concentrated, which means counter-levels can act as extreme supports and resistances.
How to Read MAGMA on the Chart
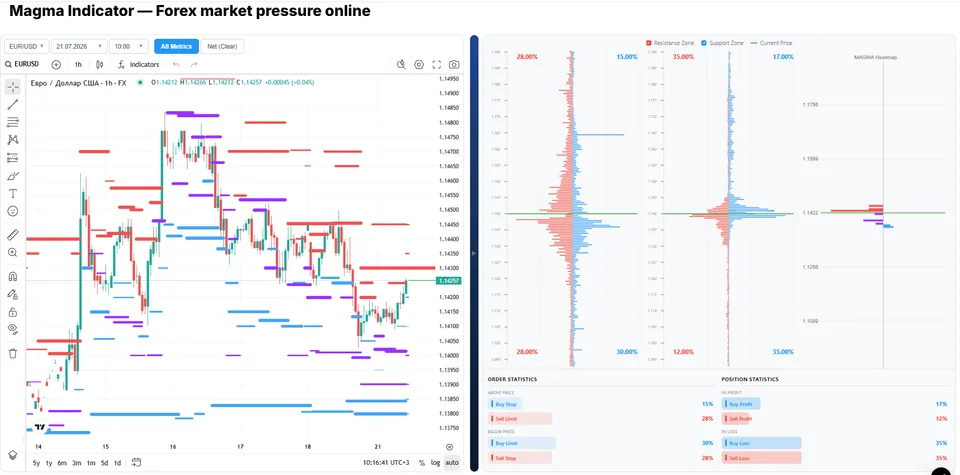
The standard MAGMA interface consists of two parts:
The main chart (on the left) is candles or bars with MAGMA levels plotted on them.
The right area contains three histograms: order book, open positions, and the MAGMA heatmap. The last histogram shows the concentration of pressure across the entire order book.
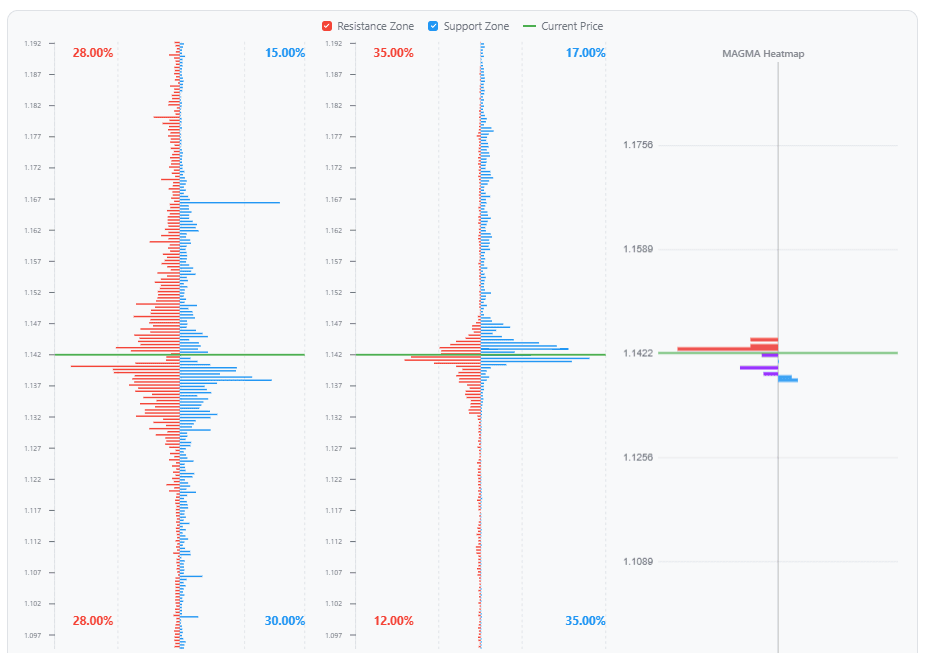
At the bottom right, key statistical data are shown in numerical format. These charts show data from the first two diagrams: the share of limit and stop orders, as well as the ratio of successful and losing trades.
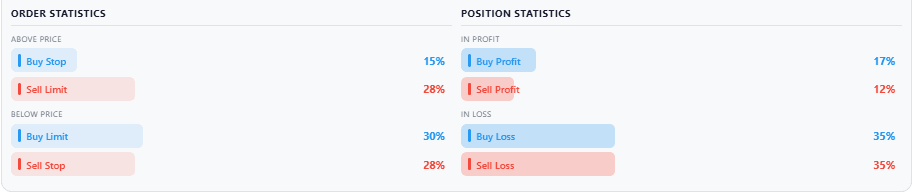
The sequence for analyzing the market situation is as follows.
Determine the current market phase: trend or consolidation.
Identify the strongest levels: the closer they are to price and the higher their volume, the more significant their impact.
Look at the counter-levels. Their presence and proximity to the current price may foreshadow an imminent impulse.
Strategies for Currency Analysis Using MAGMA
The chart on the right is interactive (TradingView). It allows you to combine the MAGMA indicator with classic technical analysis indicators.
Trend Trading Using MAGMA
One of the most effective uses of MAGMA is filtering signals from classic technical analysis.
Instead of opening a trade at every indicator crossover, the trader receives additional confirmation that the entry is being made near a truly significant liquidity level.
Strategy: EMA 50 + EMA 200 + MAGMA
The golden cross (EMA50 crosses EMA200) is one of the most popular trend strategies.
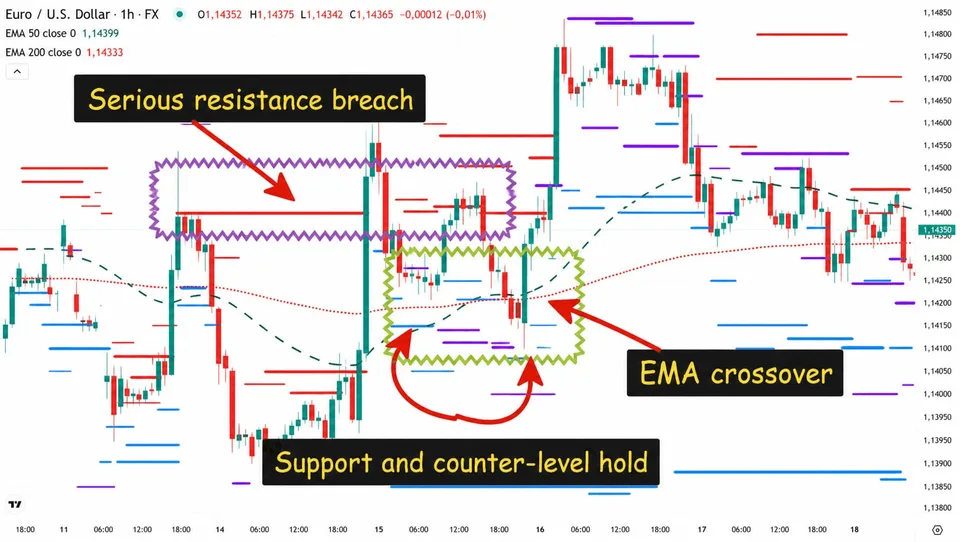
The chart above is the H1 chart of EUR/USD, July 15, 2026.
Buy Conditions
EMA 50 is above EMA 200.
The price remains above both moving averages.
A correction to the nearest MAGMA support level occurs.
A reversal candlestick pattern or confirmation from Price Action appears at the level.
The stop-loss is placed slightly below the MAGMA support level.
The trade target becomes the next strong resistance identified by the indicator.
The system works similarly in the opposite direction as well.
This approach makes it possible to open positions not after the impulse, but during its correction, which significantly improves the profit-to-risk ratio.
Strategy: Ichimoku + MAGMA
The Ichimoku indicator determines the direction of the global movement well, while MAGMA helps refine the entry point.
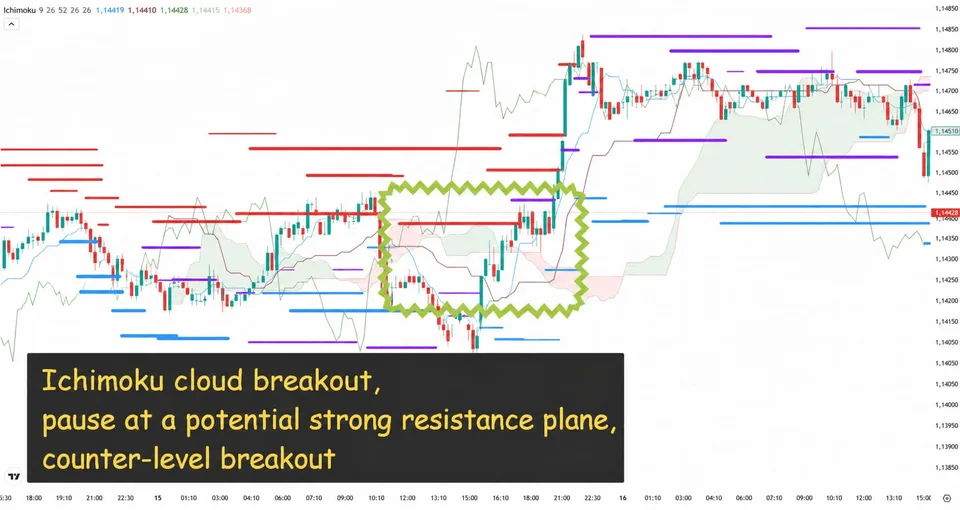
On the chart above is the M15 EUR/USD chart, July 15, 2026.
A buy is considered if:
the price is above the cloud;
the Tenkan and Kijun lines are directed upward;
the correction ends near the MAGMA support level, or the price has settled at resistance;
confirmation appears in the form of a bullish candlestick pattern.
Sell trades are executed under mirror conditions.
As a result, the trader receives two independent confirmations at once: the trend structure from Ichimoku and the high-liquidity area from MAGMA.
Trading in Consolidation
During sideways movement, the market often ignores trend indicators, so liquidity levels become especially valuable.
MAGMA makes it possible to determine where the next fluctuation within the range is highly likely to end.
Carefully watch the lilac counter-levels inside the range. If a counter-level appears near one of the borders and begins to be “pressed” by price, this may be a signal of an imminent exit from consolidation.
Strategy: Bollinger Bands + MAGMA
Bollinger Bands help determine the boundaries of the range, while MAGMA confirms the presence of liquidity.
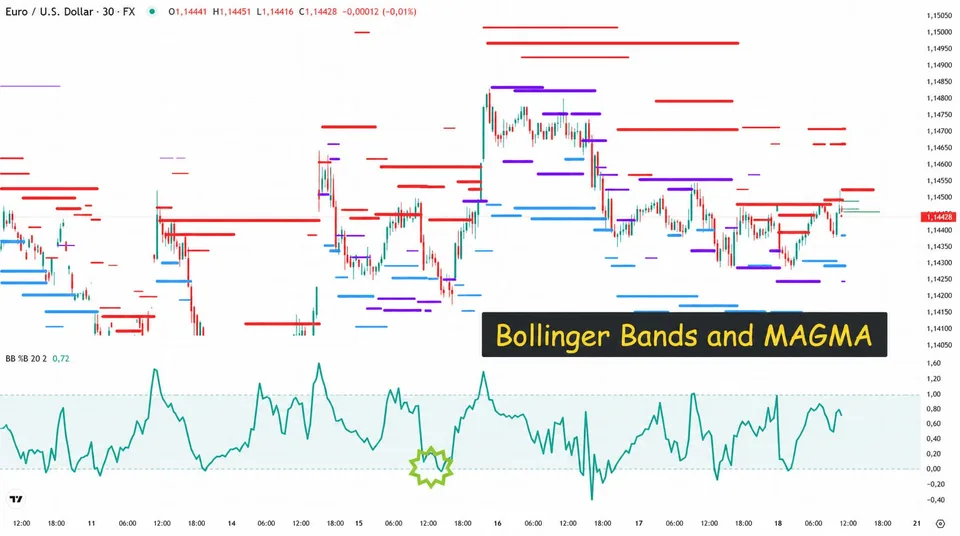
On the chart above is the M30 EUR/USD chart, July 15, 2026.
Buy
the price touches the lower Bollinger Band;
a strong MAGMA support level is located nearby;
RSI or candlestick analysis confirms the end of the decline.
Sell (can be found on the chart above)
the price reaches the upper band;
strong MAGMA resistance is nearby;
a reversal signal appears.
The coincidence of two independent factors at once significantly increases the quality of the trading signal.
Strategy: RSI + MAGMA
The RSI oscillator often forms signals too early. Using MAGMA can significantly reduce the number of false entries.
A buy is considered only when all conditions are met:
RSI is below 30;
the price has reached strong MAGMA support;
a reversal candlestick pattern appears.
A sell is executed in the same way.
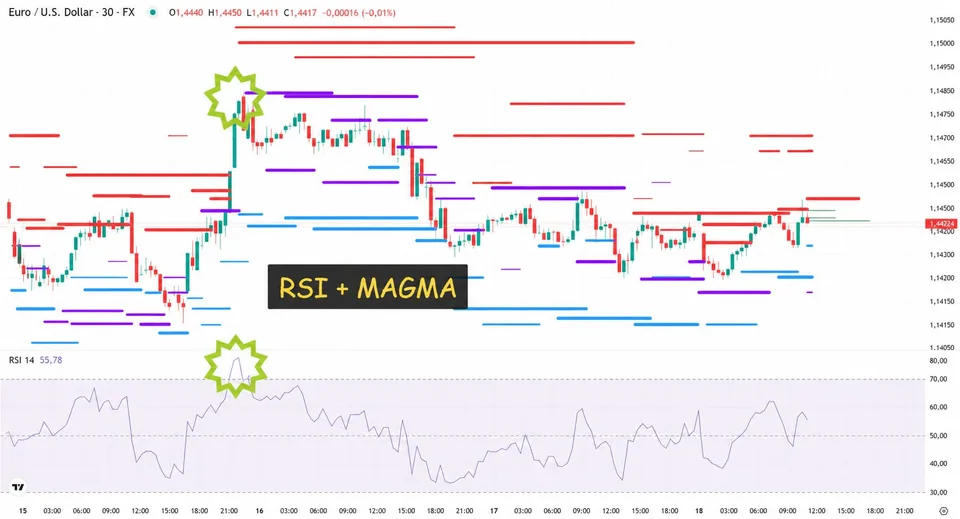
On the chart above is the M30 EUR/USD chart, July 15, 2026.
RSI is above 70;
the price has approached strong MAGMA resistance;
a downside signal is forming.
As a result, the trader trades not just an overbought or oversold state, but a combination of market inertia and real liquidity.
Practical Recommendations
To get maximum efficiency from the indicator, it is recommended to follow several rules.
Use MAGMA as a filter for trading decisions, not as the only source of signals. The most reliable signals occur when a MAGMA level coincides with a historical support or resistance level, a Fibonacci level, a round price, or a high-volume zone.
Do not open a trade just because the price touched a level. Wait for confirmation: a candlestick pattern, a breakout of the local structure, or a signal from another indicator.
In trend trading, it is preferable to look for entries from support levels in a rising market and from resistance levels in a falling one.
During periods of high volatility, for example when important economic news is released, the order book structure can change quickly. At such moments, indicator signals should be used with increased caution.
For intraday trading, it is recommended to combine MAGMA with analysis of the higher timeframe. If a liquidity level coincides with a key zone on H1 or H4, the probability of a strong market reaction usually increases.
Finally, do not forget about risk management. Even the strongest liquidity levels do not exclude the probability of a breakout. Therefore, every trade should be accompanied by a predetermined loss-limiting level and a reasonable position size.
Advantages and Limitations of the MAGMA Indicator
Like any market analysis tool, MAGMA is not a universal solution that guarantees profit in every trade.
Its main value lies in providing additional information about the liquidity structure that is unavailable to most classic technical analysis indicators. When used properly, MAGMA can significantly improve the quality of trading decisions made, especially if it is applied together with other analysis methods.

Criterion | Classic Levels | MAGMA |
|---|---|---|
Data Source | Historical extremes | Current order book (real orders) |
Accounting for Proximity to Price | No | Yes, weighting coefficient |
Noise Filtering | Weak | Powerful, outlier adjustment |
Counter-levels | No | Yes, as a leading signal |
Continuous Picture | Point zones | Heat map across the whole book |
Adaptability | Static | Updates dynamically |
Advantages of the Indicator
Analysis of Real Liquidity
The main difference of MAGMA is that the indicator analyzes not only the history of price movement, but also the current distribution of orders in the order book. This makes it possible to assess potential areas of buyer and seller interest even before the price reaches these levels.
This approach helps identify in advance the zones where the probability of a market reaction is significantly higher than when using only chart analysis.
Objective definition of level strength
Classic support and resistance levels are often built subjectively. Different traders may draw levels differently, obtaining different trading scenarios.
MAGMA uses a mathematical algorithm for processing order book data and assigns each level a quantitative score on a scale from 0 to 100. Thanks to this, it becomes easier to compare the significance of different levels and choose the most promising points for work.
Filtering false signals
One of the common problems of technical analysis is the large number of false entries. For example, a moving average crossover or an oscillator leaving the overbought zone does not always lead to the development of a sustained move.
Using MAGMA as an additional filter allows selecting only those signals that arise near areas with a high concentration of liquidity. This helps reduce the number of unjustified trades and improve the quality of trading decisions.
Versatility of application
The indicator is not tied to a specific trading system. It can be used:
in trend trading;
when working in price ranges;
in short-term intraday trading;
in swing trading;
as a tool for managing open positions.
In addition, MAGMA works well with most popular analysis methods: Price Action, support and resistance levels, trend indicators, oscillators, and volume analysis.
Simple visual interpretation
Despite the complex calculation algorithm, the indicator's results are presented in a clear form. Color marking of levels and their strength scale make it possible to quickly assess the market situation without needing to analyze large volumes of numerical data.
Indicator limitations

MAGMA does not forecast the market
The indicator does not try to predict the future price movement. It only shows the current distribution of liquidity and the most significant areas of interest among market participants.
The final decision to open a position should always be made taking into account the overall market picture, trend direction, fundamental factors, and risk management rules.
The order book structure is constantly changing
The market is a dynamic system. Large participants can change or remove limit orders, as a result of which the liquidity structure also changes.
For this reason, MAGMA levels should be considered a current assessment of the present market state, rather than static price benchmarks.
Comprehensive analysis is necessary
MAGMA demonstrates the greatest effectiveness in combination with other analysis tools. Using the indicator as the only basis for opening trades can lead to an increase in the number of false signals.
The optimal option is to confirm MAGMA levels with other factors:
the direction of the global trend;
candlestick patterns;
higher timeframe levels;
trend strength indicators;
volume and volatility analysis.