
Market Correlations: Stocks, Forex, Commodities, and Crypto

Anyone who has opened a trading terminal at least once has noticed strange coincidences: oil falls and the ruble weakens, Bitcoin rises and altcoins follow it, while the S&P 500 index falls and gold, by contrast, becomes more expensive.
This is correlation, a statistical relationship between assets that professional traders use every day.
Understanding correlations gives a trader truly good trading opportunities, although there is also a downside here: blind belief in established relationships without accounting for market context often leads to painful losses.
What correlation in trading is in simple terms
Correlation is a statistical measure showing how strongly the prices of two assets move relative to each other.
The correlation coefficient ((Investopedia, “Correlation Coefficient”) takes values from -1 to +1:
+1 means assets move almost identically. For example, when the price of WTI oil rises by 2%, ExxonMobil shares most often rise as well. Another example: Bitcoin falls together with the stock market.
0 means there is no relationship. For example, it is very difficult to find a correlation between the price of orange juice and Apple shares.
-1 means a classic example is EUR/USD and the dollar index DXY: when the dollar strengthens, the euro falls, and vice versa.

In practice, the correlation coefficient rarely reaches extreme values, and traders focus on the following ranges (often found in CME Group materials and Murphy's book on technical analysis):
0.7 … 1.0 means a strong positive relationship
0.3 … 0.7 means a moderate relationship
-0.3 … 0.3 means there is no relationship or an extremely weak one
-0.3 … -0.7 means a moderate negative relationship
-0.7 … -1.0 means a strong negative relationship
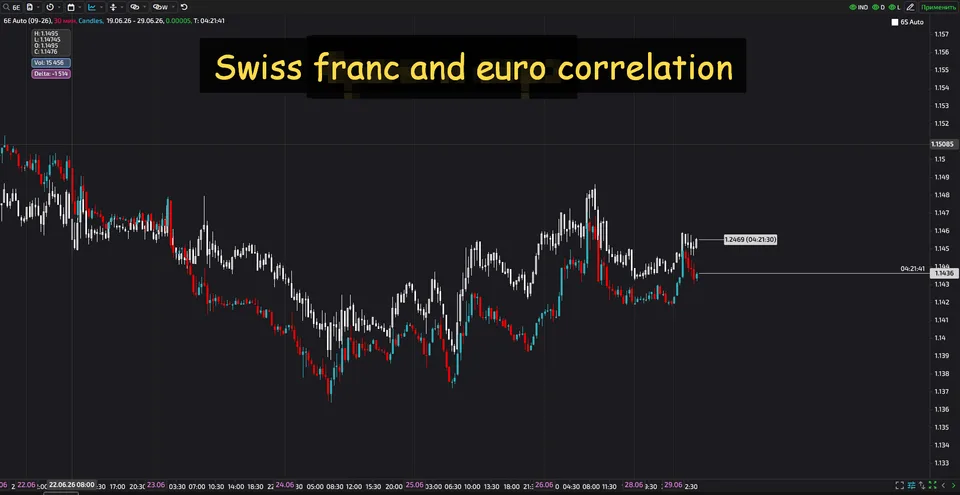
It is important to understand that correlation does not mean a cause-and-effect relationship. It only shows how assets moved together in the past. In the market, this relationship can change. One example is the correlation of the euro and the Swiss franc: once it reached 0.99, and now it has fallen on average to 0.8-0.85.
Why correlations arise in forex and other markets

Correlations appear because different markets react to the same economic factors:
central bank interest rates;
inflation;
economic growth;
commodity prices;
investors' risk appetite (Risk-On / Risk-Off);
geopolitical events.
For example, when investors are willing to take risks (Risk-On mode), stock indices, technology company shares, many cryptocurrencies, and currencies of commodity countries usually rise. During panic (Risk-Off), money often moves into defensive assets, i.e. the US dollar, government bonds, and gold.
These patterns are described in detail in studies by the Bank for International Settlements (BIS).
Main types of correlations in markets

Correlations in the Forex market
The currency market is literally permeated with stable relationships, because each currency pair has two national economies “built into” it, with their commodity, debt, and monetary features.
The triple relationship of EUR/USD, USD/CHF, and DXY. The Swiss franc traditionally has a strong negative correlation with EUR/USD. When the euro rises against the dollar, USD/CHF usually falls. This happens because EUR/USD accounts for more than 57% of the weight in the dollar index (DXY). According to BabyPips, the correlation coefficient between EUR/USD and USD/CHF in 2020–2023 often reached -0.90 and even -0.95.
Commodity currencies and raw materials. The Australian dollar (AUD) is strongly tied to iron ore and copper prices, the Canadian dollar (CAD) to oil, and the New Zealand dollar (NZD) to dairy products. For example, the correlation between the USD/CAD pair and WTI oil futures often has a stable negative value of about -0.7: when oil becomes more expensive, the Canadian dollar strengthens and USD/CAD falls (CME Group, “FX Correlation Analysis”).
Defensive currencies (JPY, CHF) and stock markets. The Japanese yen and Swiss franc often strengthen during moments of panic in stock markets. A stable negative correlation between the S&P 500 index and USD/JPY was observed during periods of flight from risk (risk-off).
Correlations in the stock market
Within the stock market, correlations work at the level of sectors, indices, and individual securities.
Sector correlations. Technology company shares often move in sync, as do shares of the oil and gas or financial sectors. If Amazon rises, other growth stocks are highly likely to follow, but correlation decreases during reporting periods, when individual news comes into force.
“Factor” correlations. At an advanced level, beta-neutral relationships are identified: value stocks versus growth stocks, high volatility versus low volatility. But for beginners it is enough to remember: if you bought Apple, Microsoft, and Nvidia, your portfolio is not diversified; a loss on one security is highly likely to coincide with a loss on the other two.
The “oil-air carriers” correlation. Jet fuel prices are one of the main expense items for airlines, so rising oil usually puts pressure on carrier stocks, forming a negative relationship.
Futures correlations
Futures markets connect currencies, commodities, indices, and interest rates into a single whole.
Commodity futures and currencies. We already mentioned CAD and oil above. Similarly, natural gas futures (Henry Hub) can influence the ruble through export revenues, although the connection here is less direct because of non-market exchange-rate formation in certain periods.
Index futures and bonds. The classic “risk appetite” relationship: when Treasury yields rise (bond prices fall), technology stocks sensitive to the discount rate often decline. The correlation between the Nasdaq-100 index and 10-year Treasury futures (in price/yield form) can become sharply negative during periods of Fed policy tightening.
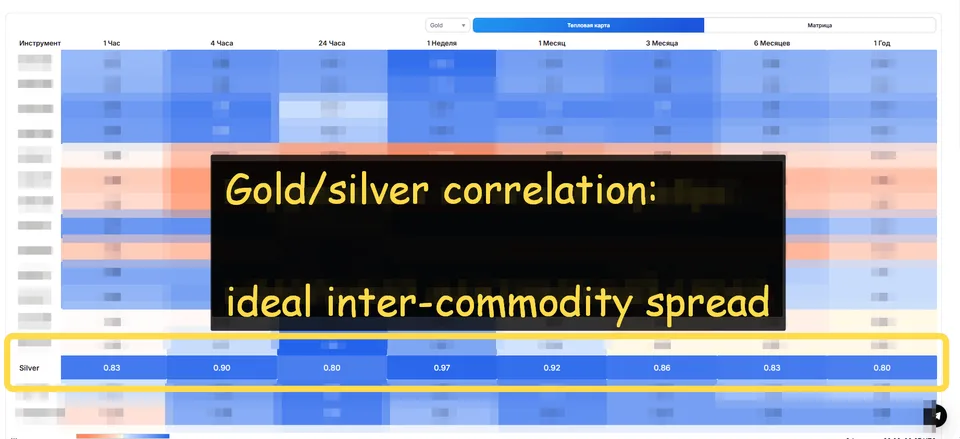
Inter-commodity spreads. Gold and silver have a historically high positive correlation (often above 0.8). Traders use the gold/silver ratio as a macro indicator: when it is abnormally high, a correction is possible due to silver rising ahead of gold.
Correlations in the Crypto Market
Cryptocurrencies, contrary to early expectations, did not become an uncorrelated safe haven.
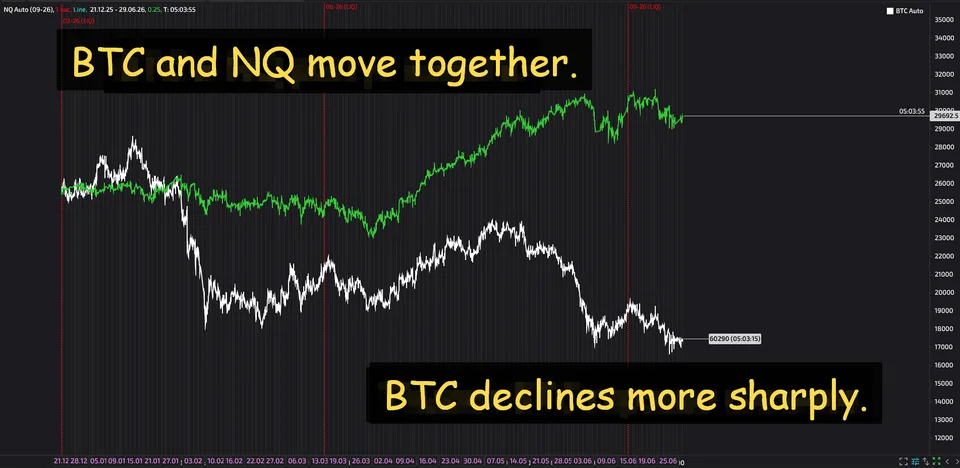
Although in the early years of the crypto market Bitcoin moved relatively independently, the situation changed from 2020 onward. Bitcoin began to correlate much more strongly with the U.S. technology sector, especially with the Nasdaq 100 index.
Since then, Bitcoin's correlation with the Nasdaq-100 index has periodically reached 0.6-0.7, especially at moments when one narrative dominates the market (for example, "risk assets rise amid a soft Fed policy"). However, this relationship is unstable: during periods of crypto-specific events (an exchange collapse, regulatory news), the correlation can quickly fall to zero.
In turn, the relationship with gold remains weak and unstable, while dependence on the dollar is also low.
Strong dependencies are observed within the crypto market.
Bitcoin and altcoins. BTC sets the tone for the entire market. According to CoinMetrics data, the correlation coefficient between BTC and ETH rarely fell below 0.75 throughout 2022-2025. During sharp sell-offs, this figure tends toward 0.9 and above: "all boats sink in a storm."
Stablecoins and the dollar. Here the correlation is almost perfectly positive due to the peg, but this is a separate topic of arbitrage and trust in the issuer.
How to Profit from Correlations: Practical Strategies

Portfolio Diversification (Risk Reduction)
The first way to make money is not direct income, but preserving it.
If a trader sees that all assets have a positive correlation with one another, his portfolio is highly vulnerable. By adding instruments with negative correlation, he smooths the equity curve.
The classic structure looks as follows. A trader buys growth stocks + long Treasuries (during periods when this correlation is negative). A portfolio built with correlations in mind makes it possible to wait out drawdowns and avoid emotional selling.
Trading Correlation Pairs (Pairs Trading)
This is a market-neutral strategy also called pairs arbitrage. In pairs arbitrage, the trader simultaneously buys one asset and sells another that has a high positive correlation when their price spread diverges.
A simple example. Gold and silver are a highly correlated pair. Suppose the historical ratio of gold price / silver price = 80. Suddenly, due to short-term demand, the ratio jumps to 90. The trader sells the "expensive" gold (opens a short) and buys the "cheap" silver (long) in a proportion that neutralizes dollar risk. When the ratio returns to its average, the trade is closed at a profit.
Similar structures are built on pairs: EUR/USD - USD/CHF (using negative correlation, one-directional positions are opened), Coca-Cola - PepsiCo stocks, Brent - WTI oil futures.
Correlation as a Filter or Signal Confirmation
Experienced traders use "correlation confirmation."
For example, a trader trades AUD/USD based on a technical pattern. For confidence, he checks the behavior of copper and the New Zealand dollar. If AUD breaks resistance while NZD/USD and copper stand still, this is a "weak" signal, and the trade can be avoided. If the assets move aggressively in the same direction, then the potential trade gains clear prospects.
Leading Indicators (Intermarket Analysis)
Some markets "switch on" earlier than others because of differences in time zones or sensitivity.
Thus, the S&P 500 index futures trade almost around the clock. When the Asian session begins, it prices in the overnight moves of U.S. futures. Understanding the correlation between Nikkei 225 and S&P 500 makes it possible to prepare for the Japanese market open by watching the dynamics of the U.S. futures.
Here, profit is built on leading action: the trader enters a position in an asset that has not yet moved, relying on an already moved correlated instrument. It is important to remember that markets can diverge if local news appears.
Hedging (Position Insurance)
Suppose a trader has a large profit on stocks, but he does not want to realize it, although the market looks overheated.
A solution available to everyone: open a short position in a futures contract on an index with a high correlation to the portfolio, i.e. hedge the profit. This does not eliminate risk completely, but it helps reduce drawdown when the overall market falls.
This method is widely used by institutional players and is described in detail in CME Group educational materials.
The Main Risks of Trading Correlations
Any correlation strategy looks good on history, but the present, and especially the future, is always full of surprises. Here are the main risks of trading correlations that must be understood.
Correlation Constantly Changes
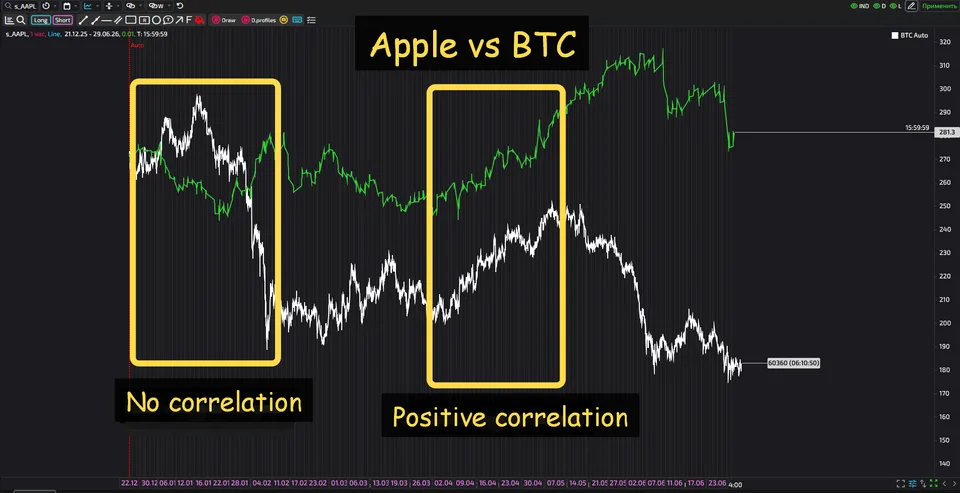
The correlation coefficient calculated over a one-year interval can change sharply within a week.
Thus, in 2008, the “stocks + Treasuries” diversification worked perfectly: they had a negative correlation. But in 2022 they fell in sync, destroying portfolios built on blind faith in an eternal inverse relationship. B
Another example. The FRED database (Federal Reserve Bank of St. Louis) shows that the rolling 60-day correlation between the S&P 500 and oil shifted from positive to negative dozens of times over the last 20 years.
So before entering any correlation trade, a trader needs to assess the rolling correlation over the last 20–50 trading days, not the 10-year average. This will help reduce risks.
False Correlations
There is a whole collection of amusing examples: the number of people who drowned in a swimming pool correlates with the number of films with Nicolas Cage, while cheese consumption correlates with the number of doctoral dissertations in engineering.
In trading, too, one can find this kind of relationship, which is completely random. Any correlation used must have a fundamental or stable market rationale.
The Danger of a “Perfect Hedge”
An attempt to hedge an equity portfolio with a short index futures contract is effective only with beta close to 1 and stable correlation.
If an equity portfolio consists of five technology giants, and the trader hedges it through a broad market index, in the event of a reversal “against technology” (for example, due to antitrust lawsuits), the equity portfolio will lose value faster than the index. In this situation, the hedge works less effectively.
Correlation “breaks” precisely at the moments when the trader counts on it the most.
Cryptocurrency “Surprises”
In the crypto market, the correlation of all altcoins to BTC creates an illusion of safety.
When the market falls, everything falls at once: a “diversified portfolio” of 10 coins behaves like a single position. Moreover, during crises (the FTX collapse in 2022), even stablecoins can lose their peg, breaking expected correlations.
Trusting correlations without accounting for counterparty risk is unacceptable.
The Psychological Trap of Doubling Losses
A trader sees that asset A has fallen, while correlated asset B has somehow not moved. Expecting it to “catch up,” he enters B with a large volume.
But if the divergence is caused by a fundamental shift (for example, a correlation break due to new regulation or a change in demand structure), the loss accumulates on both sides. This is a typical beginner’s mistake: averaging through correlation without a stop loss.
How to Apply Correlations Properly
Use a correlation matrix. There are many tools that show correlation relationships. TLAP allows you to track currency correlations for free. The indicator shows both the overall correlation of instruments over time (from an hour to a year) and the correlation of individual instruments with each other.
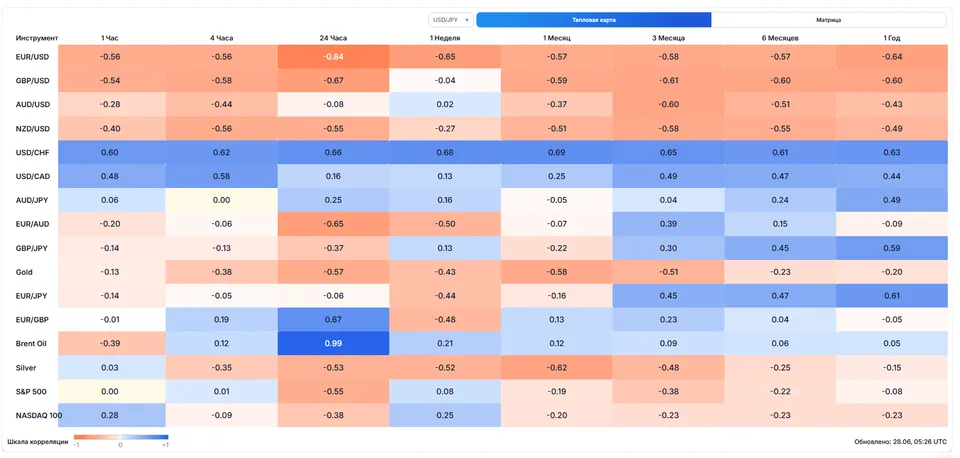
Check sources and the calculation period. Correlation over 1 year and over 20 days may show opposite signs. Be sure to look at daily or hourly rolling correlation.
Look for fundamental justification. It is necessary to clearly understand that the relationship is backed by economic logic (interest rates, commodity dependence, capital flows), not just a simple coincidence of charts.
Set a stop-loss. In pairs arbitrage, the spread stop should be both for the spread as a whole and for each instrument, in case of a sharp correlation break.
Do not overload the portfolio with highly correlated assets. Buying EUR/USD, GBP/USD, and NZD/USD at the same time is essentially one bet against the dollar. Risk management requires accounting for total exposure, not the number of trades.