
What Is Cryptocurrency Pair Arbitrage and How to Make Money from It

Statistical arbitrage (stat-arb) is a broad class of trading approaches based on finding recurring statistical patterns between assets. Such patterns may include regression between prices, factor deviations, PCA patterns, clustering, and so on.
The simplest and most accessible version of statistical arbitrage for a beginner trader is pair arbitrage, also known as pairs trading.
Pair arbitrage is a trading method that allows profit to be made from a temporary divergence in the prices of two related assets. In the crypto market, however, as in any other market, this strategy helps find opportunities to extract profit that are less dependent on market direction.
In this article, we will look at how to apply a pair strategy to crypto assets and review ready-made tools for pair arbitrage on TradingView.
A Bit of Theory

Statistical arbitrage is a quantitative strategy based on mathematical models and historical data analysis. Unlike classical arbitrage, which looks for a risk-free price difference in a single asset, statistical arbitrage works with probabilities. It identifies assets whose prices have historically moved in sync and bets on a return to their usual relationship after a temporary divergence.
Pair trading is a specific and the most popular version of this strategy. It involves simultaneously opening a long position in the lagging asset and a short position in the leading asset. If the pair is chosen correctly and their relationship is restored, profit will be made from the price difference, regardless of whether the overall market rose or fell.
In pair trading, a trader does not simply compare two prices, but builds a market-neutral position.
Key Concepts and Metrics of Pair Trading

The success of the strategy depends on several statistical indicators.
Correlation. Measures how synchronously the prices of two crypto assets move. For pair trading, traders look for pairs with a high positive correlation (usually above 0.8).
Z-Score (Z-score) is the main decision-making tool within a pair trading strategy. The Z-score shows how far the current gap (spread) between prices deviates from its historical average value, measuring this in units of standard deviation.
A high Z-Score (for example, >+2) means the spread is unusually wide and the pair has diverged. This is a signal to sell the overvalued asset and buy the undervalued one. In turn, a low Z-Score (for example, <-2) is a signal for the opposite trade. A Z-Score near 0 indicates that prices are in balance and positions can be closed.
Volatility is important for correctly calculating position size. Asset A may have one set of volatility readings, while asset B may have another. Therefore, positions opened within a pair arbitrage strategy are often balanced with the beta hedging coefficient (β) in mind so that the trade remains market-neutral.
β answers the question: "How many units of asset B need to be taken to offset the movement of asset A?"
If, for example, BTC rose by 1%, then ETH historically rises by 1.5% on such a move. In this case, the "fair" hedge is long 1 BTC against short 1.5 ETH, not 1 to 1.
Without β, the spread will "wander" together with the market, the strategy will cease to be market-neutral, and that means the trader will be trading direction rather than relative value.
Cryptocurrencies: Opportunity and Trap for Pair Arbitrage

The cryptocurrency market offers a number of obvious advantages for pair arbitrage, including a wide range of instruments, flexible execution, and 24/7 trading.
One of the main advantages is that here it is a little easier than on conventional exchanges to find assets suitable for pair trading. In addition, unlike traditional exchanges, not every asset is traded by bots that close the resulting spread within seconds.
But the crypto market has its own risks, which often outweigh the advantages.
Very high volatility and frequent correlation shifts significantly complicate the construction of a reliable statistical model. If we add low liquidity on altcoins to this, resulting in serious slippage and wide spreads, the picture becomes completely bleak.
Pair Arbitrage Models for Cryptocurrencies
A Simple Pair Arbitrage Model

The idea of the model is very simple: there are two assets, A and B, that have historically moved "together" (correlated or cointegrated). The trader only needs to find the spread, the ratio, normalize it, and start trading the deviations.
Let us consider a practical pair arbitrage model using two highly correlated assets as an example: Bitcoin (BTC) and Ethereum (ETH).
Step 1: Choosing the Pair and Analyzing Correlation
First, let us make sure the assets are statistically linked. For BTC/ETH, the correlation in the past was usually 0.8-0.9, which makes them good candidates for building a simple model.
Step 2: Calculating the Spread
We do not simply compare prices (BTC ≈ $60,000, ETH ≈ $3,000), but analyze the price ratio:
Ratio = BTC Price / ETH Price
Historically, this ratio fluctuates around the average. For example, if the average value over 90 days = 20, and the current value = 22, then ETH is relatively undervalued compared with BTC.
Step 3: Signals by Z-Score
The key indicator is the standardized Z-Score:
Z-Score = (Current_value - Average_value) / Standard_deviation
Z-Score Threshold Values:
- Z > +2: ETH is too cheap relative to BTC → Buy ETH / Sell BTC
- Z < -2: ETH is too expensive relative to BTC → Sell ETH / Buy BTC
- -1 < Z < +1: Close positions.
Trading Example
| Column 1 | Column 2 | Column 3 | Column 4 | Column 5 | Column 6 |
|---|---|---|---|---|---|
| BTC Price | ETH Price | Ratio | Z-Score | Action | |
| Normal | $61,000 | $3,100 | 19.68 | +0.5 | Wait |
| Divergence | $62,000 | $2,900 | 21.38 | +2.3 | BUY ETH / SELL BTC |
| Return | $61,500 | $3,200 | 19.22 | +0.2 | Close positions |
Profit = (change in BTC) + (change in ETH) in USD. In this example:
- Sold 0.0161 BTC ($1,000) at $62,000, bought at $61,500 = +$10
- Bought 0.3448 ETH ($1,000) at $2,900, sold at $3,200 = +$103.
An Almost Professional Version of Pair Arbitrage

To evaluate the correlation of different trading instruments for the purpose of using a pair arbitrage strategy, it is necessary to perform a professional calculation of the hedge ratio β.
The hedge ratio β can be calculated using OLS regression (ordinary least squares), using log prices.
For cryptocurrencies, it is better to use log prices rather than regular ones: they work correctly with percentage changes, which means β is interpreted as elasticity, and the model will be more robust under strong volatility (which is a must-have for crypto).
The choice of timeframe depends on the trading type: intraday — 5m / 15m; swing — 1h / 4h. For learning, it is better to choose 1h, since there is less noise on this TF.
Lookback window: 100-300 bars is aggressive, 300-500 bars is more stable. In cryptocurrencies, it is better to use a rolling window (the model is trained on a fixed time interval and tested on the next period, then the window is shifted forward), rather than a fixed one.
OLS regression is the basic and most common way to calculate β. After finding the standard deviations, β can be calculated:
β = Standard deviation of asset A / Standard deviation of asset B
Example for BTC/ETH:
- Standard deviation of BTC daily returns = 3.5%
- Standard deviation of ETH daily returns = 4.2%
- β = 4.2 / 3.5 = 1.2.
This means that ETH is 20% more volatile than BTC, and this should be taken into account when determining position sizes.
In real trading, β is not constant, and it needs to be recalculated periodically: short-term β is calculated over 20-30 days (sensitive to recent moves), medium-term β is calculated over 60-90 days (a balance of stability and relevance), long-term β is calculated over 200+ days (maximum stability).
After determining the β hedge ratio, the spread is built and the Z-score is calculated.
Indicators and expert advisors for pairs arbitrage on TradingView

Earlier, we reviewed the Arbitrage Detector indicator, which calculates the spread well between the same asset on different venues. Here we will review the best indicator for pairs arbitrage — Cointegration Heatmap & Spread Table.
Cointegration Heatmap & Spread Table indicator
The Cointegration Heatmap & Spread Table indicator is probably the best solution available at the moment for finding suitable pairs. The indicator is marked as an Editors' picks on TradingView, views ≈ 14,825.
The indicator is aimed at deep statistical analysis: it calculates cointegration parameters between many tickers, visualizes a correlation matrix, builds spreads and Z-score, and shows trading signals.
Among the indicator's advantages are convenience, the ability to use it to search for arbitrage pairs, and high-quality statistics. The disadvantages stem from the advantages: it is heavy in calculations and requires time and resources to work with large lists.
The most important advantage of the indicator is that it is suitable for all asset classes: from stocks and ETFs to cryptocurrencies and currency pairs.
Indicator settings
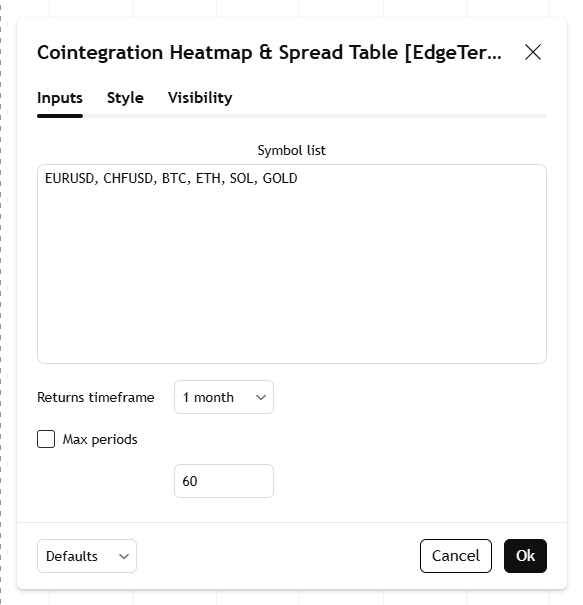
Symbol list: a customizable list of symbols separated by commas.
Returns timeframe: selecting the timeframe for the return sample (weekly or monthly).
Maximum periods: the maximum number of periods to limit the data to a specific time period and control the indicator's performance.
This indicator performs the following tasks:
- Identifies stable long-term relationships (cointegration) between assets using heatmap visualization.
- Tracks the spread — the difference between actual prices and the predicted linear relationship — between each pair.
- Generates trading signals based on deviations of the Z-score from the mean spread, helping traders understand when a pair is statistically overbought and is likely to return to the mean.
How to use the indicator
The indicator displays two very important "heat" tables: one in the center and the other on the right. After entering the symbols, the first thing you need to look at is the central table.
Any assets with a cointegration coefficient of 25% (0.25) require close attention, as they have a strong and stable relationship. Anything below this value is not suitable for pairs trading.
In addition, another important boundary is the 40% (0.4) level. Such assets most likely have a very strong interconnection.
The following instruments are used as an example: EURUSD, CHFUSD, BTC, ETH, SOL, GOLD.
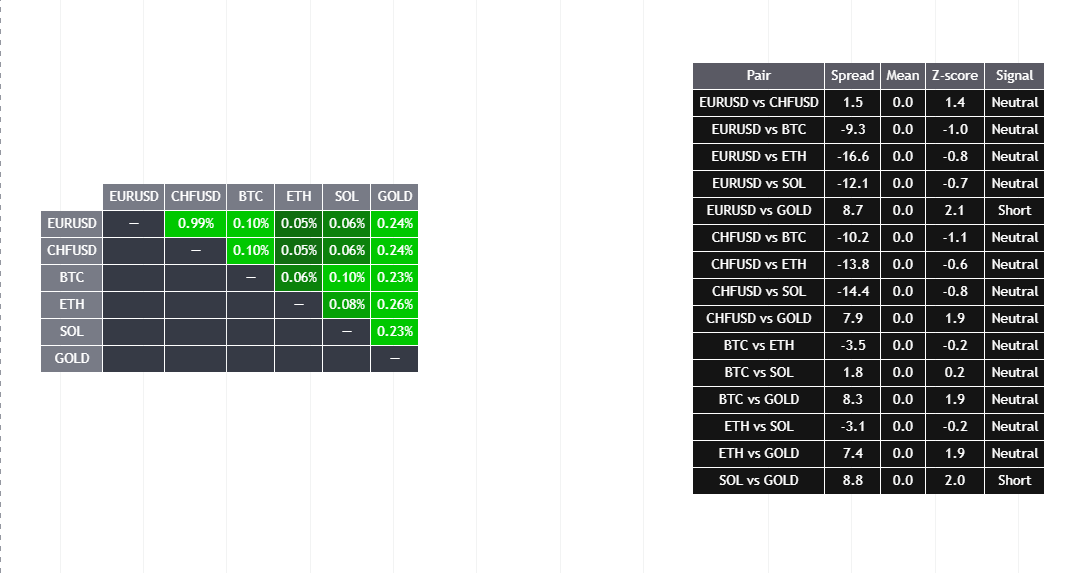
In the central table, we can see that gold has a certain correlation with both currencies and major cryptocurrencies (from 23 to 26%). Of course, the 99% correlation between the euro and the franc has not gone anywhere either.
In the right-hand table, we can see that there are arbitrage opportunities in the EURUSD vs GOLD and SOL vs GOLD pairs.
Z-Score Stat Trading Indicator
The Z-Score Stat Trading indicator is a powerful tool for quantitative analysis of two correlated assets. It calculates the Z-Score for the logarithmic price spread between any two selected symbols, providing both long-term and short-term Z-Score signals.
The key advantage of the indicator is that it provides buy / sell signals.
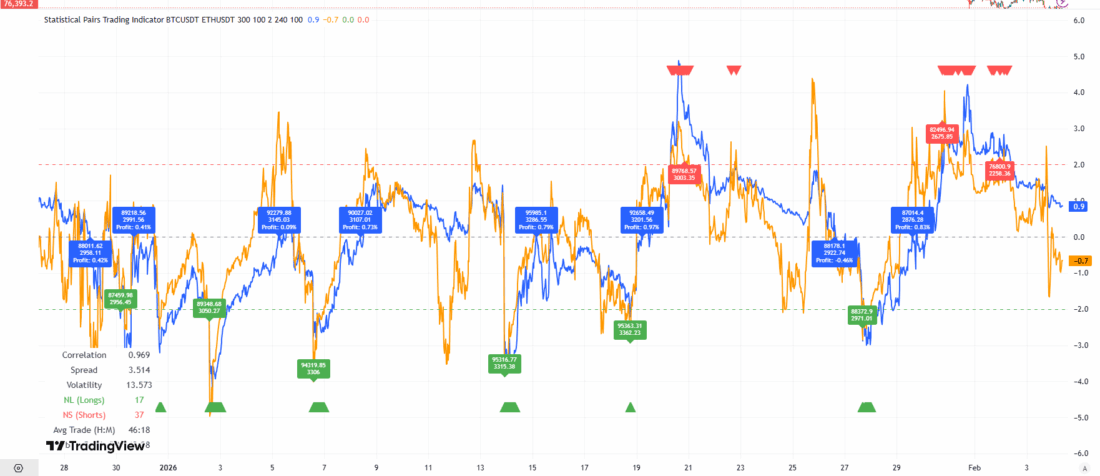
It is important to check the information table (bottom left on the chart) for correlation, volatility, the spread, as well as the number of long (NL) and short (NS) signals over the last 1000 bars.
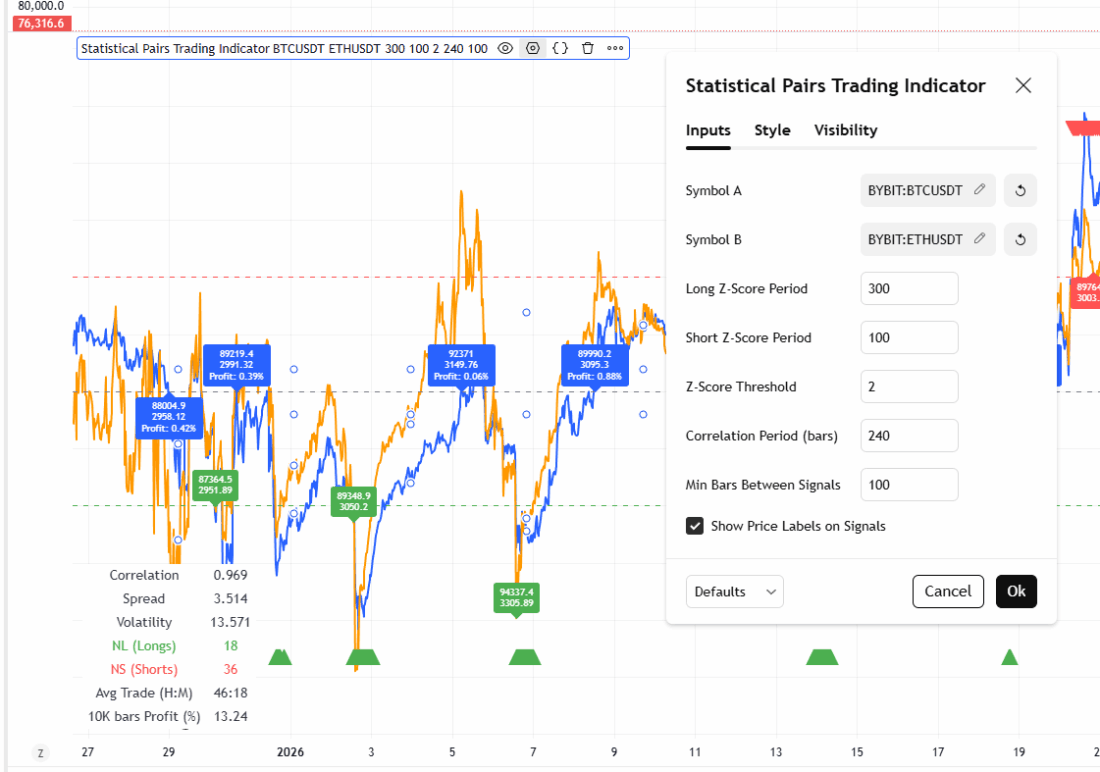
How to use the indicator:
Long signal (🟢) occurs when both Z-values fall below the negative threshold (for example, -2). In this case, you need to buy symbol A and sell symbol B and wait for the spread to return to the mean value.
Sell signal (🔴) occurs when both Z-values rise above the positive threshold (for example, +2). In this case, you need to sell asset A and buy asset B, again waiting for a return to the mean value.
The information table helps quickly assess the frequency of signals and the current statistical relationship between the selected assets.
Conclusion

Pairs arbitrage is an intelligent and potentially effective strategy, but not a fast path to easy profit. A beginner trader needs to remember that pairs arbitrage is trading the spread, not prices.
With proper setup, this strategy makes it possible to extract predictable profit from the temporary divergence of highly correlated assets.
Practical limitations of the model:
- commissions — frequent trades eat up profit
- time horizon — a return to the mean can take hours, days, or weeks
- correlation breakdown — if the relationship between the assets breaks, the model incurs losses
You can check pairs arbitrage opportunities on TradingView.
The Cointegration Heatmap indicator is better suited to research work/screening, while Z-Score Stat Trading is a practical tool for trading indicator signals after verifying the pairs.