
Impulse: How to Find It, Enter, and Exit

A to-the-moon rocket taking off or falling knives after a long flat? Are indicators ready to violate the laws of mathematics and move beyond the boundaries of overbought / oversold? This is price impulse.
Safe add-ons, positive averaging, successful pyramiding, entering with the whole deposit at maximum leverage and at the same time no drawdowns? All of this works in a price impulse.
Intraday traders are not being wiped out, there are no bull or bear traps, and profit grows rapidly when opening a trade anywhere? This also happens only in an impulse.
Below is the concluding article of the series devoted to the dream of any trader: impulse.
In the previous articles of the series, we examined the main markers of a transition into impulse from the balance of the higher timeframe and flat balances, the loading of liquidity, which in classical technical analysis take the form of continuation patterns.
In this article, we will gather together all the signs of an impulse and show what needs to be watched during its development from beginning to end.
The Place of Impulse in the Structure of the Market Auction
In traditional technical analysis, the market cycle is described as a two-phase structure consisting of trend and consolidation. Such a description does not provide a clear understanding of the structure of the market auction.
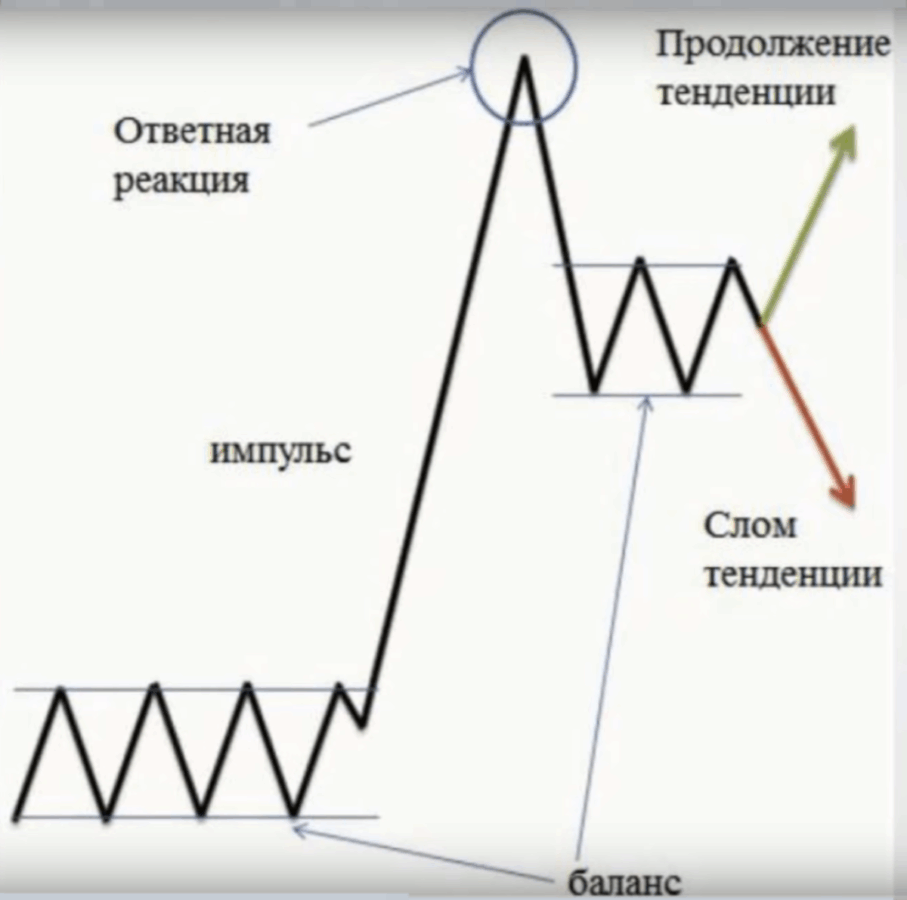
A complete market cycle (auction) consists of the following phases: impulse (trend) - fix (culmination, counterreaction) - balance (consolidation) - new impulse (new trend).
Why Is Impulse Considered the First Phase Rather Than Balance?
The reason lies in the fact that it is precisely from impulse that the formation of significant support / resistance levels begins, relative to which balance (consolidation) is formed. In addition, trading in new securities begins with an impulse, after which the balance of supply and demand is formed.
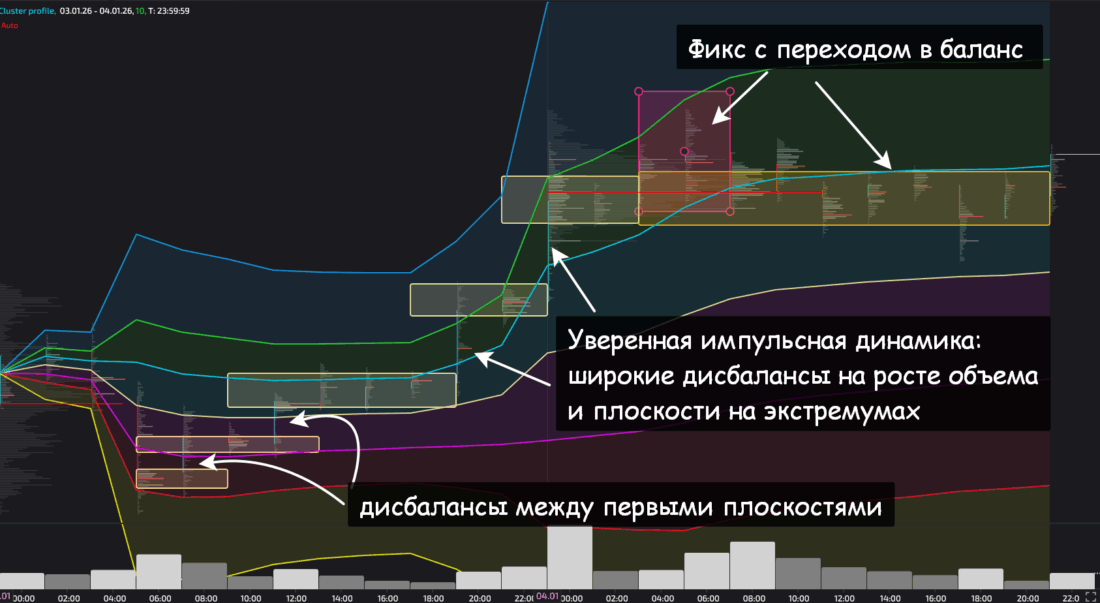
- Impulse is a rapid movement of the quote in one direction with short flat accumulations at the extremes. In an impulse, we usually see from three expansions with imbalances between them and from two aggressive horizontal accumulations after leaving the balance, very often without trading through the preceding imbalances.
- The last impulse expansion occurs after the slowing of the impulse and the presence of a relatively long accumulation of liquidity with trading through the penultimate expansion (often pre-fix).
- Fix (culmination) is a sharp return of the quote into the forming new balance. Most often it has an impulse-reversal appearance. The classic chart pattern is the formation of a true or false "Head and Shoulders" figure.In some cases, the culmination occurs without prior noticeable accumulation of liquidity (comparable to or even smaller than in the previous volume clusters in impulses). Then a true or false chart pattern of a "V-shaped reversal" is formed. In the case of impulse continuation, we can speak of a test of the accumulation and the start of new dynamics.A true or false "W-shaped reversal" is formed with relatively weak reverse dynamics in terms of the traversed range, but with increased vertical volumes in the counterreaction and prolonged work near the extreme. It is precisely this model that most often becomes corrective or reversal within the impulse on the higher TF.
- After the culmination, balance begins, in which liquidity is accumulated both for continuation of the main movement within the impulse of the higher timeframe and for a change of trend within the end of the impulse of the higher TF or the reaching of the boundaries of the balance of the higher TF.A change of trend is most often possible after the transfer of the POC into the zone of the new balance.
In a good impulse, each expansion with accumulation on the lower TF has the appearance of a full-fledged structure with a fix and a balance. In essence, we are talking about the fractality of the market.
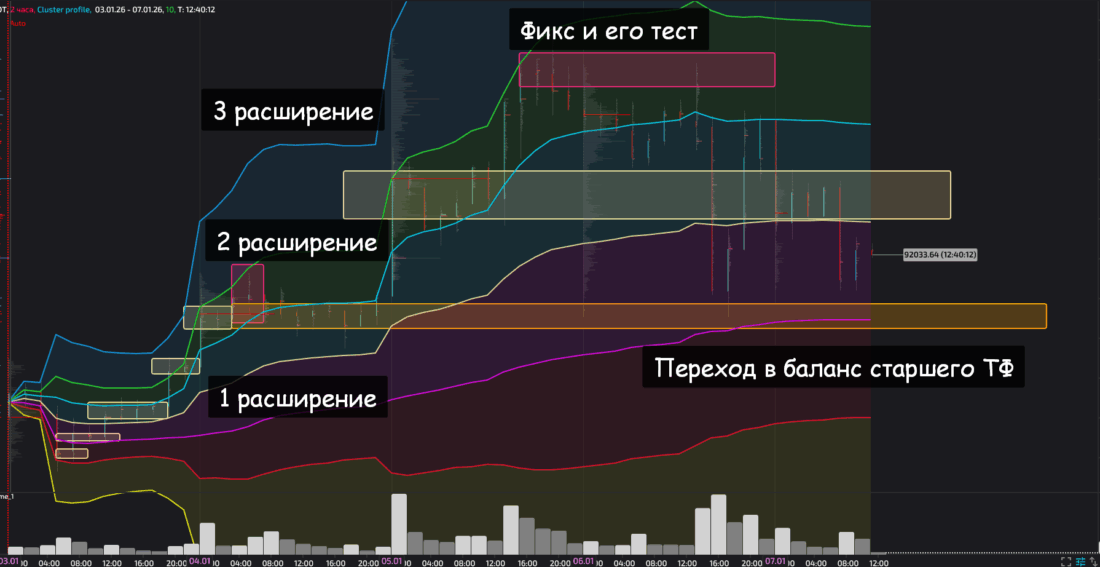
The image above shows the continuation of an impulse on a higher timeframe, in which we previously analyzed the first expansion. After the accumulation of liquidity, the second and third expansions were formed, after which a strong volatile fix began, which indicates a transition into the balance of an even higher timeframe.
The balance in the second expansion also has the appearance of a fix on the lower TF. Why a fix? Because, on the one hand, the trade-through back amounted to 61.8% by Fibonacci. On the other hand, there are imbalance zones in the opposite direction, which clearly indicates the weakness of buyers at the current moment in time.
The Main Markers of the Beginning of an Impulse and the Exit from Balance
Earlier, we already examined the features of volume positioning, i.e. the exit from balance into impulse. Therefore, below only in general terms.
Balance usually begins to form before the last expansion of the previous impulse. After the fix, a reverse movement occurs, and the players finally find a comfortable zone where supply and demand are generally balanced. Most often, this is the zone of volumes that were the last to be distributed within the impulse structure.
To determine the boundaries of the balance, we find the zones from which there was a reaction in the opposite direction. We highlight the most heavily traded clusters on both sides, as well as zones of price extremes where small volumes, if they pass, produce a clean reverse reaction.
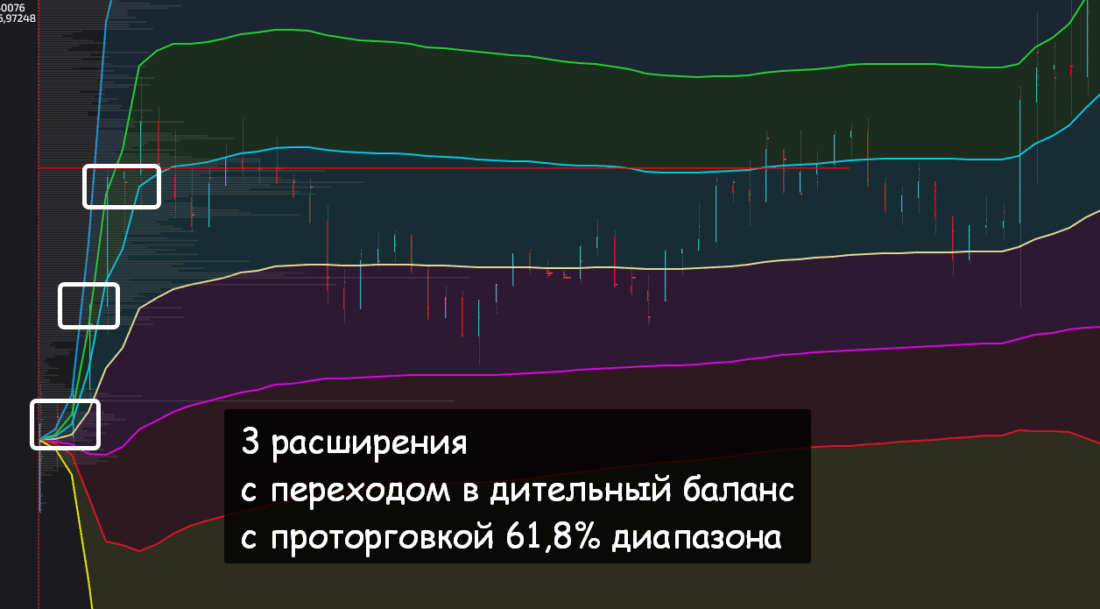
In a normal balance, from two to four touches of the high-low can be distinguished. Naturally, in long-term accumulations there may be many more, but then we are usually talking about a wide range, within which there may be quite interesting stories from the boundaries, as well as about the play of the higher timeframe (examples at the very end of the article).
Within balance, price extremes may be updated, but volume placements occur within rotations between support and resistance ranges. After the appearance of the second and especially the third extreme on both sides, watch for probable distribution in the opposite direction.
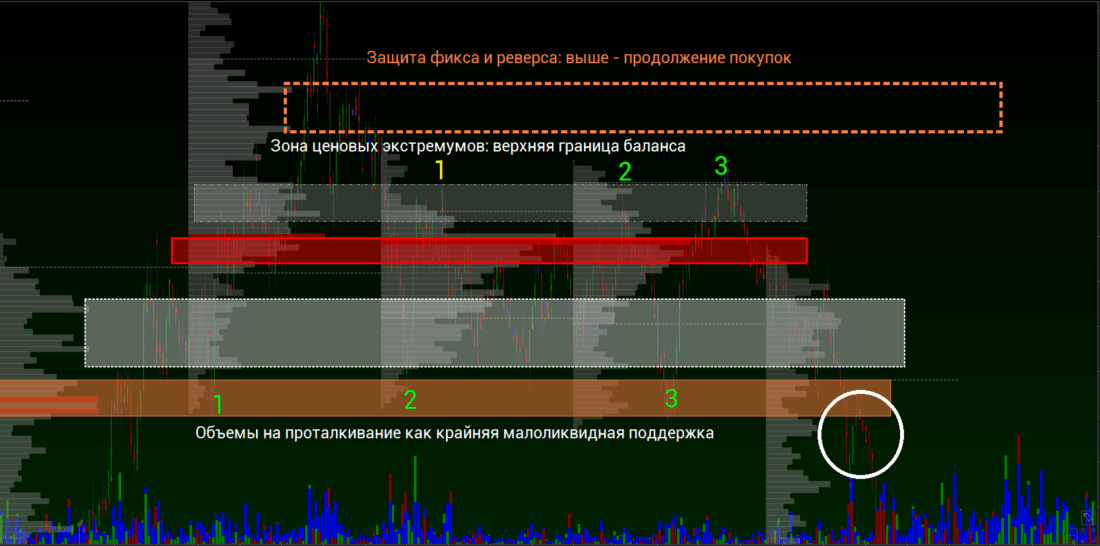
If after the second and even third reversal in balance there is no breakout with a transition into impulse, then you can look for an entry in the opposite direction.
A breakout is a breach of the balance on high turnover with acceptance below/above the zones of the extreme supports and resistances. After the breakout, wait for a test of the extreme support/resistance zones.
Searching for trade entry points from balance
- In the opposite direction from the extreme border of the balance after the 3rd touch, if there is no breakout with acceptance.
- If there is an imbalance in the movement inside a wide balance after the 3rd touch, at the moment of rapid volume accumulation in the zone below/above the most heavily traded part of the balance.
- On a breakout test (a potential 4th touch that became a breakout) and volumes on the breakout of the extreme demand or supply zone. It does not happen every time.
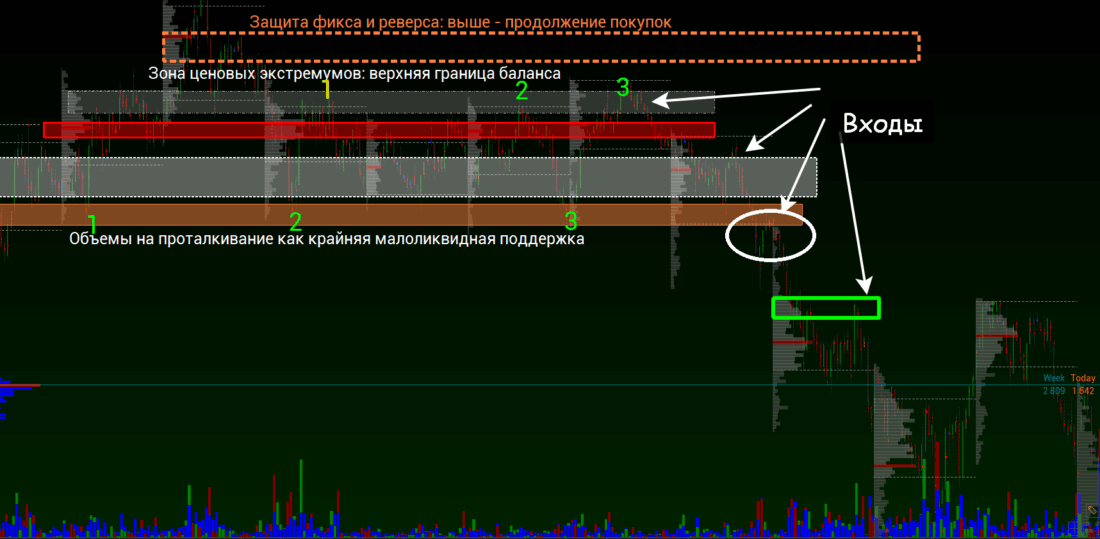
The most reliable is the third entry, because this is an entry already after the appearance of a confident signal of a transition into impulse.
A reliable signal of preparation for an exit from balance is the rocking of the quote within the boundaries of the balance, obvious swings.
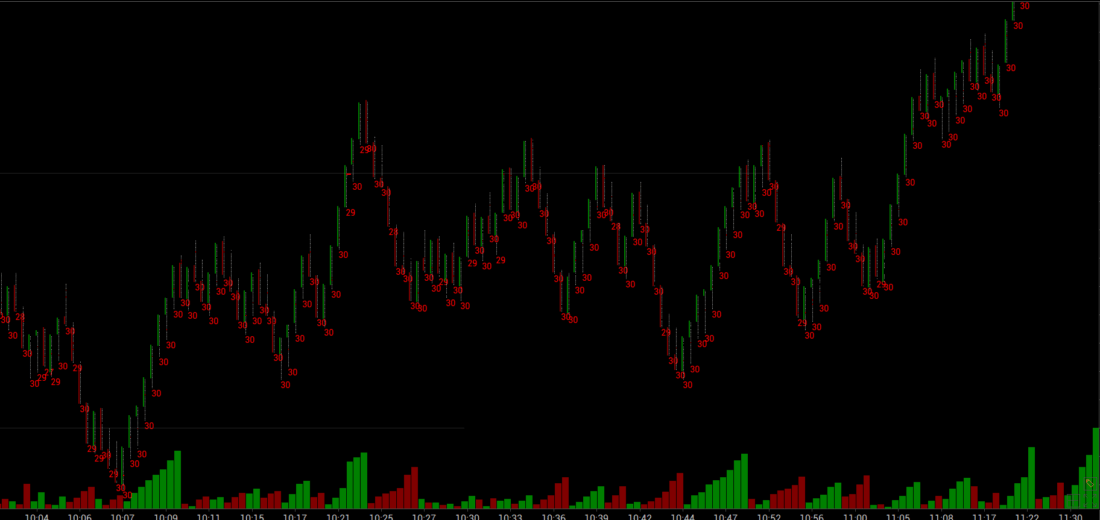
They are characterized by a sharp change in dynamics inside the balance, movements from border to border are fast and generally unexpected. At the same time, the Weis Wave indicator suggests who is pressing on the quote and from whom money is later taken away.
Main characteristics of impulse movement
The first impulse expansion usually occurs still inside the balance, and it can be spoken of confidently after a certain flat loading above/below resistances/supports. This is a very general point.
Such a breakout can sometimes be identified already in the balance (remember the three touches), and sometimes the understanding comes after the breakout.
In the example above, the first flat was still in the balance, and hypothetically they could have held the lower borders and returned to the highs with a transition into impulse (4th touch and breakout) already in the other direction.
The subsequent breach (exit from balance) was characterized by a test of the support zone from below, but the move away was very fast, and there was no time to make a decision. And the movement itself was essentially an expansion.
After the expansion at the extreme, pure fast loading began according to all the rules. The key point: throwing volume onto the extreme, its further distribution in the direction of the impulse, a test of this volume to start new dynamics. In such micro-accumulations, local resistance is broken already on the 2nd, at most the 3rd touch, and they give a clear passage range, which is often equal to the range of the move from the balance breakout.
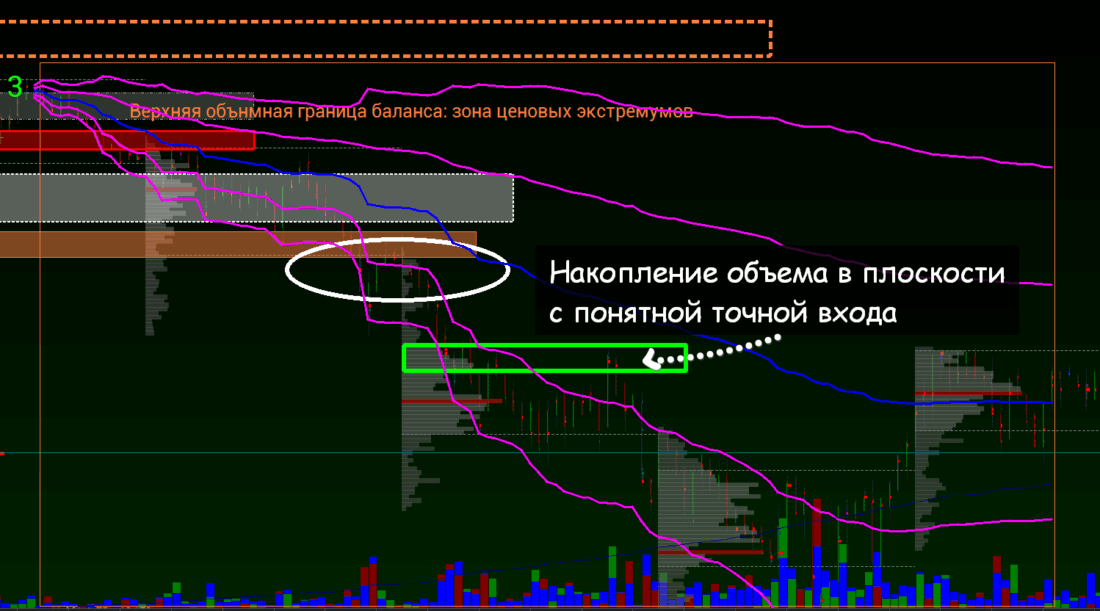
To be confident that the quote has moved into impulse, it is necessary:
Build AVWAP from the point where the dynamics start. The start of the dynamics is not a price extreme, but precisely the start from the opposite border of the balance with the presence of flat loadings. In the impulse phase, VWAP has a directional look: it shifts together with the price. It is good if a small accumulation of volumes occurs at the start of the impulse.
While the quote is in balance, a test of the mean is possible. After the exit from balance, the movement is fast, and entry points are found at the 1 deviation of VWAP (in the example above, this is the -1 deviation).
When liquidity is loaded in the middle of the impulse, the first deviation may be broken with an incomplete test of the mean, but usually not beyond the 0.5 deviation (in our case -0.5). In the example above, the liquidation test for pushing was that very touch of the -0.5 deviation from VWAP.
In a good impulse, the movement goes between the 1 and 2 deviations.
If the quote moves near the 2nd and 3rd deviation, then this may be a sign either of stop collection with later accumulation of reversal volumes at the extreme, or simply a sign of strong reverse dynamics for trading the expansion.
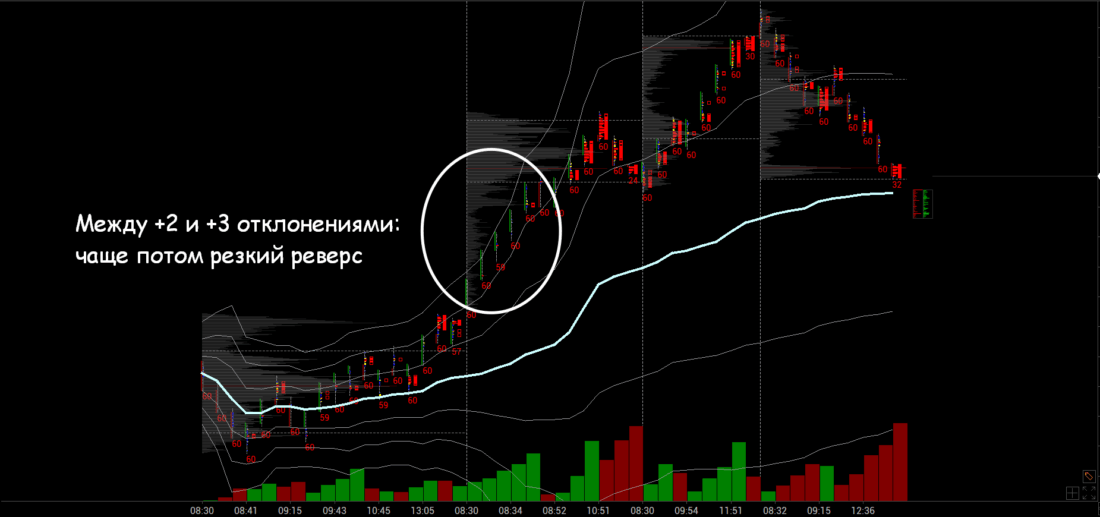
When, after several expansions, the quote approaches the average VWAP, this is a signal either of a transition into balance or of the last entry point into the impulse: it all depends on the reaction to VWAP.
Check the placement of liquidity after exiting the balance. Noticeable placement of liquidity in a flat area at the extreme after a confident start of the move occurs after a quick pass of 1.5-2 balance ranges. At the same time, after the initial placement it is necessary to see a continuation of the move. In an impulse, this initial placement will become the protection range and the entry point.
You can see the scheme above, but it will be described in more detail in the next section.
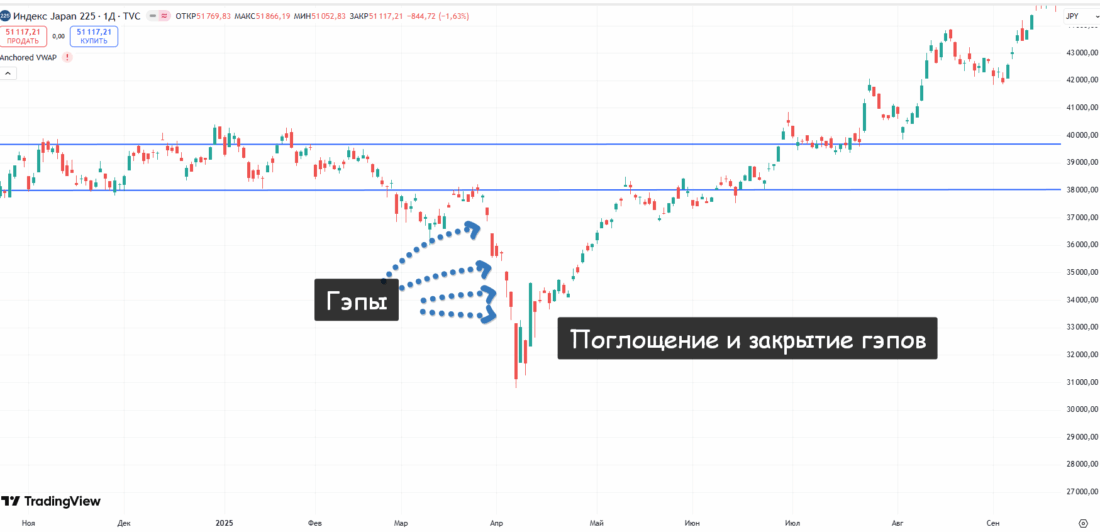
The presence of a gap and its protection. A gap can be both inside the balance and when exiting it. It may be traded through or not.
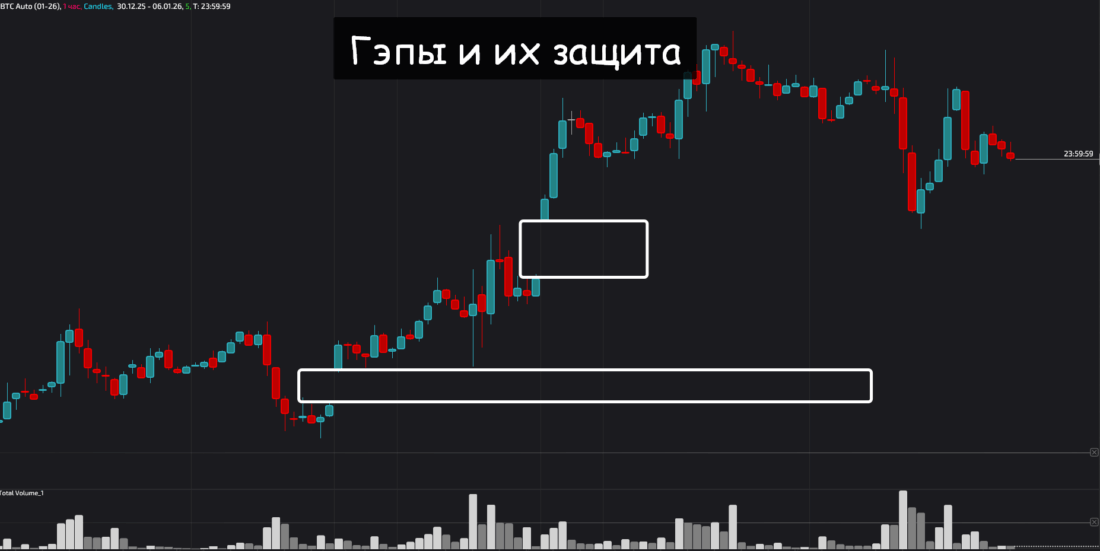
The best gap: when exiting a medium-term balance without trading through it.
If the gap is inside the balance, then it can be traded through without any consequences or fully repositioned.
If there is trading through a gap that is positioned as an exit from the balance, then you need to watch the protection of the balance boundary. The option of returning to the balance with a sharp transition to the opposite move is just as likely as a test of the accumulation followed by a final transition to impulsive distribution.
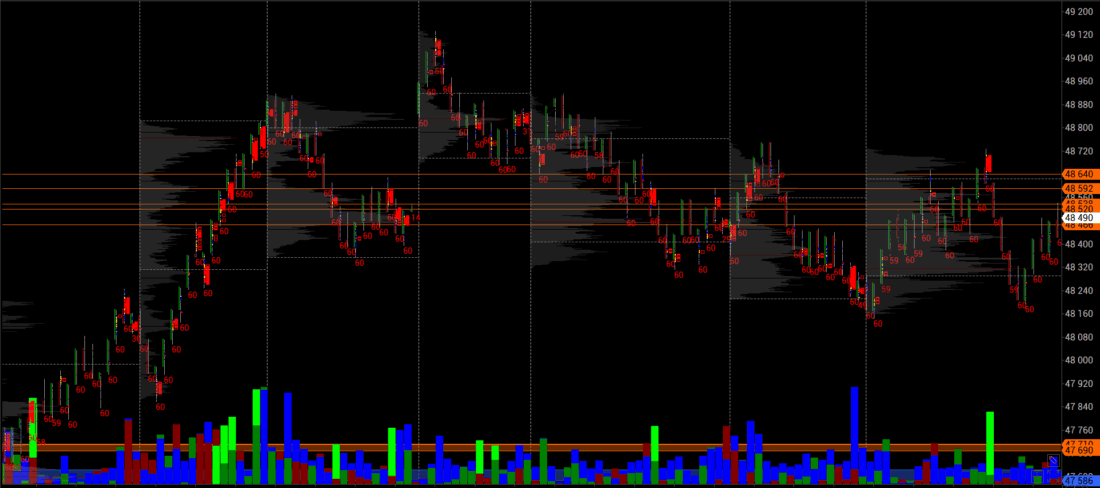
In addition, a gap as another expansion of the impulse with a sharp reverse trade-through can be a signal of a transition into balance.
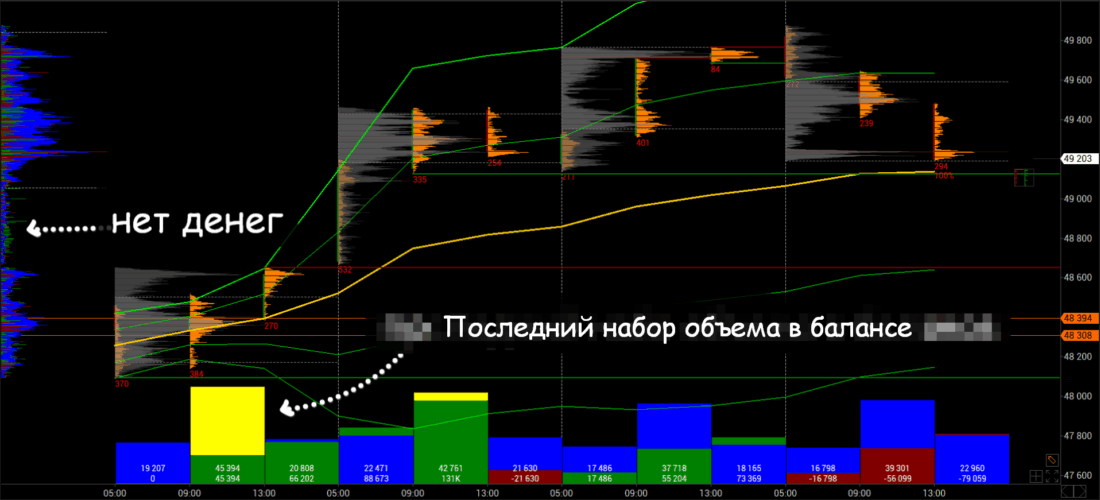
Also, one must not forget that a strong price imbalance, where there are effectively no volumes, can be regarded as a gap: the candle exists, but there is no money in it at all.
Signs of Transition Into an Impulse
Below are two images for studying the structure of an impulse.
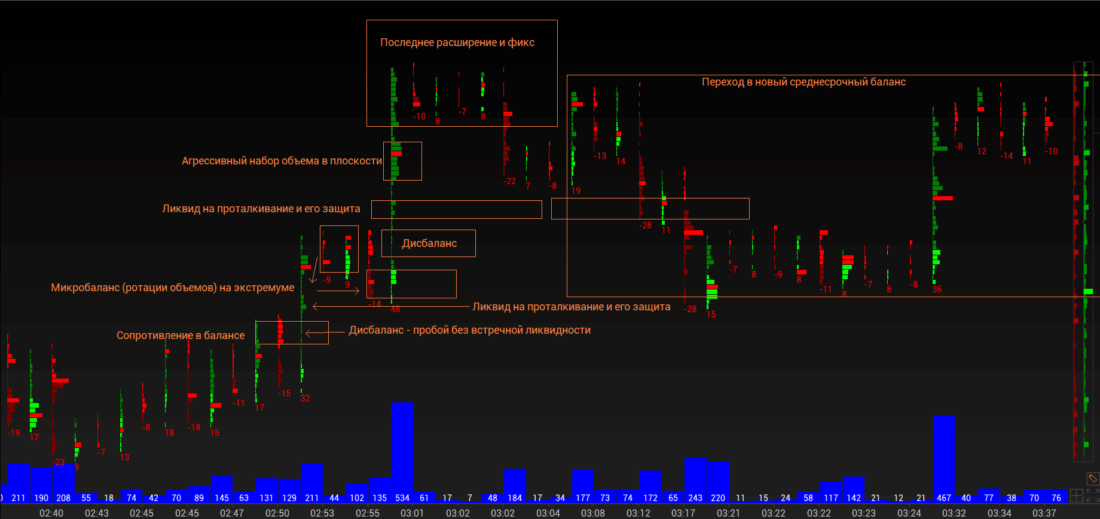
The first image shows the exit from the balance, the structure of the impulse, the fix, and one of the options for transitioning into a new balance.
We see 3 accumulations and 3 expansions. At the same time, the first accumulation and expansion are still inside the balance. Imbalances are shown, as well as two options for volume accumulation in flat areas at the extreme: with rotations and a liquidity test for pushing through, and fast accumulation in the flat area without a liquidity test for pushing through.
The expansion from the impulse to the accumulation amounts to 1.5 balance ranges.
We see growth in vertical volumes during the impulse. At the same time, we observe the structure of a weak impulse: on the last expansion the volume is higher than on the first.
Thus, this is not the strongest impulse, but one of the most common ones in the markets.
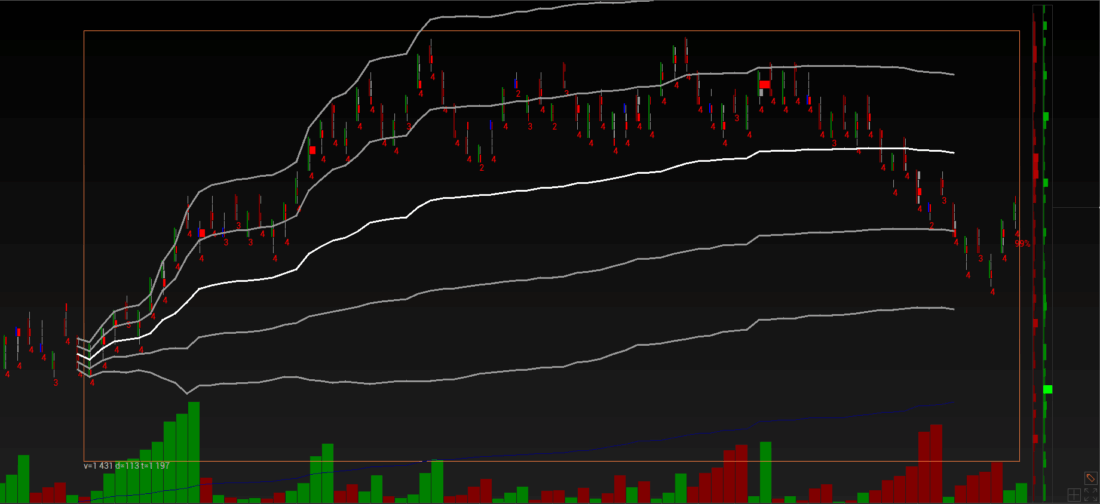
The second image shows the same quote at the same time (a Range Bar chart instead of a Reverse Chart), but with the impulse AVWAP plotted. We see normal growth at the +1 deviation with a test of the +0.5 deviation (not shown on the chart) in the accumulation after exiting the balance. Further growth proceeds between the +1 and +2 deviations.
A signal of transition into balance: a move below the +1 deviation and a transition into balance between VWAP and the +1 deviation. A move below VWAP with a return to the positive zone means a full transition into balance. In that case, the balance runs between the +1 and -1 deviations.
If, after moving below VWAP and returning from below to the average, we see protection of the average and a strike downward, then one can think about volume repositioning.
Weis Wave shows confident growth at the start of the dynamics and on the breakout from the balance. Then the Weis Wave also continues to grow, but somewhat unevenly, although the growth waves are clearly stronger than the correction waves. After the final shift into correction, we see a substantial Weis wave to the short side.
Main Characteristics of the Fix
We covered one of the fix models in the previous section. Let me remind you that it is characterized by a buildup of volumes at the extremes with the prior formation of a fix pattern, a “double or triple top,” which is the balance itself.
The development of the model can take either a reversal form (double or triple top) or the form of continuation of the main dynamics within the volume-accumulation model shown above.
The main characteristic of a reliable fix is a volume spike in the opposite direction, often with a strong reverse move.
In any case, for a fix and a transition into a new balance, a breakout of the last impulse accumulation is important, as in the example in the previous section.
With a very strong final expansion, a fix is a sharp return to the zone of the last accumulation. In essence, this is a model similar to the previous one, but with a very large range.
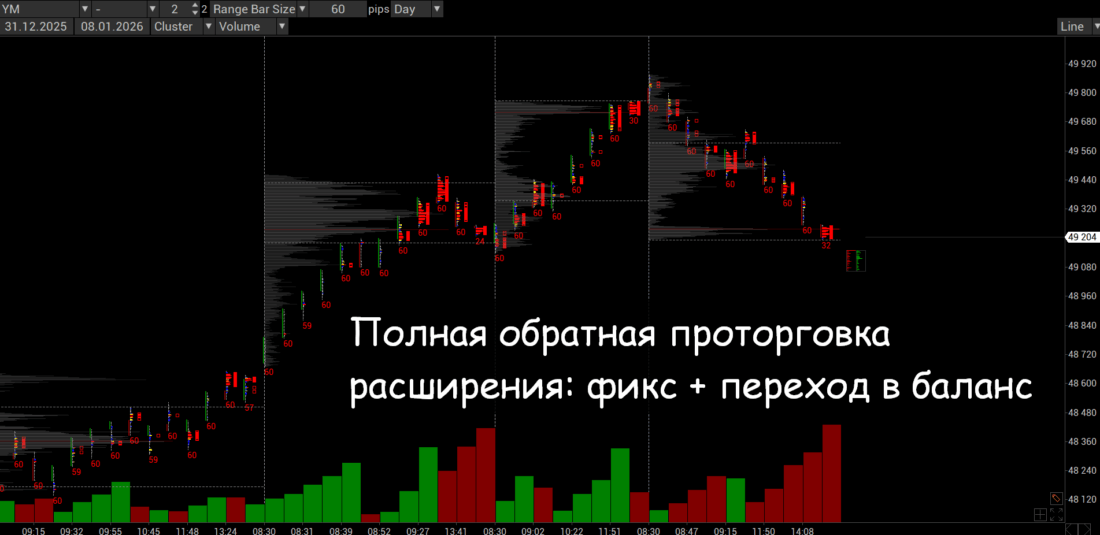
The next possible development of the story is the formation of a full-fledged V-reversal model or a head-and-shoulders pattern, which implies a quick move back in trading all the way to the upper boundary of the balance from which the impulse began.
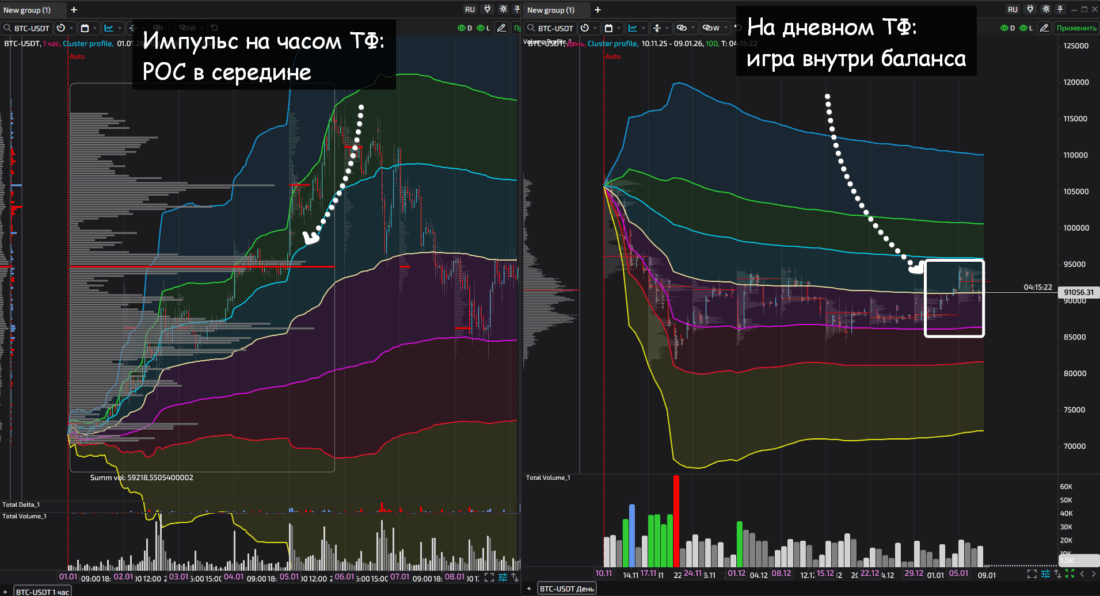
Most often, after the fix (although sometimes before it), the point of control of the impulse shifts closer to the extreme. This is a signal of a possible transition into balance. Of course, it is necessary to count the number of expansions, since the POC shifts along the move: it is also important to see the growth of horizontal volumes that contrast with the horizontal volumes within the impulse.
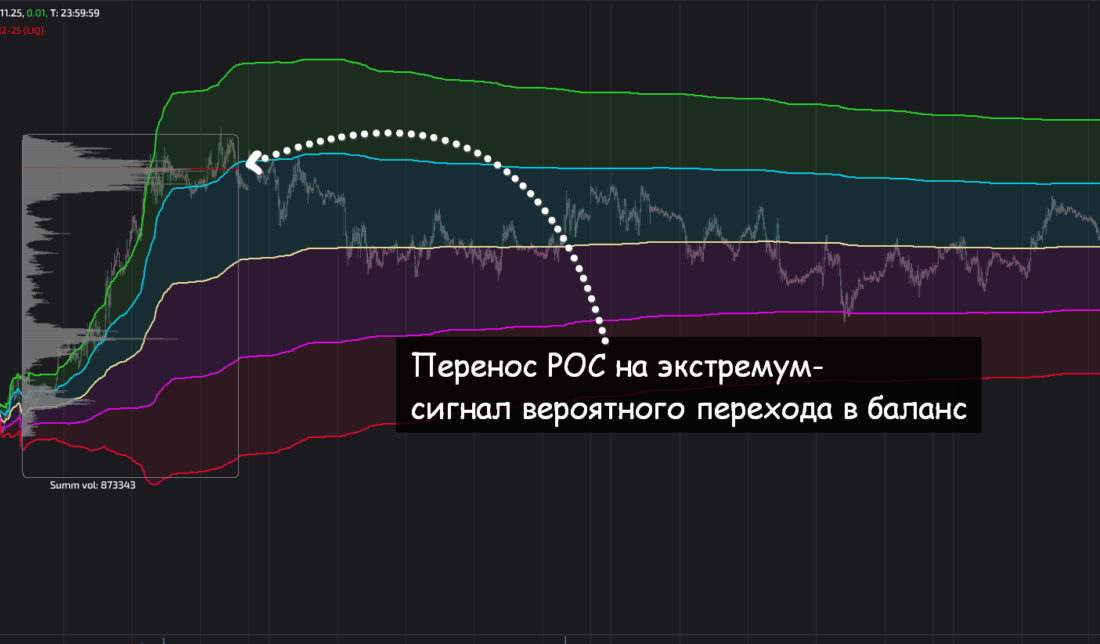
A reversal also often occurs after the POC (point of control) is moved closer to the extreme. But there are also cases where the POC remains in the middle of the impulse. The price almost always returns to this balance with the POC. Most often, such cases occur within an impulse that unfolds inside the balance of a higher TF: for example, an impulse on the hourly chart lasting several days takes place inside a two-month balance.
The Key Question: Is It Possible to See an Impulse Without Volume Analysis?
Many traders are concerned with the question of how to get into an impulse without studying the market's volume structure.
In general, we can say that an impulse breakout is visible even without a volume quote. But understanding what is inside the bar / candle greatly simplifies the picture of what is happening and adds confidence to your actions.
To understand whether it is possible to look for an impulse phase on your working instrument without a volume quote, you simply need to open the chart, for example in TradingView, and review your instrument on historical data while following the rules described above.
Below is the Nikkei 225 index. On the one hand, there are more peaks in the balance (5); on the other hand, the breakout occurs on the 5th, not the 4th or 3rd, approach.
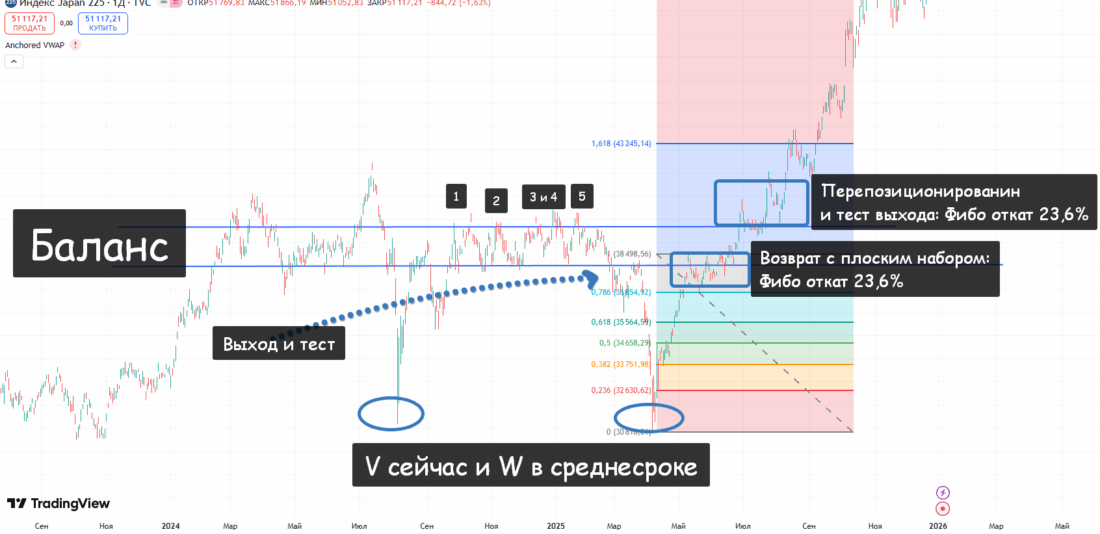
You can add channels, oscillators, moving averages, and so on. Tick volumes will also help. We monitor breakouts, accumulations above-below balances, the presence of gaps, engulfing candles, and so on. Pullbacks to 23.6% Fibonacci if measured from the starting point, and no more than 50% if measuring each real expansion of the main structure.
Conclusion
Impulse is everything to us. The best entry into an impulse is after confident liquidity positioning: on the breakout from a balance or on the first confident expansion.
Where should we expect profit?
In the first case, we count expansions and watch for the presence of a fix.
In the second case, we bet on the length of the passage from balance to the stop and the transition to fast rotations at the extreme.
Let the length of the passage from balance to the first plane be 100 points, which means that from the test of the extreme of this plane one can expect 100 or more points so as not to run into truncation, a change in sentiment, etc.: in other words, so as not to find oneself at the extreme at the moment the reversal is forming.
Thus, it is better to set an automatic profit slightly lower, at least close part of the position, and immediately after the expansion in the direction of the impulse move the entire position to breakeven when entering on the test of pushing volumes.
Respectfully,
Ivan Rusin