
Cryptocurrency Correlation: How Bitcoin, Ethereum, Altcoins, and NASDAQ Are Connected

Most novice investors notice one pattern: if Bitcoin starts rising sharply, then after some time many other cryptocurrencies also become more expensive. A similar situation happens during a market decline: most coins simultaneously lose value.
This behavior is not accidental. It is connected with a phenomenon called correlation.
Correlation is a statistical relationship between price changes of two or more assets.
Simply put, it shows how strongly the movement of one cryptocurrency is connected with the movement of another. If two assets almost always rise and fall together, they are said to have a high positive correlation. If one asset rises when the other falls, this is called negative correlation.
For the cryptocurrency market, understanding correlation is especially important because most digital assets are closely connected to each other. Unlike the traditional stock market, where companies operate in different sectors of the economy, a significant share of cryptocurrencies reacts to the same news, changes in investor sentiment, and the movement of the largest coins.
That is why experienced traders rarely consider a separate coin in isolation. Before buying, they analyze the overall state of the market, the dynamics of Bitcoin, Ethereum, and other large assets, because they often set the direction for the entire crypto market.
How Correlation Is Measured
To assess the relationship, the correlation coefficient is used, which takes values from -1 to +1.
A correlation of +1 means that two assets move almost identically. If one rises on the back of positive news, the second will most likely also show growth.
A correlation of 0 indicates the absence of a noticeable relationship. A change in the price of one asset has practically no effect on the movement of another.
A correlation of -1 means opposite movement. When one asset becomes more expensive, the second usually becomes cheaper.
In the cryptocurrency market, perfect values are rare. Most often, the coefficient is in the range from 0.4 to 0.9, and it constantly changes under the influence of the market situation.
Main Types of Correlation
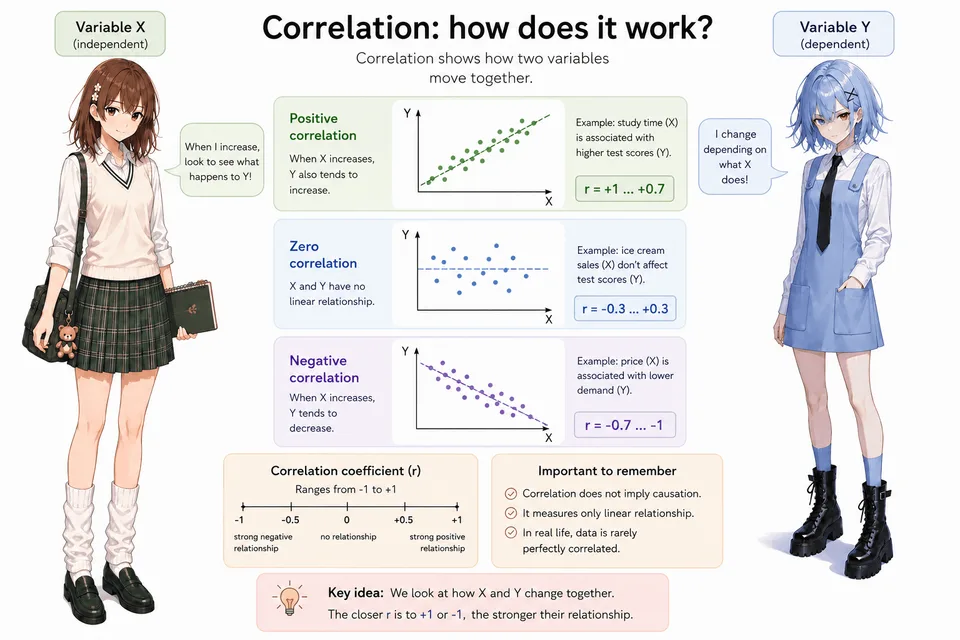
Positive correlation.
This is the most common type of relationship in cryptocurrencies. Most major altcoins repeat Bitcoin's movement.
When the main cryptocurrency begins steady growth, investors become more confident and move part of their capital into other projects. As a result, almost the entire market grows.
Negative correlation.
This type occurs much less often. It means that one asset rises when the other falls.
In the crypto industry, such a dependence may be observed between high-risk assets and instruments that investors use to preserve capital during periods of uncertainty.
Weak and strong correlation.
Not every dependence is expressed equally. If the coefficient is close to +1 or -1, the correlation is considered strong. With values close to zero, the connection between assets is weak, and they may move independently of each other.
It is important to understand that correlation is not a constant value. During a calm market, two coins may show almost identical dynamics, but after important news is released or investor sentiment changes sharply, their relationship can change significantly.
That is why professional market participants regularly analyze correlation rather than relying on old data. For a beginner, this rule is especially important: the cryptocurrency market changes very quickly, and yesterday's patterns do not always work today.
Bitcoin is the main driver of the crypto market
The cryptocurrency market is not a set of independent assets. In most periods, there is one main driver: Bitcoin.
When BTC rises, most of the market rises with it. When BTC falls, almost everyone falls.
Why does this happen? Because BTC is the largest asset in the market. Bitcoin's share of the capitalization of all cryptocurrencies is 40 to 60%. ETF and institutional flows are directed primarily into BTC. This means investors assess the risk of the entire crypto market through Bitcoin.
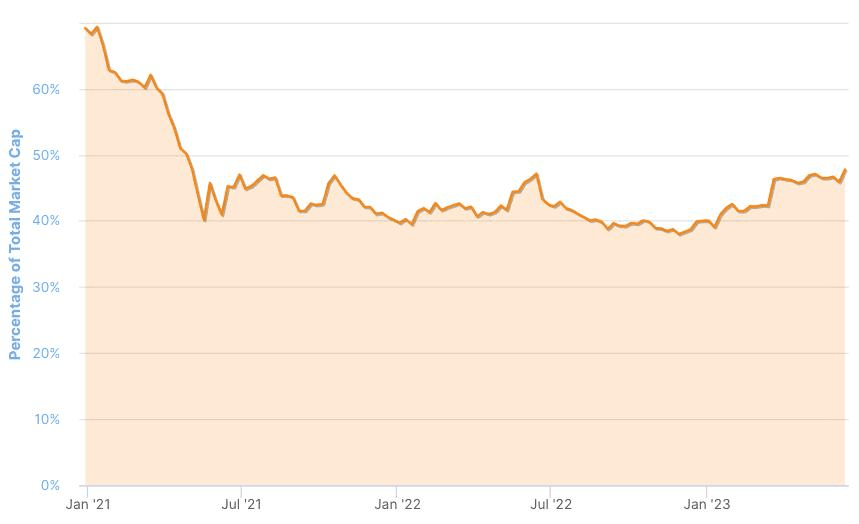
Thus, it is clear why the overwhelming majority of cryptocurrencies show a high positive correlation with Bitcoin.
It is also worth mentioning several more factors that temporarily strengthen or reduce altcoins' correlation with Bitcoin.
Market participant sentiment. Bitcoin is perceived as the main indicator of the state of the entire industry. Its decline often raises concerns about the resilience of other projects, which leads to mass sales of altcoins.
Trading pair structure. Many altcoins trade in pairs against Bitcoin. When BTC's dollar price falls, market makers and automated systems recalculate the value of other assets, causing their synchronized decline.
Use in DeFi. Bitcoin and tokens derived from it (for example, Wrapped Bitcoin) are widely used as collateral in lending protocols. When the price drops sharply, cascading liquidations of positions are triggered, increasing pressure on the entire market.
Bitcoin dominance (BTC.D) is BTC's share of the total crypto market capitalization. Its dynamics help show where capital is flowing.
An increase in BTC.D means that capital is concentrating in Bitcoin. During such periods, altcoins often fall relative to BTC, even if their dollar price does not change.
In turn, a decline in BTC.D indicates a flow of funds into altcoins. These are periods when smaller assets may grow faster than Bitcoin.
Which cryptocurrencies are most connected to each other
Bitcoin and Ethereum are the market's main pair
Correlation is often in the 0.7–0.9 range.

Reasons:
both assets are included in institutional portfolios;
both react to the macroeconomy;
both are traded through ETFs and major exchanges;
both are perceived as crypto “blue chips”.
Ethereum and the Ethereum ecosystem

A very high connection (correlation 0.6–0.85) is observed between ETH and tokens of its L2 ecosystem.
Asset | Connection with ETH |
|---|---|
Arbitrum | High |
Optimism | High |
Uniswap | High |
Aave | High |
Lido DAO | Very high |
When ETH becomes stronger than the market, its ecosystem often starts to grow as well.
Solana and its ecosystem

Related assets:
Jupiter
Raydium
Jito
meme coins of the Solana network

During periods of a strong trend, correlation within the ecosystem can be above 0.8.
BNB and BNB Chain Ecosystem Tokens

The Binance (BNB) ecosystem also shows a correlation of 0.6-0.8, which is a good indicator.
How Crypto Market Sectors Are Connected
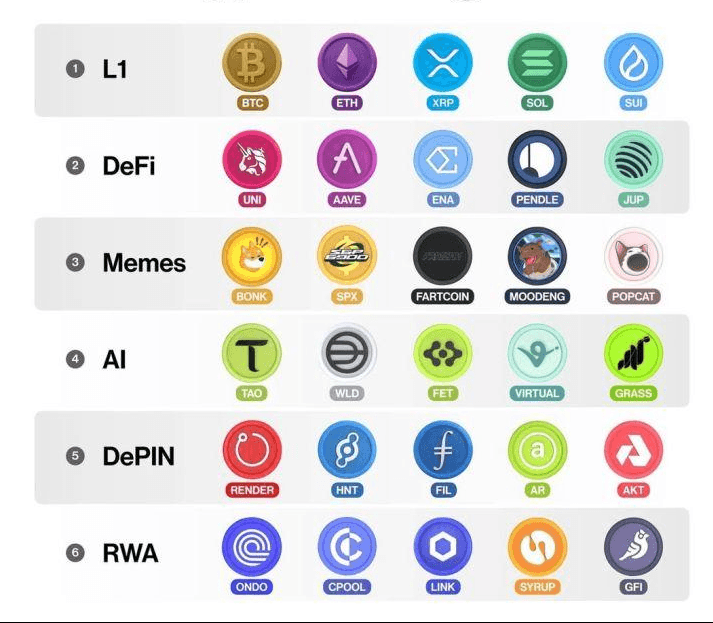
Sector 1. Layer 1
This is the most correlated sector, which includes BTC, ETH, SOL, BNB, ADA, AVAX.
Sector features:
maximum liquidity;
the first to react to macroeconomics;
set the direction for the entire market.
During a “bull market,” capital often goes first into BTC, then into ETH, then into major L1s, after which it also reaches mid-cap altcoins.
Sector 2. DeFi
DeFi tokens (AAVE, UNI, MKR, CRV, LDO) depend more on Ethereum than on Bitcoin.
They usually rise when:
ETH shows strength;
TVL (Total Value Locked) increases;
network activity grows.
Sector 3. AI Tokens
This sector partially correlates with the crypto market, but also depends on the artificial intelligence trend.
Therefore, AI tokens (FET, TAO, RNDR, AKT) sometimes rise even in a weak market.
Sector 4. Meme Coins
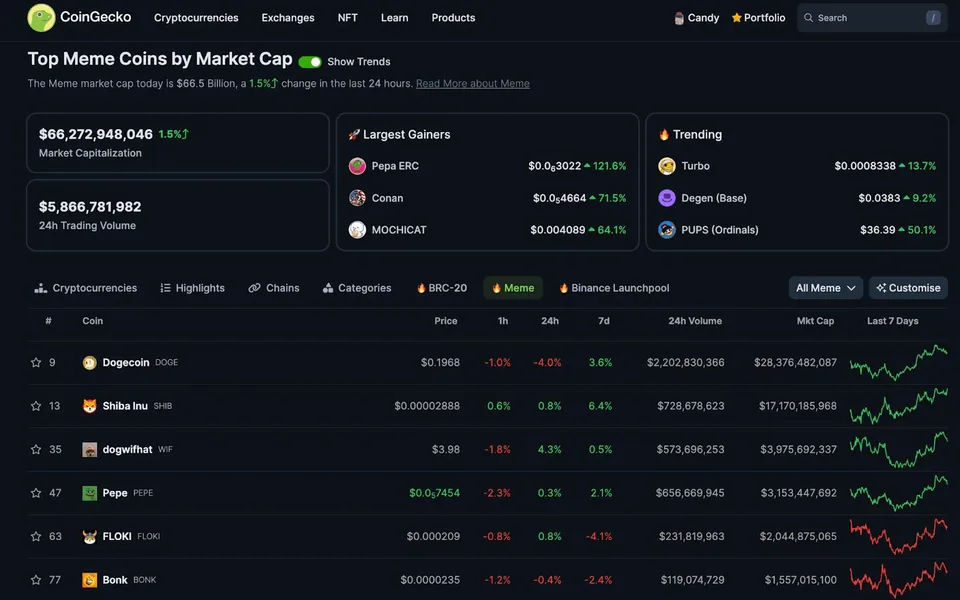
The most speculative sector, which is most sensitive to crowd sentiment.
The correlation with BTC is lower than that of major coins, but in moments of panic almost all fall at the same time.
Sector 5. RWA and Infrastructure
RWA are tokenized real-world assets (real estate, gold, securities, works of art, commodities, even intellectual property). This includes projects such as LINK, ONDO, PYTH, GRT.
They often win during periods of institutional interest and correlate with the underlying assets.
How Capital Moves Between Sectors

A typical capital flow cycle in the crypto market looks like this: BTC rises, ETH catches up, Layer 1 grows stronger, DeFi / AI / Gaming, Memecoins (the final risk stage).
Crypto's Connection With NASDAQ
Bitcoin and the NASDAQ index often move in the same direction, since both belong to the category of risk assets. When investors are ready to take on more risk, capital flows into technology stocks and cryptocurrencies. When expectations worsen, interest rates rise or liquidity declines, both markets usually come under pressure.
After 2020, the correlation between BTC and NASDAQ increased noticeably thanks to the arrival of institutional investors, the development of spot ETFs, and the fact that cryptocurrencies became part of the global market for risky assets.
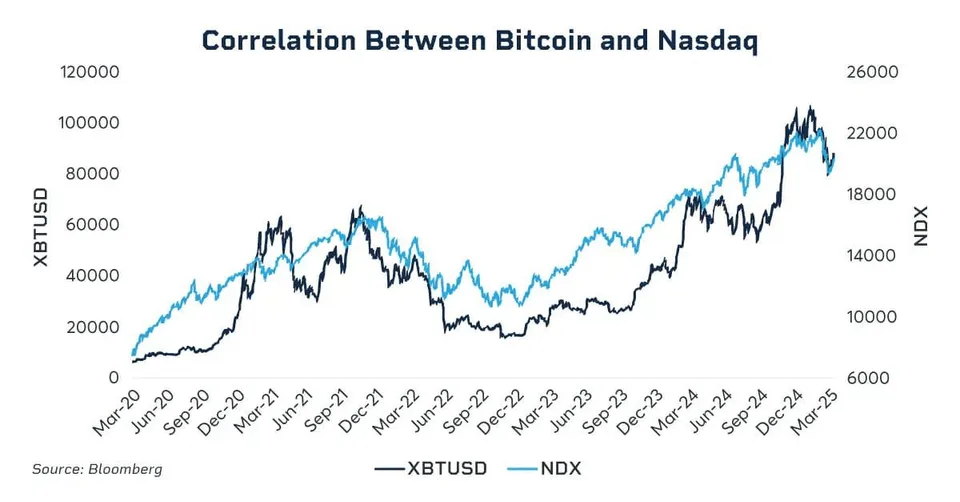
Since the end of 2025, the correlation between NASDAQ and Bitcoin has been almost invisible, although analysts believe it has not disappeared.
NASDAQ's growth at the end of 2025 was driven primarily by the AI rally and strong corporate earnings, while Bitcoin was going through an internal correction after updating its highs, intensified by liquidations in the derivatives market and changing capital flows through ETFs.
When Cryptocurrency Correlation Breaks Down
The connection between assets is not constant. There are situations in which prices behave differently.
Stablecoins. These assets are designed so that their price is tied to the dollar as closely as possible (correlation with USD is close to +1), while correlation with bitcoin tends toward zero. However, in the event of losing the peg (as happened with UST), correlation with the dollar breaks down, causing shocks.
Events specific to an individual project. News of a hack, delisting from a major exchange, or a regulatory lawsuit can crash the price of a specific coin by tens of percent, even if the entire market is rising at that time. Internal factors outweigh the overall trend.
Macroeconomic cycles. Cryptocurrencies (primarily bitcoin) show correlation with technology stocks (for example, the NASDAQ index), but there are also moments when this connection weakens, for example, as in 2026.
Why a Crypto Trader Needs to Understand Correlation
At first glance, it may seem that it is enough to choose a promising coin and wait for growth. However, in practice even a strong project can fall significantly in price if the entire market is under pressure.
Imagine this situation: an investor bought several popular altcoins, hoping to reduce risks through diversification. But unexpectedly for the young investor, bitcoin falls by 10%. A few hours later, most altcoins also begin to decline, and this already means, for example, a loss of 10 to 50% of value in part of the portfolio. As a result, it turns out that the entire portfolio declines almost simultaneously.
The reason lies precisely in the high correlation between assets. Despite the fact that the coins belong to different projects, they react to the general sentiment of market participants.
Understanding correlation helps to:
correctly assess risks before buying;
build a more balanced investment portfolio;
understand the reasons for the rise or fall of individual coins;
choose successful moments to enter the market;
avoid buying a large number of equally dependent assets.
In other words, correlation allows you to look not only at a specific cryptocurrency, but also at the market as a whole.
Where to View Cryptocurrency Correlation Online
You can find many services online that allow you to track currency correlation in real time. Each has its own strengths and weaknesses.
TLAP also offers you a look at cryptocurrency correlation online. The service is very simple, but it is enough to quickly assess the current situation.
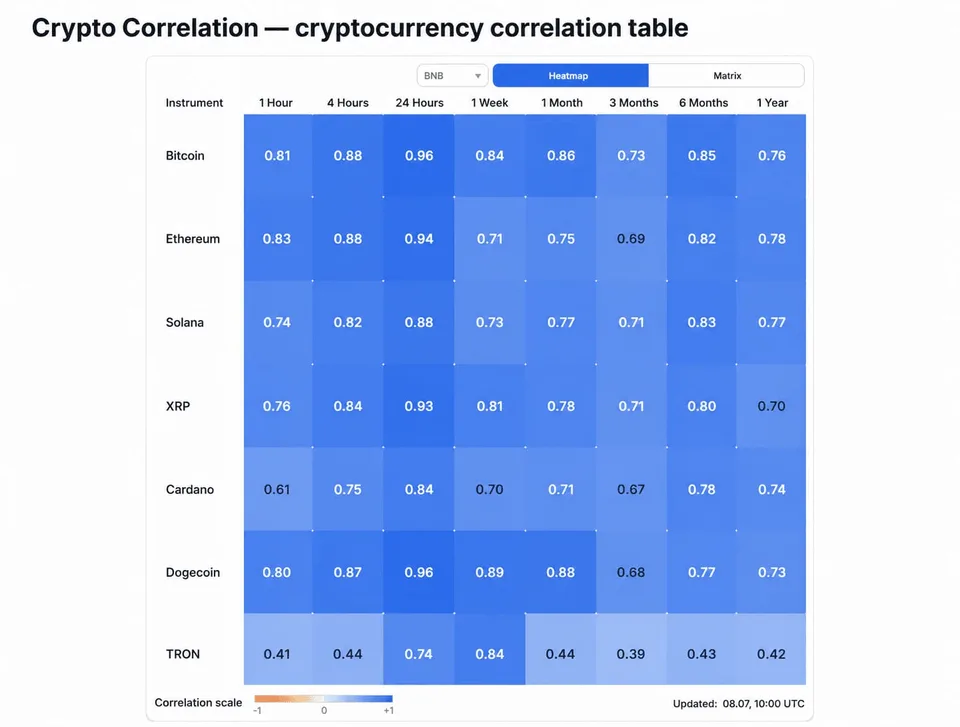
The TLAP tool allows you to study correlations between BTC, ETH, BNB, SOL, XRP, ADA, DOGE, TRX over an hour, 4 hours, a day, a week, a month, 3 months, half a year, and a year.