
Average Volume per Tick Indicator: A Simple Formula and Strong Predictive Power

The calm before the storm. This is what we see not only in nature, but also on the exchange. Very often a strong price impulse is preceded by a drop in volatility, when the quote stands in a very narrow range and trading volumes fall.
It is completely unclear what to do with this: exit the market or prepare for a sharp move. Or rather, it used to be unclear. Now traders have an opportunity to see the probable preparation for a future strong move in a very dull and calm market.
The Average volume per Tick indicator is exactly that opportunity, providing a lot of information for thinking about the nearest prospects.
What is the Average volume per Tick indicator? It is the quantity (volume) of shares, contracts, coins, or cryptocurrencies traded over a certain period, divided by the range of that same period.
Few people know about this indicator, and even fewer traders use it. And that is a pity, because it has quite good predictive power.
This material is for informational purposes, cannot and should not be regarded as consultation or advice.
What is the Average Volume per Tick Indicator?
The formula for calculating average volume per tick is very simple:
Average volume = Timeframe volume / timeframe range (high - low).
The Average volume per Tick indicator is a metric of volume density per one tick (how much volume fell on each point of price movement during that period).

In the Volfix terminal, this indicator is called Average Volume (AVG), which creates some confusion for traders, since Average Volume is usually understood as the accumulated volume for a period divided by that period (for example, they take the volume for 5 days, sum it, and divide by 5).
I will talk about that understanding of average volume some other time.
An approximate average volume per tick can be determined as follows: a very narrow range even with relatively small, and especially average, vertical volume gives a high average volume, which is often a harbinger of an impulse. But it is better to determine it not approximately, but at least divide the session range by the available type of volume. If there are no exchange volume data, then tick volume available in MetaTrader and other terminals and services, including TradingView, will do.
To understand what average volume is high, it is necessary to calculate it for at least 50-100 days (or even better, sessions, especially for the U.S. stock market) in order to obtain meaningful statistics. If we are talking about lower timeframes, then it is better to calculate the average volumes of the sessions most liquid for the instrument.
If volumes on BTC are usually slightly higher during the U.S. session, then the calculated average volume parameters will also suit the European and Asian sessions.
During these periods, elevated vertical and average volumes are lower than during the U.S. session, so the appearance of average volumes significant for the U.S. session in Europe or Asia will be a very powerful signal of a potential move within that particular session.
However, the calculation of average volumes for each session (European and so on) is also needed, because statistical trading in other time periods has not been canceled.
As I already said, average volume per tick can be calculated for any timeframe. If on the daily timeframe this indicator shows an increased probability of an impulse move in the near future with a range appropriate for the daily timeframe, then on the minute timeframe high average volume indicates an increased probability of the start of a move with a range appropriate for that timeframe.
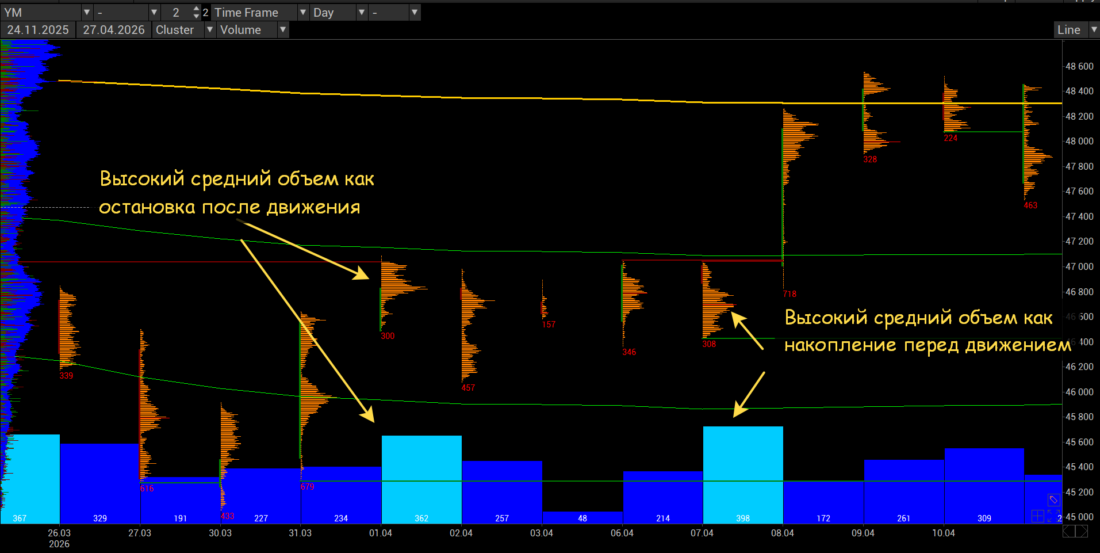
High average volumes may appear not only at the beginning, but also in the middle and at the end of a move. High volume in any case is a harbinger of the beginning / continuation of a move or a stop / reversal of the trend.
The range in which high average volume passed often becomes a price zone that in the near future will become support or resistance.
No less important is the fact that the range in which high average volumes passed does not lose its significance when it is broken in the opposite direction (for example, upward after the first move down, or vice versa). This zone becomes support when volumes are repositioned from shorts to longs, or resistance when buying volumes are repositioned into selling volumes.
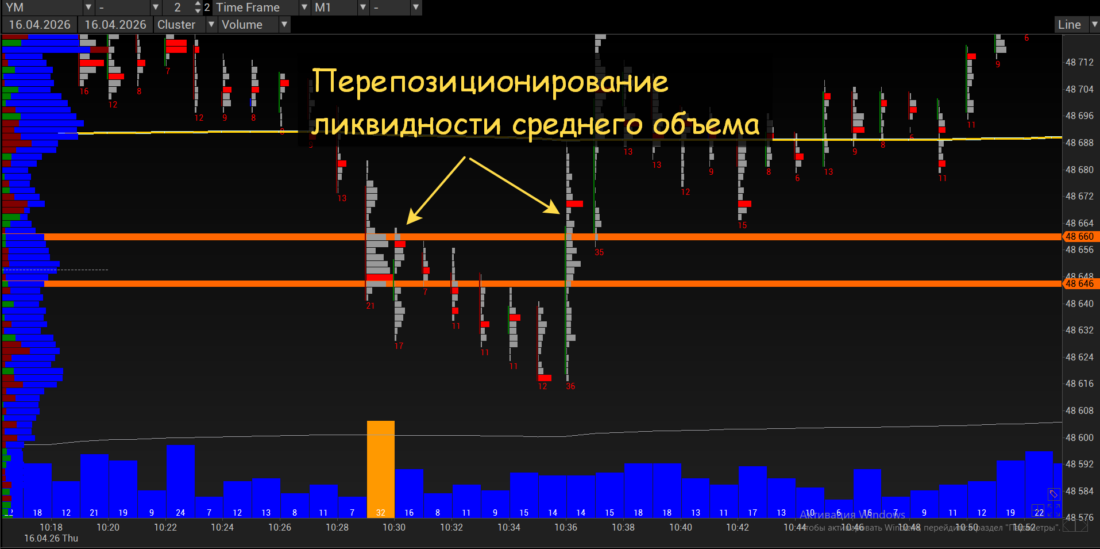
Another important feature of high average volume is that it most often appears closer to the beginning of impulse dynamics on the higher timeframe.
If high average volumes pass during a potential breakout from the range, they can be viewed as push-through volumes, that is, the last ones in that range before the impulse begins.
If, after high average volumes, for example, near the lower boundary of the range, sharp reverse dynamics (growth) begin, then this also serves as a strong signal that we are facing the last or penultimate touch of one of the corridor boundaries.
The appearance of high average volumes in the middle of the range after stop hunting is a very strong signal of forthcoming dynamics.
Separately, I will say that with high volatility within a trading session, the appearance of high average volume after a sharp one-sided move can be an excellent indicator of a reversal.
An Example of Using the Average Volume per Tick Indicator
Let us calculate the daily Average volume per Tick (AVG) for the Dow Jones index futures (ticker YM). To do this, we will use the statistics module in the VolFix terminal.
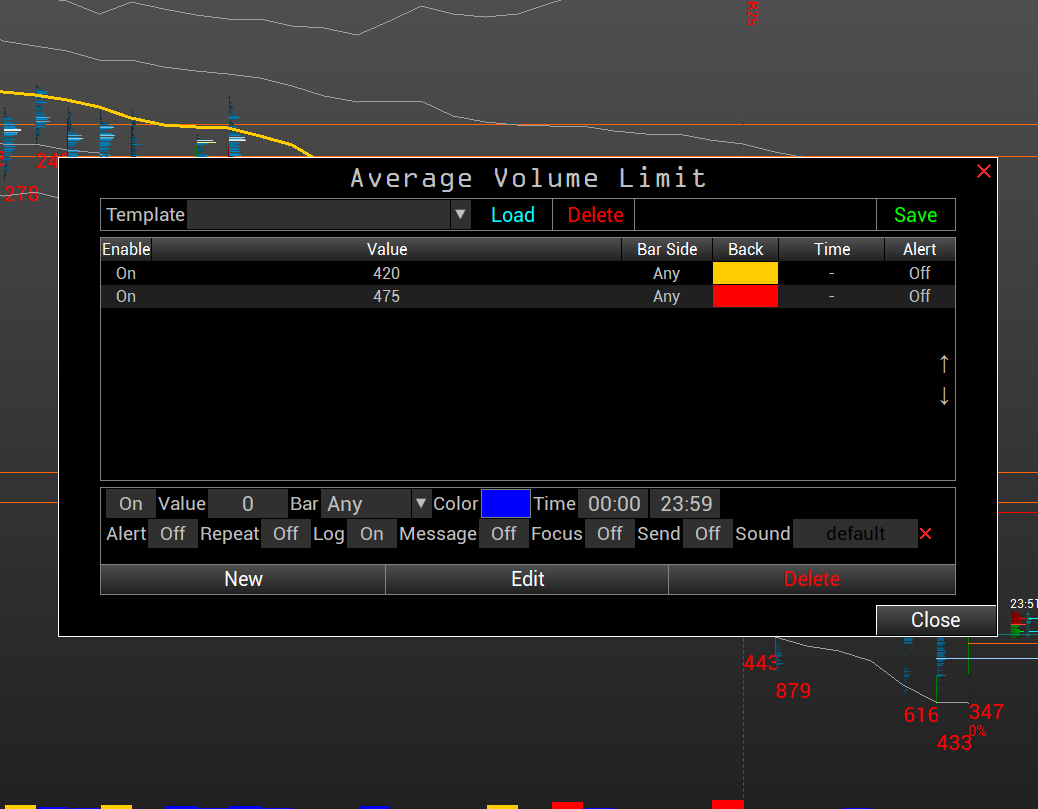
In the calculation of average volume, data from December 10, 2025 were used.
After switching to the March 2026 contract, the statistical parameters changed: daily volumes grew more than volatility, and the calculated average volume parameters for the year gave a very large shift of high values closer to the current dates (the article was written at the end of March 2026).
After December 2025, the current settings of the average volume filters look as follows: the minimum filter is 420 contracts per tick (2 points per tick), and the maximally significant one is from 475.
With a price step (tick) of 2 points instead of the standard 1 point, the average value of daily volume per tick increases 2 times. In other words, this means that with the standard price step (tick step) of 1 point, the average volume values will be 2 times lower.
Here is the daily chart of the YM futures, built from February 10, 2026, that is, from the beginning of the short impulse:
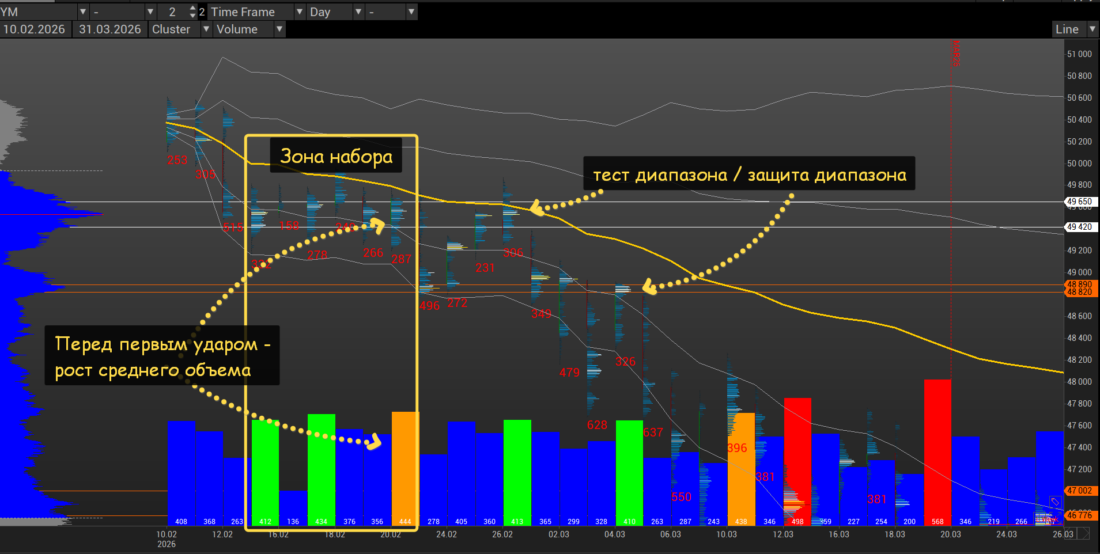
After the short strike, we see a stop in balance and a rise in average volumes. In the 49420-49650 range, elevated average volumes passed three times over 5 trading sessions.
After the expansion to the south, there was an attempt to return the quote, but in the same 49420-49650 range high average volumes passed again, which became the final marker of the beginning of the short impulse. By the way, liquidity had been accumulated in this plane for two weeks before the start of the American-Israeli invasion of Iran.
Also on this chart, let us note the protection of push-through selling in the 48820-48890 range on high average volumes.
Now let us consider the further development of the situation. I added a 350 contracts per tick filter to the average volume settings.
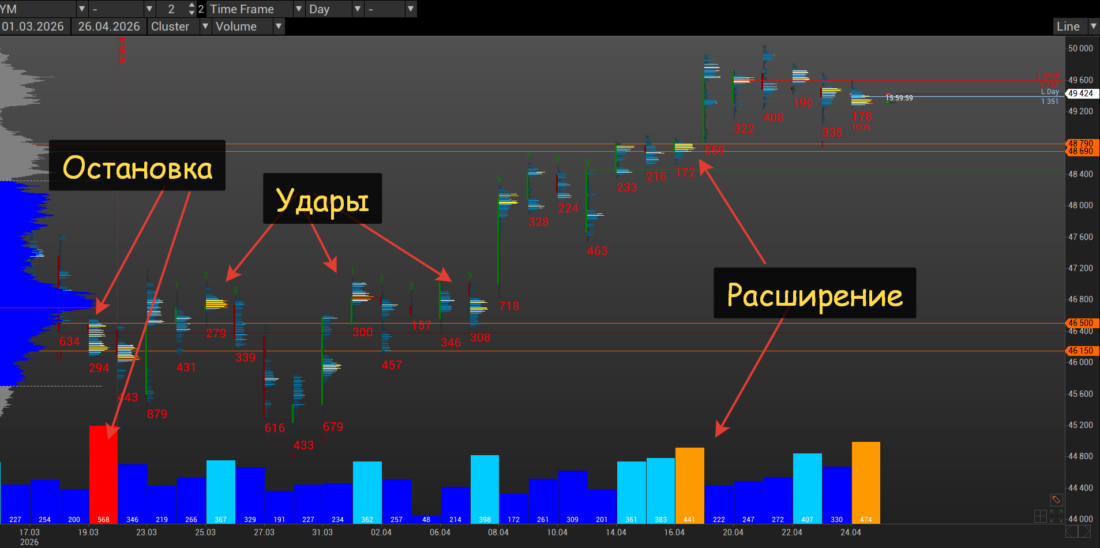
The maximum average volumes passed on March 19 in the 46150-46500 range, after which the quote stood still for two weeks. The next substantial average volumes passed only on April 16, after which the quote sharply went into an impulse.
But if you look at the filter from 350 contracts (blue filter), it is clearly visible that after each such set there was some kind of one-sided move. If such volumes come in a row, the result is also visible.
Average Volume Indicator on TradingView
TradingView features several variants of the average volume indicator. I compared them and chose the time-tested average volume indicator Volume per Point.
The developer of the indicator is JulyVibes. I should note that he posted only one script, but what a script it is! The last update of the indicator was on June 6, 2021. It seems like a very long time ago, but the indicator is not complex, which means the age of the script is not as important as its reliability.
At one time, the indicator made it into the Editors' Pick selection. Over 5 years, the page with the indicator description was visited almost 76 thousand times.
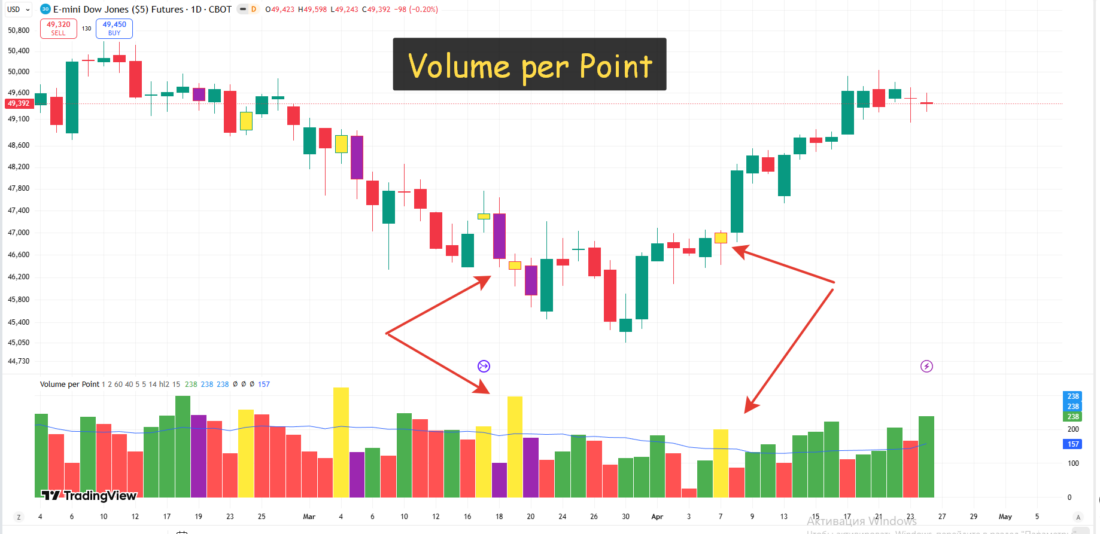
For verification, I took the same YM futures chart and compared the data. The data matched.
What do the colors of the average volume histogram mean?
- Green means growth of average volume
- Red means decline of average volume
- Yellow means divergence between volume and the candle range
- Purple means signs of exhaustion compared to the previous candle.
The author of the indicator left the ability to change the multipliers, which makes it possible to configure relative values for each instrument.
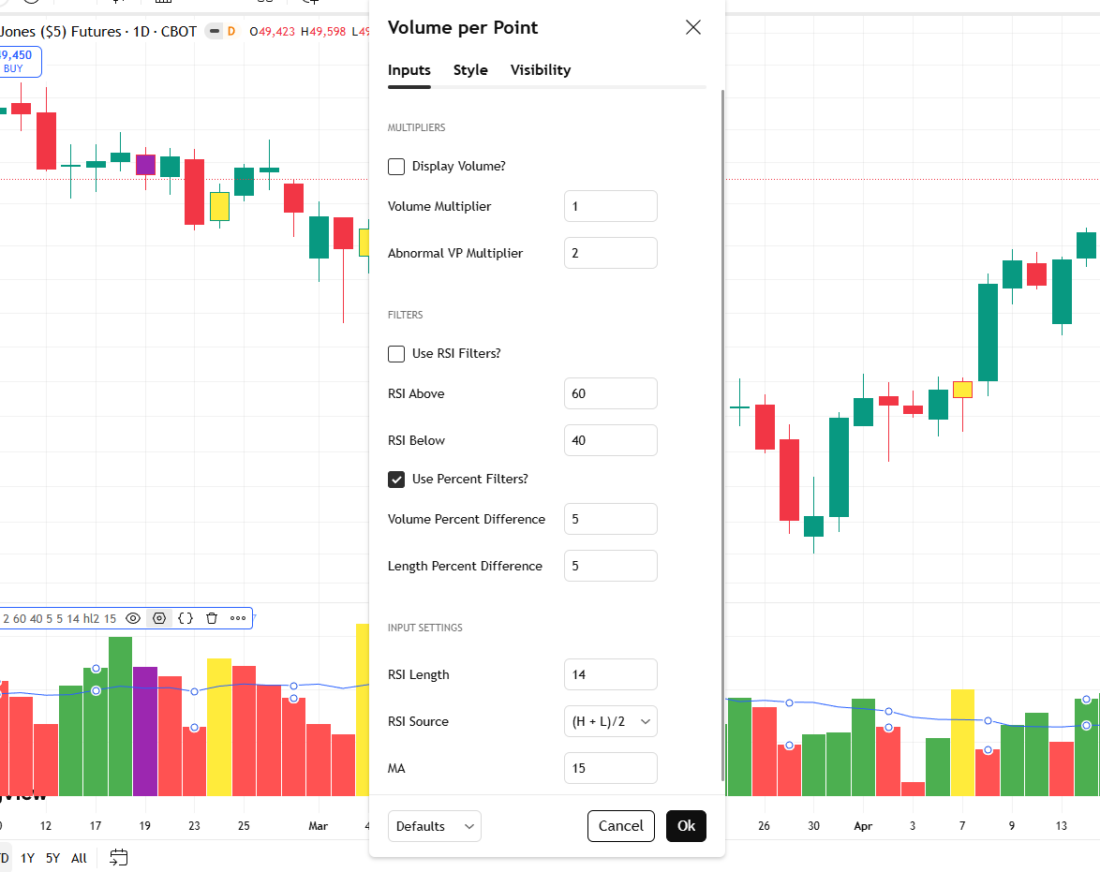
The following filters can also be enabled in the settings:
RSI filter serves to display RSI divergence or exhaustion. Percentage filter means candle ranges or volumes must be above or below the specified value depending on divergence or exhaustion.
Unfortunately, the indicator does not have the ability to manually configure average volume parameters, but many people do not need that anyway.
Conclusion
Average volume per tick can signal that players have become interested in accumulating liquidity in a specific range.

For short-term aggressive play, average volume is accumulated over 1-2 days.
If, however, we see that elevated average volumes are passing in a certain range over a long period of time (1-2 weeks), then we can expect the beginning of medium-term or long-term dynamics. At the same time, the last average volumes that are accumulated before the start of the dynamics will be elevated relative to the previous placements.
The range in which smart money collected liquidity (the volume accumulation range) is the most important one for liquidity positioning. For example, as long as the money is lower, the sellers control the quote. But a sharp reverse will be a signal that the other side has seized control.
Thus, the average volume accumulation range is an important marker of liquidity positioning.
To study average volume per tick, it is worth installing the Volume per Point indicator on the chart of the instrument of interest and scrolling through the history. I am sure everyone will find something new for themselves.