
What Is the "Andrews' Pitchfork" Indicator Used For?

Hello, fellow Forex traders!
We continue our look at classic indicator tools, and today it is Andrews' Pitchfork's turn. What kind of instrument is it, and on which currencies and timeframes should it be used? Let's find out.
Indicator Characteristics
Platform: Any platform that includes this indicator
Currency pairs: only 24/7 traded currencies, except cryptocurrencies
Timeframe: M15 - D1
Trading time: 24/7
Recommended brokers: Alpari, Alfa Forex, AMarkets
Regardless of the trading systems and indicators we use, everyone can observe on the chart the movement of prices within a visually defined range. It is seen most clearly during sideways movement, but the most profitable trading comes from a trend channel, where upward or downward movement is “sandwiched” between two sloping lines.
A side range, or flat, can be broken in either direction. The chosen medium-term channel gives hope that the current losing trade in the direction of the trend will turn profitable. After all, the main principle of directional movement is the constant renewal of highs and lows.
Another advantage of the trend strategy is the opportunity to increase its profitability by making counter-trend transactions, which can be quite safe with the right approach to risk. The only task of channel strategies is the correct designation of boundaries, that is, inclined lines of resistance and support.
The famous technical analyst Alan Hall Andrews managed to solve this issue by formulating a set of rules that make it possible to build a channel on the first wave of a new trend. The tool was developed by the author in live trading and, according to contemporaries, brought its creator millions of dollars.
In his old age, Andrews retired from active trading and took up teaching; the model he described was called “Pitchfork” due to the presence of a middle line between resistance and support.
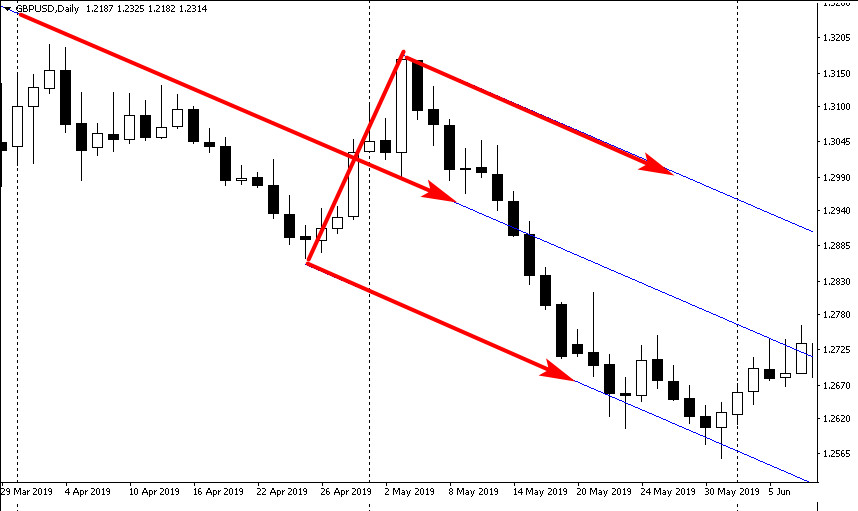
The significance of this discovery and the value of Andrews' Pitchfork in trading secured this graphical tool a permanent place in the standard indicator package of almost all trading platforms.
Description of the Indicator
The Andrews indicator is no less important in technical analysis than Fibonacci levels or Gann angles, although it is much less well known. The tool automatically determines the channel and the median line, the area where 80% of price fluctuations occur.
The upper and lower tines of Andrews' pitchfork are not exactly support and resistance lines. In explanatory letters to listeners, the author of the strategy considered the appearance of prices near them as a signal of strengthening or a change in trend.
An ideal Andrews trend is one where the next cycle of growth or decline ends with a correction that goes beyond the median of the indicator's central tine. If the trend is unable to return to the median line after reaching the resistance boundary, this points to a trend reversal or a transition into a flat.
Andrews Pitchfork is a reliable trend forecasting tool for newbies, who bypass it due to a lack of understanding of the principles of channel construction. Forming a figure is a fairly long process.
The accuracy of the signal depends on the correct choice of the first point, the beginning of the center line. The next two points are selected based on the principle of determining the wave of the largest amplitude; they can be redrawn if a wave with a higher amplitude appears in the future.
The long-term duration of the channel largely depends on the technicality of the instruments being analyzed, so the indicator is ideal for the Forex market. Major currencies are better able to withstand the average range of fluctuations than other assets, are traded around the clock and do not have gaps.
Basic Principles of Constructing Andrews' Pitchfork

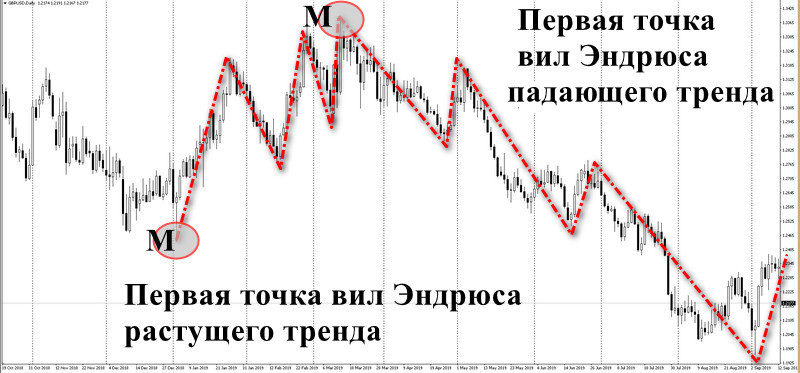
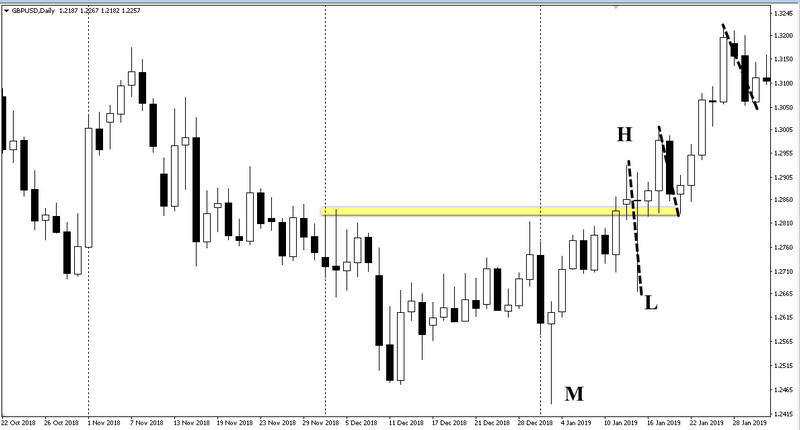
Andrews' Pitchfork is built from three points, and the first is the most important: the median line passes through it and should become the basis for 80% of the future trend's fluctuations. Finding it is both simple and difficult: it is the chart's extreme low or high.
In a clear upward or downward trend, the first point (let's call it "M") will be detected by changing a series of ascending highs to descending lows - a classic description of directional market movement from Charles Dow.
It is quite obvious that Andrews' Pitchfork is built after a reversal, when a new trend breaks through the extremes of the previous move. In our example, these are lows, since up to this point the market had been rising in GBPUSD, so we will call this renewed point L (Low).
The correction that appears after the next downward wave gives us the third and final point H (High), which determines the width of our pitchfork. For obvious reasons, to make sure the pattern is fully formed, you should wait for a new low below L in this example.
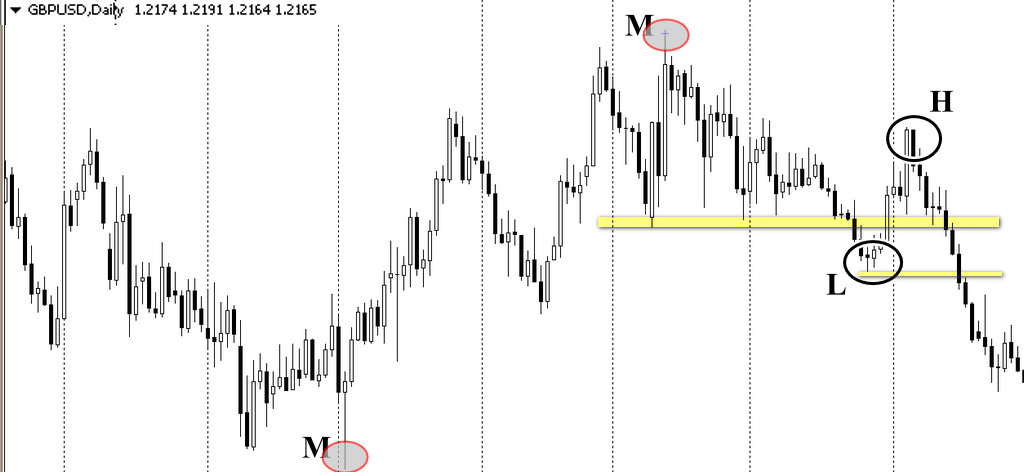
In an uptrend, the process of marking points H and L is reversed: the trader must wait for a new high in order to plot the second point of Andrews' Pitchfork. A downward correction will give the third point, L, only if the upward move continues with a new high above H.
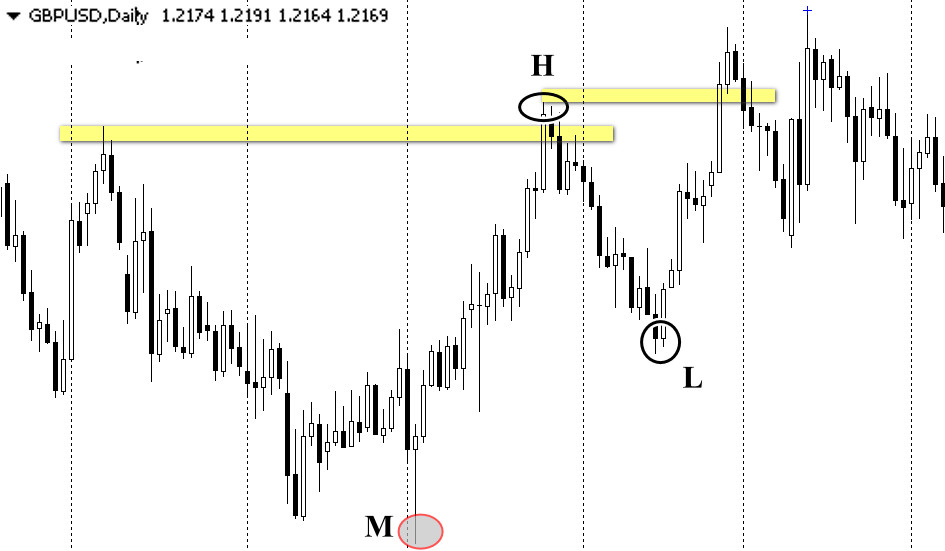
The slope and parallelism of the lines are maintained automatically on the graph. Having decided on the location of the three points, the trader should turn to the trading terminal option containing the Andrews Pitchfork tool.
Building Andrews' Pitchfork in MetaTrader 4/5

Andrews' Pitchfork belongs to the graphical analysis tools. In MetaTrader, it is located alongside other similar tools: Fibonacci lines, Gann angles, channels, zones, and shapes.
Click the "Insert" menu in the upper left corner and select "Andrews' Pitchfork" from the drop-down list. Move the cursor, which will change into a cross, to the first point M. After marking it, move on to points H and L, clicking the mouse in sequence; blue crosses should remain at the marked points.
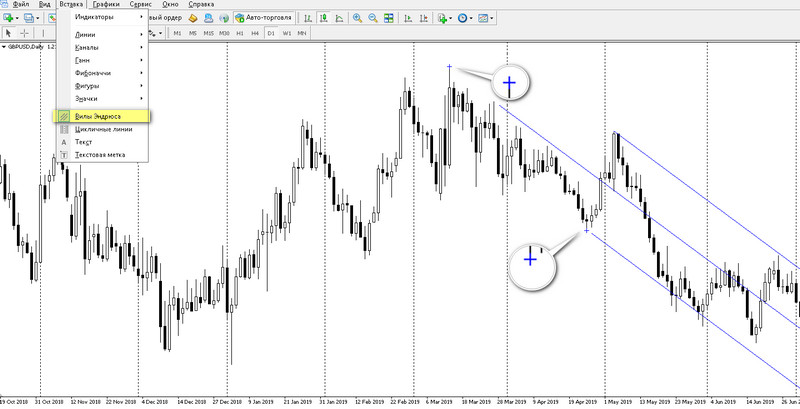
Andrews pitchfork lines will appear as soon as the last point is marked, after which you can begin chart analysis and trading.
Trend Reversal and Continuation Signals with Andrews' Pitchfork

One reason traders ignore Andrews' Pitchfork is complaints about delayed signals. In reality, you can use shifted pitchforks or the early appearance of the tines at the first signs of a developing reversal to get signals:
Trader has identified two points and has potentially identified the location of a third point. According to the rules described above, he must wait until the extremum is updated, but by drawing Andrews pitchforks right now, he can receive a signal to cancel the reversal.
If prices have reversed short of the midline and returned to resistance, a trader can confidently predict that the movement will continue above point H in an uptrend or below point L in a downtrend.
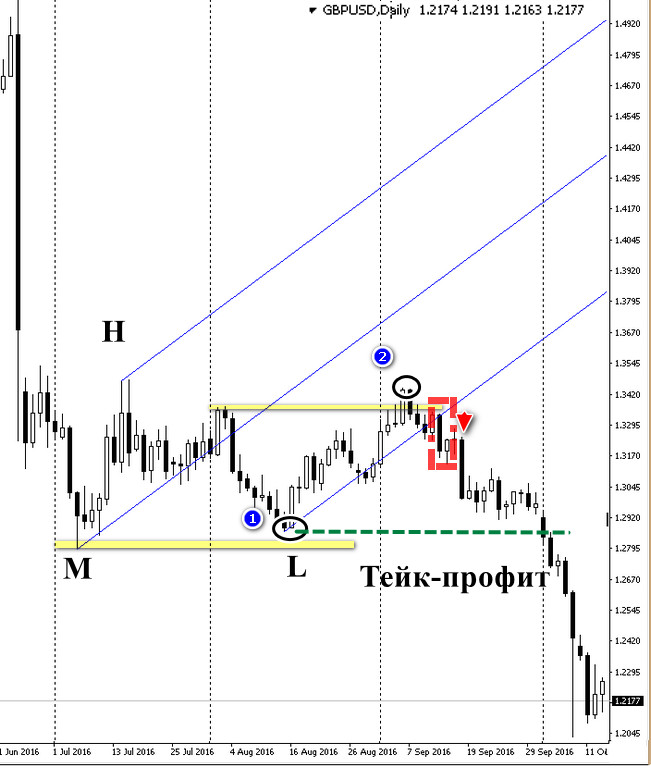
The example below shows that after GBPUSD fell heavily, the bulls attempted to stage a rebound, as judged by the higher low (1) and the updated high.
A pre-drawn Andrews' Pitchfork points to a "dead cat bounce": prices returned to the lower tine without reaching the median line. The trader only has to wait for two candles to close below support and then sell, aiming to take profit at level L;
Trader determines point M at the moment when the next wave of growth/decline does not reach a new high. The Andrews Pitchfork, drawn with an offset to the previous minimum/maximum so that M becomes one of the prongs of the figure, helps to understand the probability and strength of a reversal, as shown in the figure below.
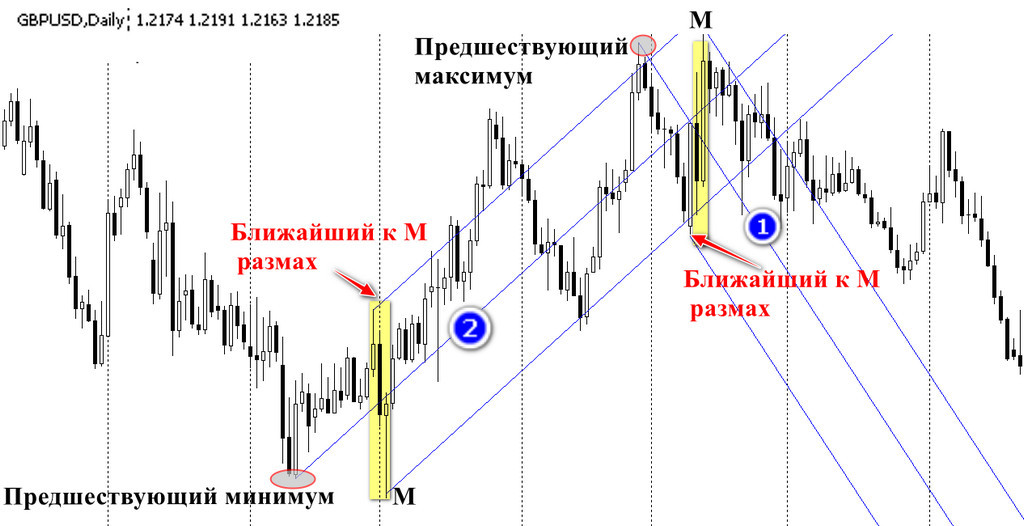
The probability of a reversal is determined by the median line: if prices only touched it, sideways movement is possible, as happened in example (1) of the downtrend. In case (2), the rising trend confidently crossed the median line and reached resistance. This indicates the strength of the move and the opportunity to open long positions at the nearest support or on new crossings of the median line.
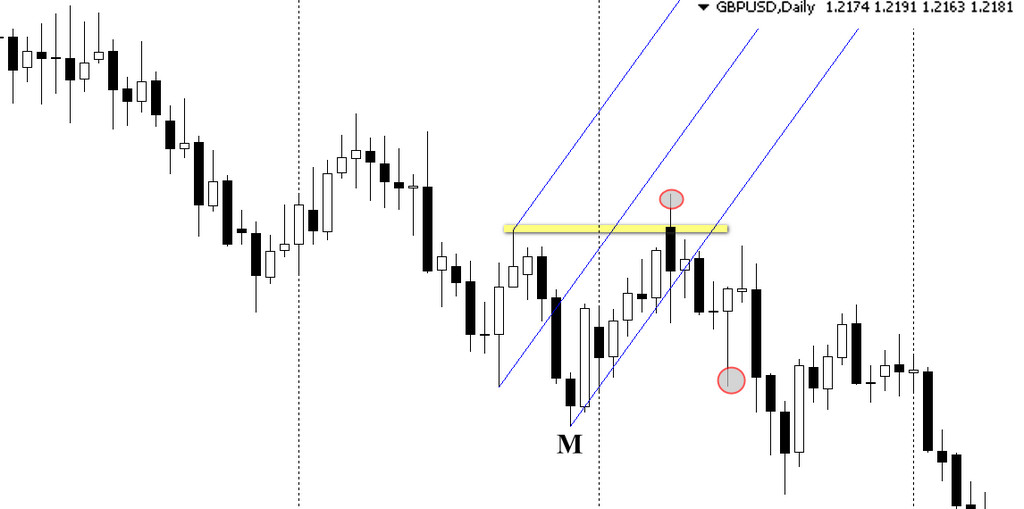
The inability of prices to reach the middle line indicates a high probability of trend continuation. The figure below shows the case when, after a new low in GBPUSD, the previous high was rewritten during the correction.
The shifted Andrews' Pitchfork, with support anchored at point M, shows a false reversal, since prices failed to reach the median line and set a new low beyond support.
Dynamic Market Analysis with the Andrews' Pitchfork Indicator

Forex currencies, securities or commodities have variable volatility. An unpredictable increase or decrease in the trading range of candles changes the slope of the trend vector, leaving its direction unchanged.
An increase in the amplitude of fluctuations forces the trader to redraw points H and L. Point M of Andrews' Pitchfork remains unchanged until the trend reverses. The techniques described above for forecasting a change in direction or continuation of the trend help determine how and when the tines should be moved.
You can judge whether the redrawn pattern is correct by a simple sign: most price values should remain inside the channel. If a currency pair sets new lows or highs outside Andrews' Pitchfork, that indicates the pattern has been exhausted.
In this case, the trader should:
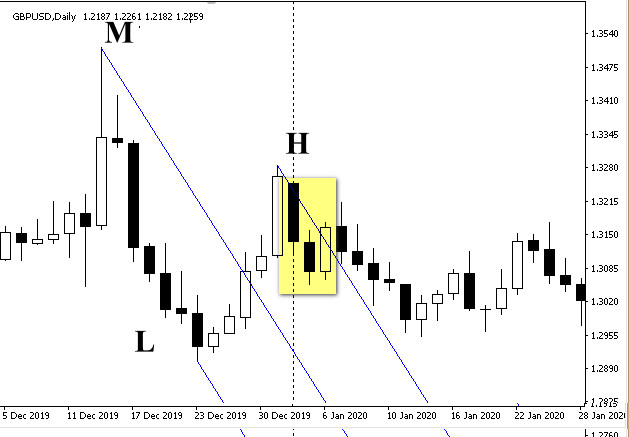
One more important note: to draw the support and resistance lines of the pitchfork, we choose the corrective move with the greatest amplitude.
In the example below, the reversal was confirmed after a downward breakout of the previous trend's low. As a result, we have two correction waves, points H and L, and we choose the correction with the greatest distance from low to high.
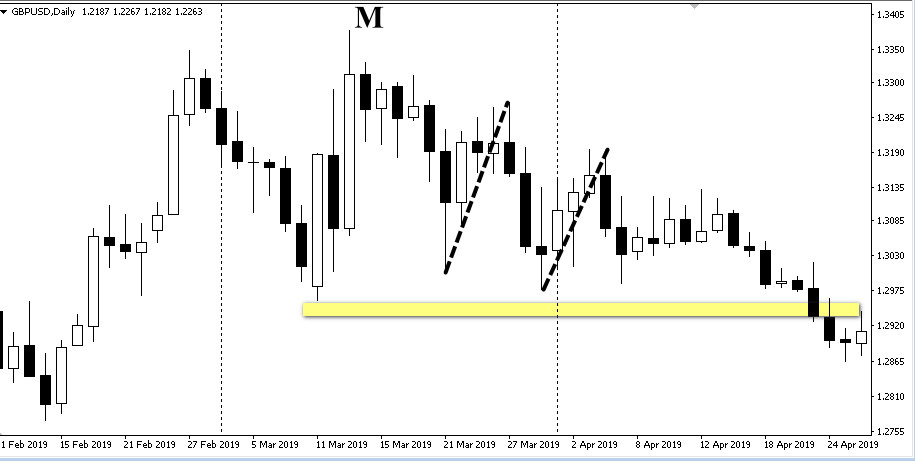
It is quite obvious that the constructed figure does not describe the prices of a downward trend, so we are waiting for the formation of a new correction after the breakout of the minimums of the previous growing trend.
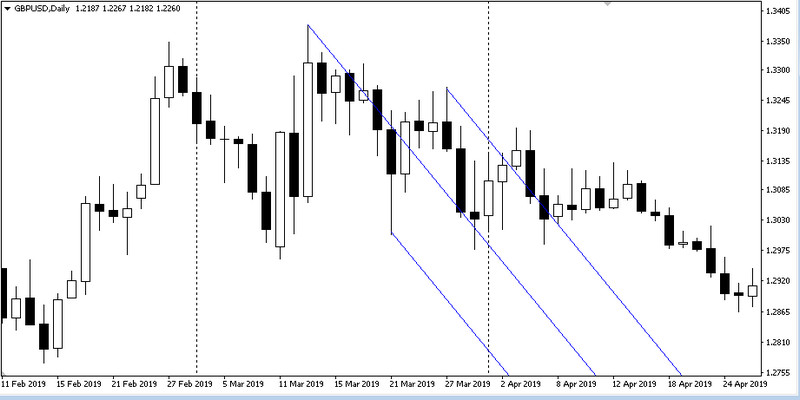
As can be seen from the figure below, the new construction lasted for three months, despite a significant delay in identifying the correct lines of the figure.
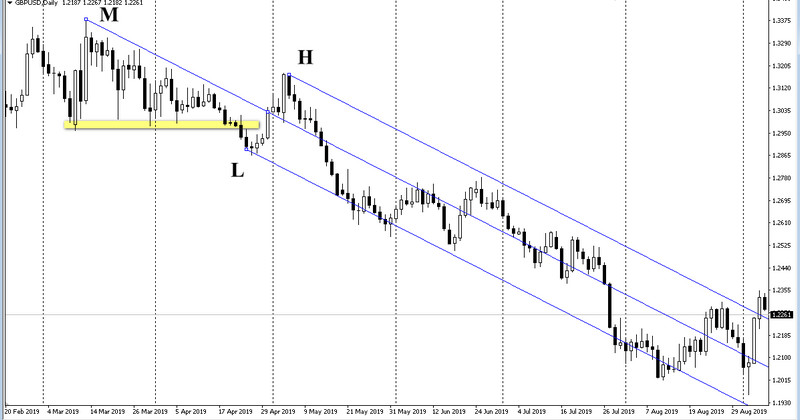
The following is an example of an uptrend, which was confirmed by exceeding the highs of the previous fall in GBPUSD prices.
In this case, the “swing zone” on a rapidly growing trend was formed by two candles. They were larger than the others and perfectly described all the fluctuations until the onset of a strong correction - a common market reaction to impulse growth.
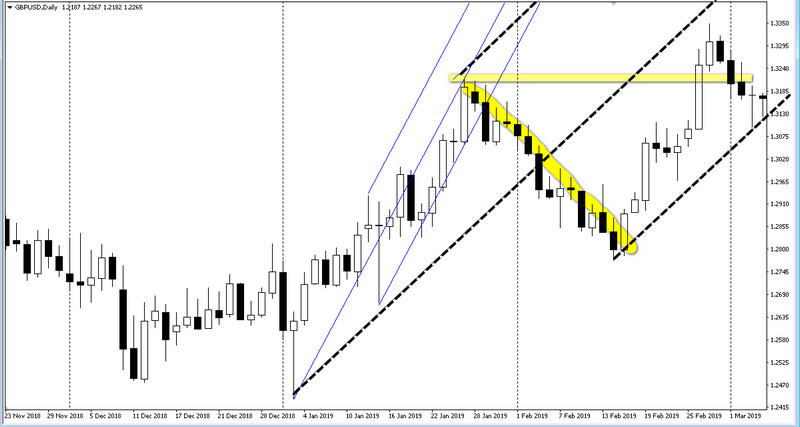
We move the Andrews pitchforks to a new maximum range as soon as the correction ends and the trend updates the previous maximum.
Trading with the Andrews' Pitchfork Indicator

Trade setups with Andrews' Pitchfork follow the same technique used with other channel indicators. Traders place pending orders or enter at market on breakouts of the pitchfork tines, catching pullbacks toward the median line, which plays the role of an information indicator. Failure to reach the middle of the channel increases the odds of a resistance or support breakout depending on where prices are positioned.
The first condition for opening a position is a test of resistance/support (a false breakout) followed by a pullback to the median line. It should then produce a rebound with a repeated retest of resistance.
Ideal position conditions: quick return of prices that fail to reach the midline or just touch it, as shown in the bottom chart.
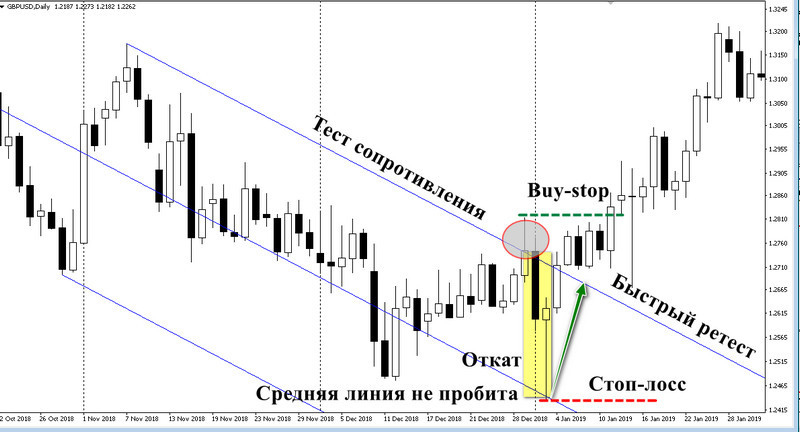
After a rebound from the median line, the trader places a pending order, in this example at the high of the false resistance breakout; in a downtrend it would be at the support low. Once the trade is opened, the stop loss is set at the level of the median-line breakout.
You can control your position using offset Andrews pitchforks, which makes it possible to “catch” the beginning of a reversal or apply a trailing stop. The indicator is drawn in the opposite direction, where one of the tines is the stop loss point.
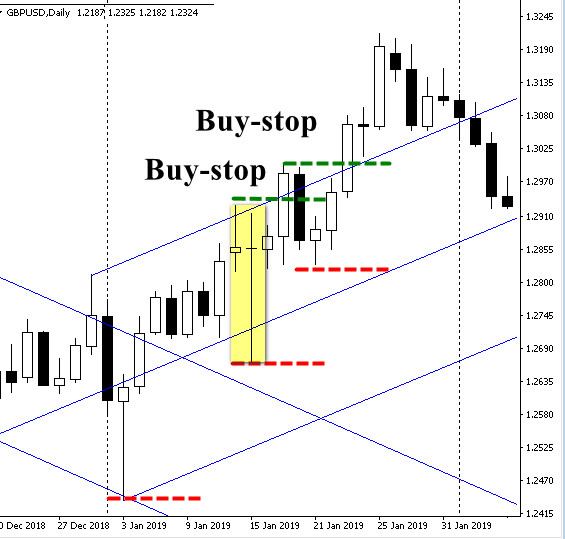
The principle for determining the new loss-limiting level is the same: it is set at any lows above the median line in the new channel. In the example shown above, the chart presents another opportunity to enter a long position, but the money management of this trade differs from the previous one because it is taken with the trend.
As can already be seen from the chart, the conditions for opening a position for a channel breakout along the trend are no different from those described above: the middle line should provide a quick rebound, which gives a signal to move the Buy stop pending order above the maximum of the resistance breakout.
But a channel breakout in the direction of the trend is a signal that the amplitude is increasing, which will lead to a strong correction. The trade should be closed immediately after the candle closes, and a new one should be opened if the entry conditions repeat.
A short position is opened inside the channel at market after the pitchfork line is pierced and prices return back. There should not be two candles outside the channel with closing prices below the support line. The ideal option is a wick touch or only a slight move beyond the line by a bullish candle that is immediately replaced by a corrective bearish candle.
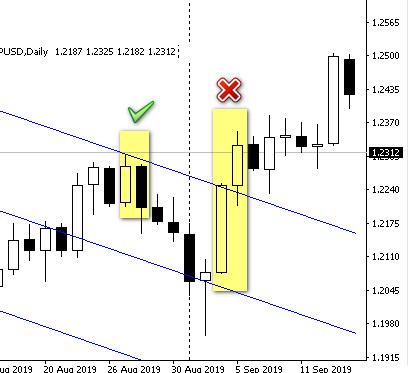
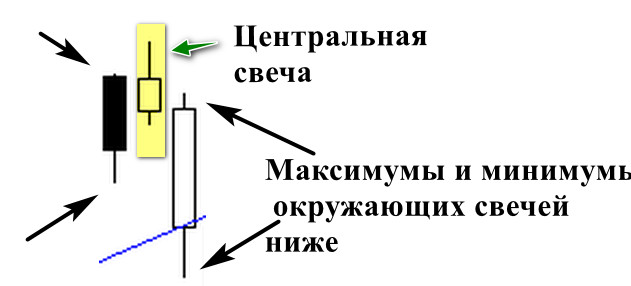
The position is opened at market as soon as a Williams top forms after a test of resistance: the highs and lows of the two surrounding candles must be below the extremes of the central candle.
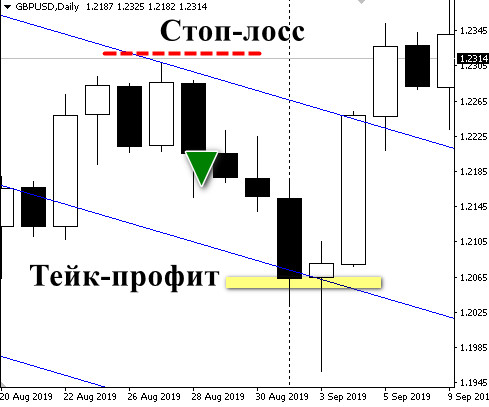
The trade is held until the middle line is reached or the stop loss set at the Williams top is triggered.
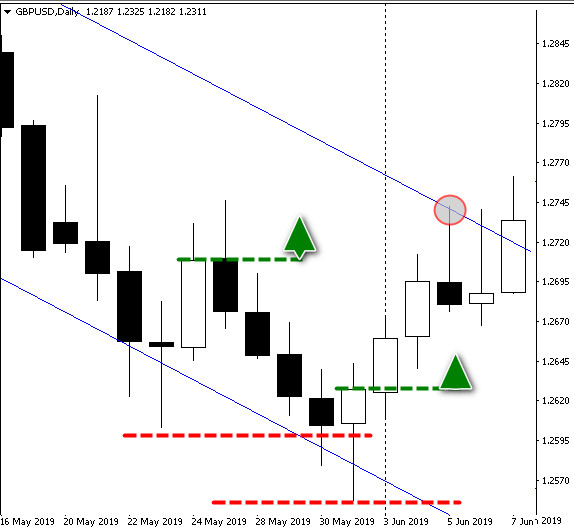
A long position is opened on the mirror principle: after testing the support line, a three-candle Williams bottom should form. This becomes the signal to enter at market price. The trade is held until the median line is crossed or the stop loss at the Williams low is hit.
Conclusion

Andrews' Pitchfork is an ideal option for trend trading if you use these patterns in combination, assessing the probability of a trend reversal at each extreme with the help of “shifted” versions of the pattern. In this case, trend-confirmation signals can come from medium-term and long-term trades opened on a channel breakout.
The author of the strategy suggested, for reliability, combining signals on different timeframes in search of matching trends. The principles of such a system are described by Dr. Elder in the famous "Three Screens".
The Andrews indicator is another example of Price Action trading, where price movement and three lines provide a reliable forecast without using fundamental analysis or economic indicators.
Respectfully, Ivan Petrov
Tlap.io