
Weis Wave Indicator: More Than Just a Sum of Volumes
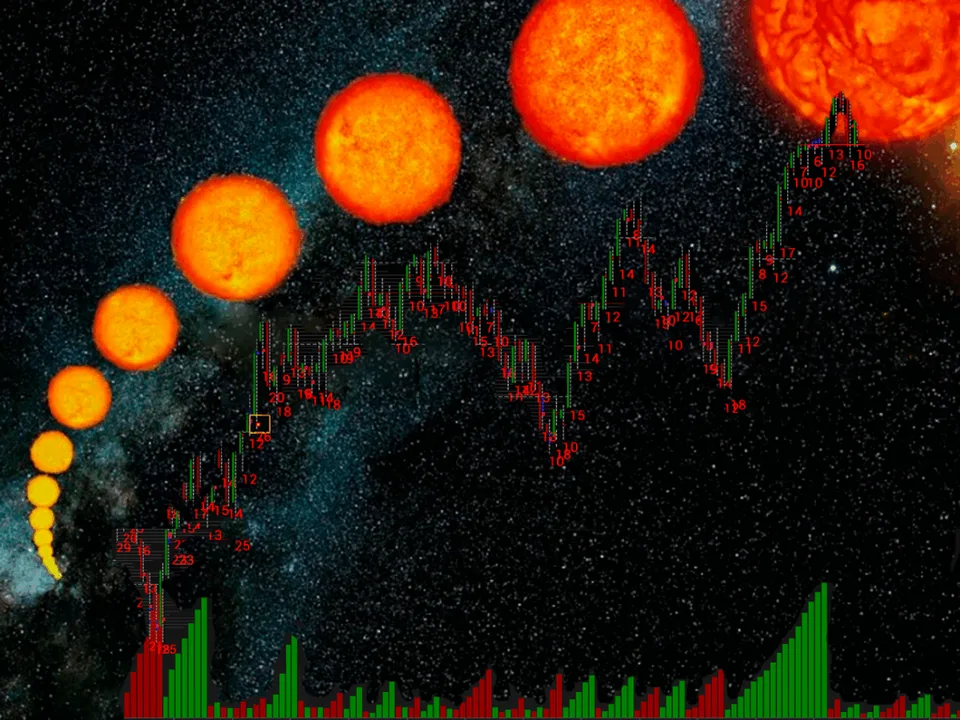
Since the mid-2010s, the Weis Wave indicator has firmly entered the arsenal of professional traders. The indicator is very simple: it sums the trading volumes of bars directed in one direction.
Weis Wave shows the strength of an impulse: the more money poured into the move, the more reliable it is. But without proper experience and understanding of context, you can get badly burned, as always.
In the article below, we will look at the features of the Weis Wave cumulative volume indicator for evaluating context and discuss ways to use it.
What the Weis Wave indicator is in simple terms
Weis Wave is a method of analyzing one-sided price movement with accumulated volume in each "wave," developed by David H. Weis as part of an adaptation of the Wyckoff method.
David Weis developed Wyckoff's ideas as follows. The market moves in waves (an alternation of impulses and pullbacks), and the most important thing is not just the amount of volume in a bar, but the total amount of volume spent on the entire price impulse.

The total wave volume shows how strong the pressure of market participants was in this move. It helps answer a trader's key question: does volume support the current price move, or is it happening on "thin" volume and may be vulnerable to a pullback/reversal. This is the central idea that runs through the whole method.
The indicator was first presented by Weis in the early 2010s: from 2011 he spoke about the method in his lectures and offered a plugin for the trading platforms that were popular at the time. In 2013, the book "Trades About to Happen" was released, in which the method was formally described, after which it went mainstream.
What the author of the method says about Weis Wave
The author's interpretation is as follows.
Growing volume in waves that confirm the direction indicates trend strength; decreasing volume as the move continues is a signal of weakness/potential reversal.
As long as price moves in one direction (an up wave or down wave), the indicator sums the volumes of all bars in that wave. When the direction changes, the wave "freezes" and the next one begins. Thus, instead of many separate volume bars, you see a single staircase of volume bars in the wave, cumulative volume, and they can be compared with each other.
To build the cumulative volume histogram, Weis recommended using Renko charts. Below is just such a chart, where you can see that the key expansion took place on high volume, after which you can look for an opportunity to enter the market.
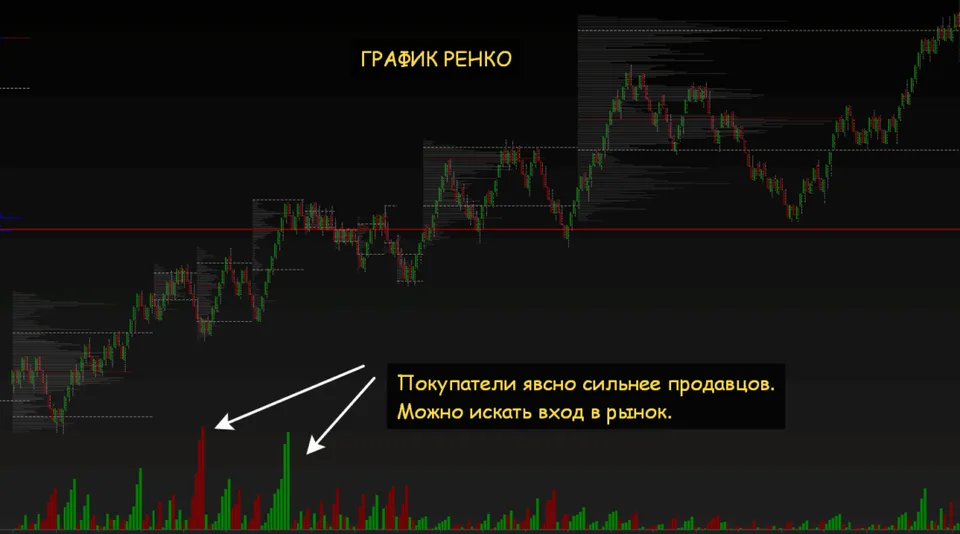
Weis recommends measuring wave length (range and time) and cumulative volume. The larger each parameter, the stronger and more reliable the impulse.
Experience working with the Weis Wave indicator
I first learned about this indicator back in 2019. I used it and still use it as a confirming signal for opening positions. I should say right away that I do not use Renko charts, since the indicator has also proven itself well on other chart types, including classic timeframes.
Classic impulse situation
In the example below, we will examine the minute chart of the same session that I gave above as an example of a Renko chart.
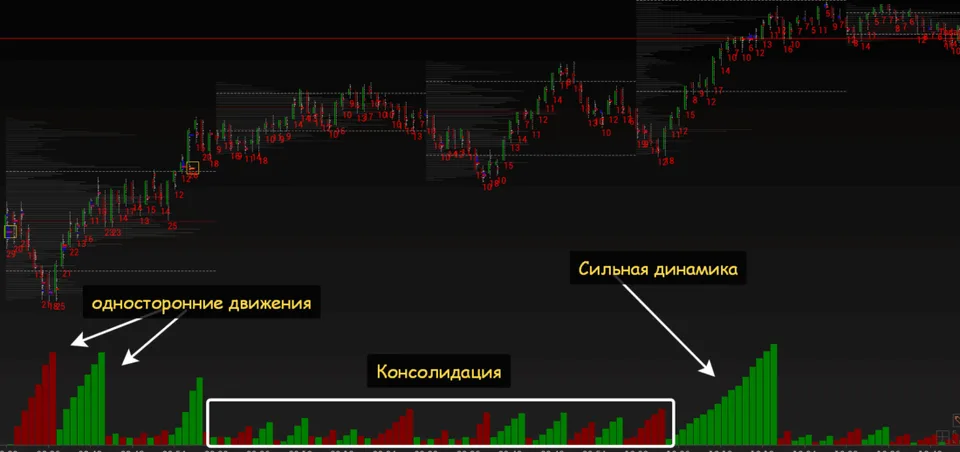
The screen shows that already within the session's initial balance, buyers are winning: they committed volume comparable to the sellers, but the price impulse turned out stronger.
After finding the value zone and volume accumulation in the flat, an expansion to the north occurs with confident volume growth over a relatively large number of bars.
Below is a screen of the same trading session. The result of buyer pressure at the beginning of the timeframe that is higher relative to the chart is visible in the second half of the session. The Weis Wave indicator shows volume growth on the quote's expansion to the north. Pullbacks occur on lower volume.
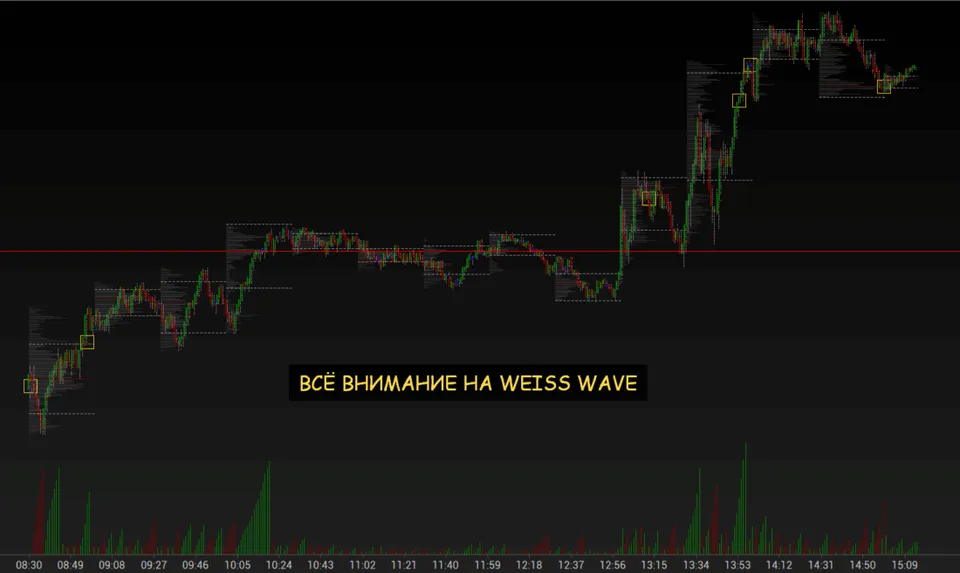
The session was difficult (deep pullbacks that could have been interpreted as reversals), but Weis Wave clearly showed the weakness of sellers at every stage. And this was without complex mathematical calculations.
As we can see, within the session this indicator works very well.
And what happens if we increase the timeframe a little? Let us examine the same session, but now on M5. We will also add the VWAP indicator to confirm the dynamics.
On M5, the strength of buyers is visible already at the very beginning of the trading session. Of course, this is also visible on the one-minute chart, but still the first few minutes to the short side can become a bit blurred there: within the initial balance this is normal, but on the lower timeframe it can be misleading.
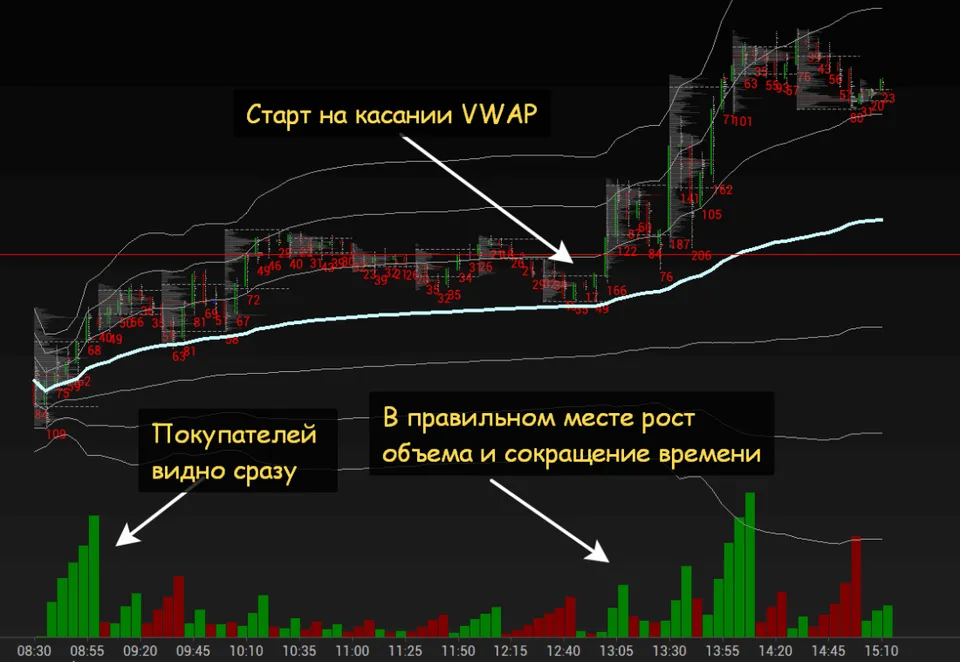
On M5, the pressure after 10 a.m. that appears on M1 and that is a fairly reliable signal for looking for buys is almost invisible. Clear buying pressure appears only after 13 hours CT. On the other hand, that was exactly when the real growth in momentum began. But it was the holding of VWAP with a sharp impulse to the +2 deviation during a sharp growth in Weis Wave over a short period of time that helped assess this.
Weis Wave Within Balance
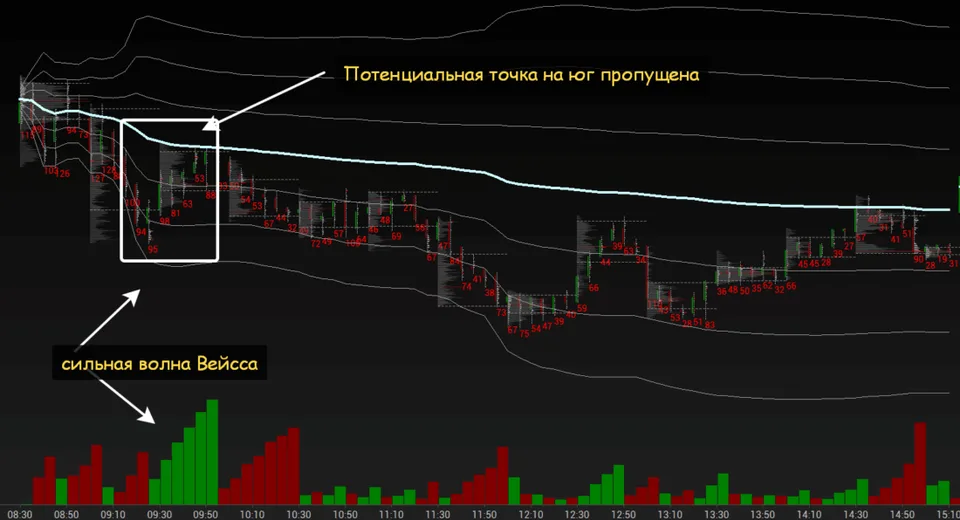
Here is an example of a south-directed session where cumulative buy volumes are stronger on M5 than on the short side. In this context, the indicator did not show itself in the best way: the point for a short entry on the test from below of VWAP could have been missed because of the Weis Wave readings.
Essentially, this is a classic divergence, but it is quite difficult to work with if you do not understand the context.
On M15, this session looks like this. With a range of 500 points (which is a lot for this instrument), the waves move out of sync.
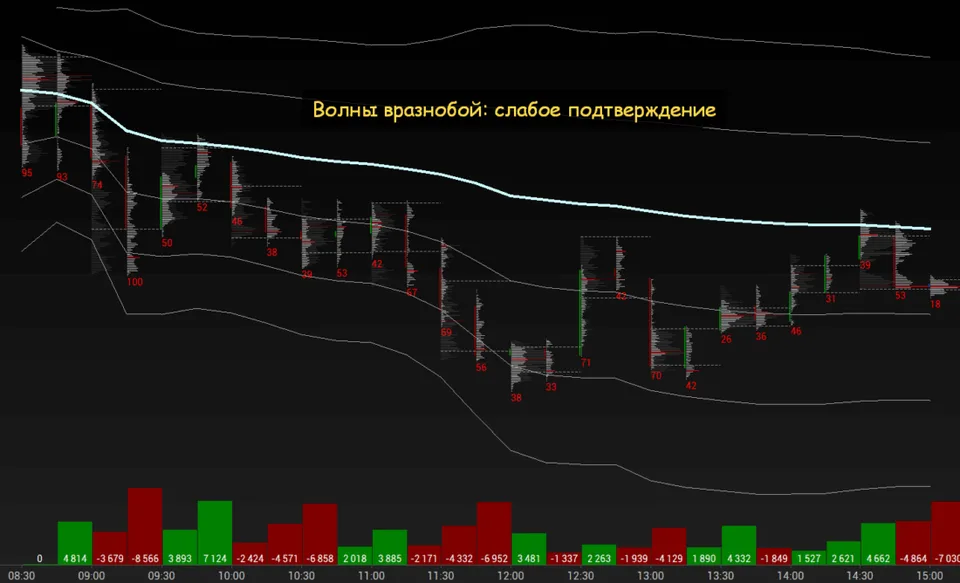
And now we need to look at the whole context. Let this session be the first. We see the next one opening a little higher and what seems to be confident seller pressure at its open. The result: the range was expanded a little, but still within balance.
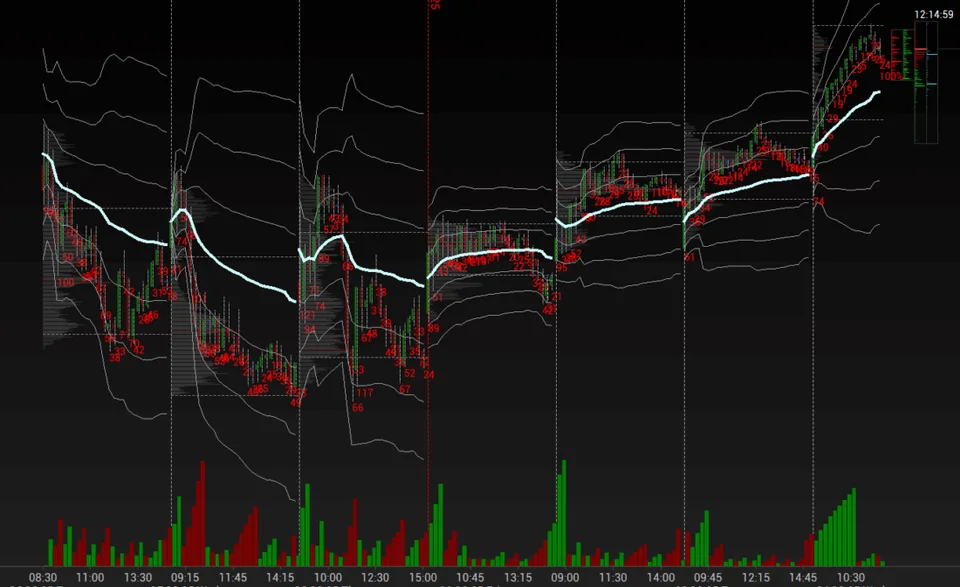
The next session again opens above the previous one and now without expansion to the south. And again the picture is mixed. Then we see weak buying pressure, which led to an expansion of pressure to the north.
Only in the second session did we see seller pressure that did not succeed. Limit buyers absorbed the sellers (market orders move the quote: buyers to the north and sellers to the south).
In fact, this is what the accumulation of liquidity in one direction or another looks like. And those first buyers that I showed at the beginning of the section and who then seemed weak were actually just gathering liquidity within the higher timeframe.
In other words, on the lower timeframe we saw divergence and a false signal, while on the higher one we saw the first purchase of a medium-term player, which was realized only a few days later.
Another example of working within balance.
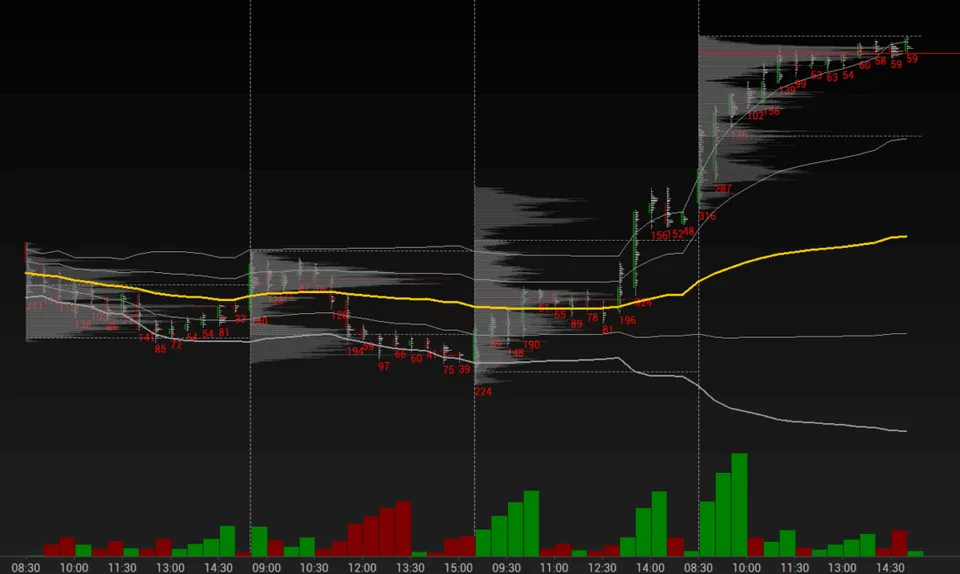
And again, southward pressure according to Weis Wave on M30 did not allow the quotes to expand. Moreover, it is clearly visible that almost all cumulative volumes were gathered in a flat area at the bottom. This is how a seller can accumulate. But for that, a sharp drop farther down is needed. If there is no such drop, then again we are talking about a limit and a reverse.
A comparable cumulative volume to the north gave a sharp return to the timeframe VWAP. And after that, the transition into impulse. A classic.
And What About the Higher Timeframes?
The situation on the higher timeframes generally looks similar. But it must be taken into account that on a higher timeframe the number of bars in one direction can be smaller than on a lower one. Which means that more attention must be paid to the range and the accumulated volumes.
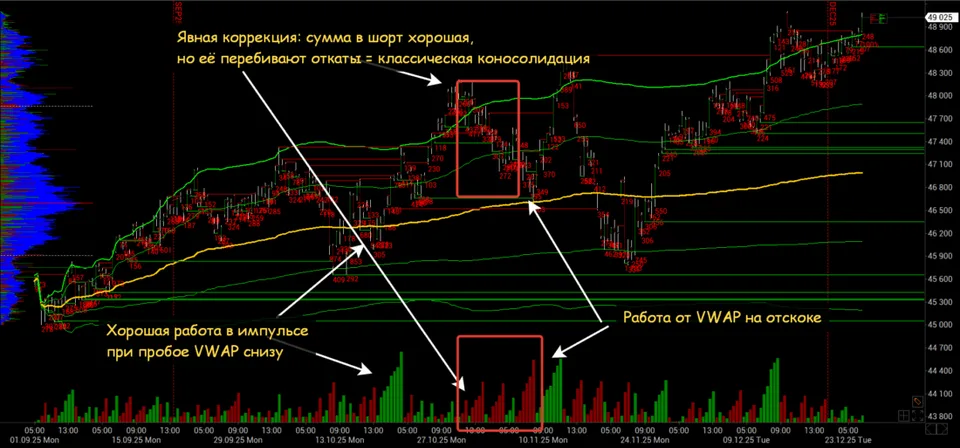
Here is the RTH H4 chart.
You can see that on a good impulse, you can join after a pullback. Entry confirmation: a VWAP breakout with a sharp rise to the +2 deviation with a weak correction to the +1 deviation. This is a classic VWAP buy entry, confirmed by Weis Wave.
Pullbacks on the higher TF are visible through a weak Weis Wave. The range may be comparable, but cumulative volumes are low due to the constant change of direction.
Thus, on the higher TF the Weis Wave indicator also shows itself well. But you need to take the overall context into account and look for an entry point using other indicators.
Where to Find the Indicator
The indicator is specific and requires a connection to exchanges to obtain real trading volume data.
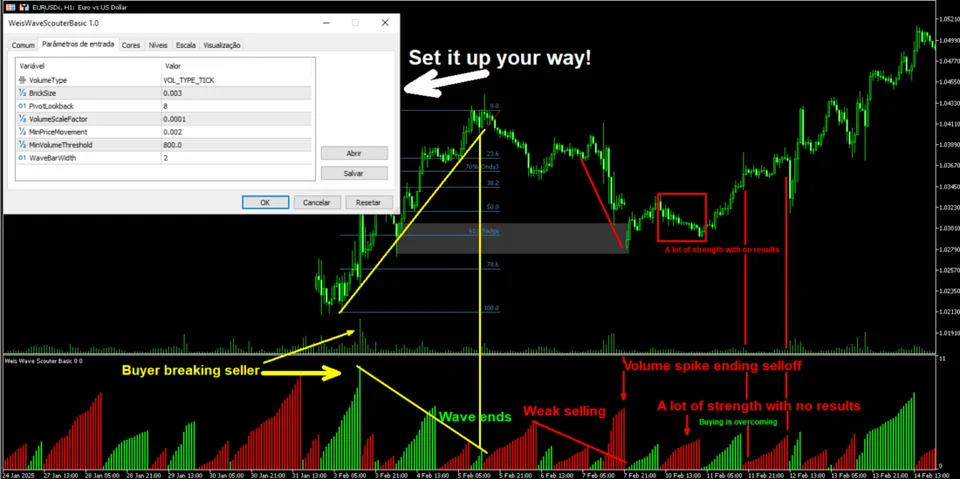
MetaTrader
MQL5 script developers worked around this requirement: instead of real volumes, the indicator uses tick volumes. In general, this can work too, although I am not a supporter of this method.
Almost all of the few Weis Wave implementations are paid, and among the free ones it is worth looking at The Weis Wave Scouter Basic.
TradingView
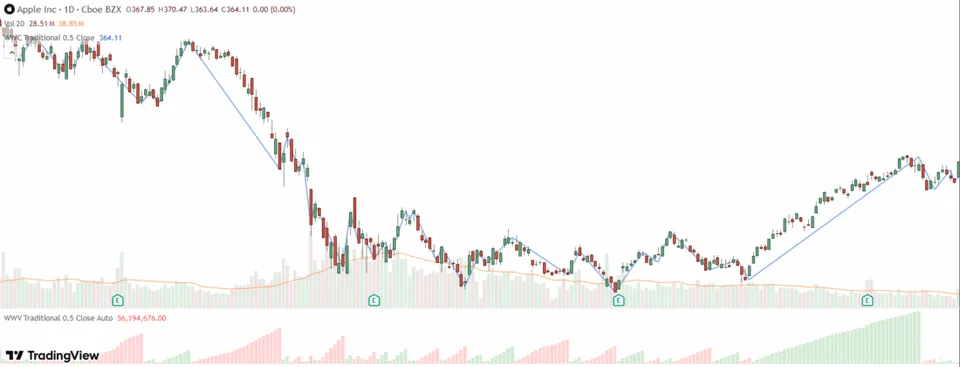
There are also not very many implementations of this indicator on this platform. They are also built on tick volumes, and nothing can be done about that.
Here is one of the successful examples — Weis Wave Volume.
Other Platforms
The Weis Wave indicator can be found in many paid trading terminals or purchased in app stores for terminals.

Conclusion
The idea of Weis waves is simple and elegant. All you need is to sum the volumes in each price "rise/fall" (wave) and compare the strength of the waves by the accumulated (cumulative) volume. This helps assess whether volume supports the price movement (the trend is strong) or whether volume "exhaustion" is occurring (a possible reversal).
Many sources provide deeper interpretations of the indicator than shown here. But I deliberately simplified the presentation so as not to clutter your head with unnecessary details, and showed only the most reliable methods of interpretation.
The main thing is simplicity. And the simplicity is that a sharply growing Weis wave at the breakout from accumulation is a powerful confirmation of the exit from accumulation.
Another powerful signal is a strong wave inside the balance without expansion or with almost no expansion, followed by a return to accumulation. Often this is a signal of an upcoming reversal in the direction opposite to that wave. But in that case, you can enter only after the range breakout. This is safe.
And most importantly, Weis waves work equally well in all markets.
Respectfully,
Ivan Rusin