
U.S. Stock Market Futures: Review and Forecast for 03/30-04/03/2026
{"blocks": [{"id": "xgzb010n", "data": {"html": "
"}, "type": "paragraph"}, {"id": "eie67jzv", "data": {"html": "
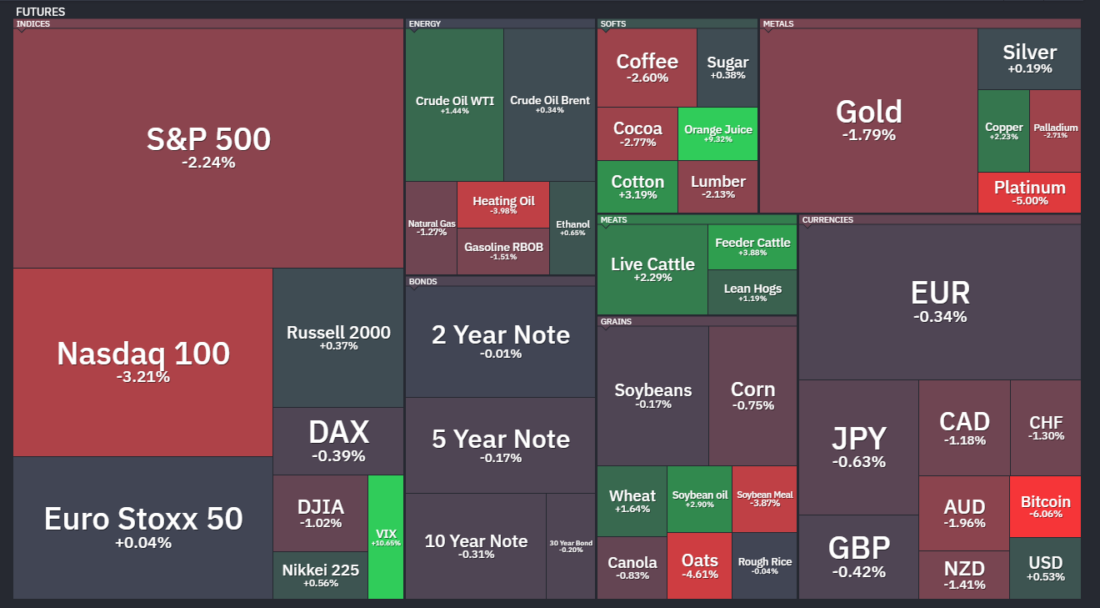
Stock markets, and along with them derivatives — futures — are being shaken up and down, but mostly down. I will not cite capitalization loss figures — I see no point.
"}, "type": "paragraph"}, {"id": "0lwtxu0s", "data": {"html": "
It is funny that before every new statement by Trump that everyone is about to make peace / reach an agreement, etc., large volumes somehow miraculously went through, earned their profit in an hour or an hour and a half, and left the market.
"}, "type": "paragraph"}, {"id": "2wftr7p1", "data": {"html": "
Among corporate news, let us note steam being let out of the AI bubble.
"}, "type": "paragraph"}, {"id": "yrn3qov5", "data": {"html": "
Thus, on March 24, 2026, OpenAI pleased investors by shutting down the Sora neural network. Whatever reasons may be named, one must understand the main problems of the AI bubble: actual long-term unprofitability, up to the impossibility of returning investments, and extremely high electricity consumption, which simply is not available in such quantities at the present time.
"}, "type": "paragraph"}, {"id": "qz4ge33w", "data": {"html": "
No changes on the fronts. The gap between the paper and real price of oil in some cases reaches 80%. At the same time, price is price, but the energy crisis is looming more and more. Especially since in the Black Sea and Baltic region not everything is smooth with supplies either.
"}, "type": "paragraph"}, {"id": "65iq2vcd", "data": {"html": "
Inflation has not gone anywhere either; it began to rise even before the start of the military campaign in Iran. Against this backdrop, American investors quite reasonably stopped waiting for a cut in the Fed rate. At the moment, 90% of investors are confident the rate will remain at the current level until the end of the summer and beyond. The remaining 10% expect the rate to rise.
"}, "type": "paragraph"}, {"id": "4vysraow", "data": {"alt": "futures", "url": "/uploads/2026/03/image-111-1100x704.png", "size": "100%", "align": "center", "caption": "", "linkUrl": ""}, "type": "image"}, {"id": "ih70fx4p", "data": {"html": "
The VIX volatility index is not encouraging either, as it continues to rise steadily. If one looks at the chart not as an oscillator, but as an ordinary chart of an ordinary instrument, then it turns out that an impulsive breakout above 30 toward 40 is about to happen. But looking at VIX that way is fundamentally wrong.
"}, "type": "paragraph"}, {"id": "5sdm3k97", "data": {"html": "
And if one looks at it as an oscillator, one can see a sharp release of tension, for which de-escalation is needed.
"}, "type": "paragraph"}, {"id": "56vv34d2", "data": {"alt": "futures", "url": "/uploads/2026/03/image-112-1100x545.png", "size": "100%", "align": "center", "caption": "", "linkUrl": ""}, "type": "image"}, {"id": "06zif73h", "data": {"html": "
Now let us move on to a review of the main stock index futures — ES, NQ, YM.
"}, "type": "paragraph"}, {"id": "85huu0g7", "data": {}, "type": "readmore"}, {"id": "bhtpzdos", "data": {"text": "YM Futures (DJ-30)", "align": "center", "level": 2}, "type": "heading"}, {"id": "ni3i4jyd", "data": {"html": "
The first “clean” week of the June futures has passed. And here is what I would like to note.
"}, "type": "paragraph"}, {"id": "m1tftufn", "data": {"html": "
The first money came through around the 46450-46800 range, which once served as support. All the week's liquidity is located precisely there. And this is a very bad signal for buyers. The key word is bad.
"}, "type": "paragraph"}, {"id": "vqru70en", "data": {"alt": "futures", "url": "/uploads/2026/03/image-113-1100x566.png", "size": "100%", "align": "center", "caption": "", "linkUrl": ""}, "type": "image"}, {"id": "bflwhsja", "data": {"html": "
Now the quote ended the week at the upper boundary of the September 2025 contract core, which is in the 44530-45110 range. If earlier I assumed that it could be stopped in this range, now there is a fairly persistent feeling that we will see the quote at the upper or lower boundary of the 43250-43750 range. And even with tails at +/- 43000.
"}, "type": "paragraph"}, {"id": "p4u384x1", "data": {"html": "
What is this range? It is the imbalance zone at the opening of that very September 2025 contract.
"}, "type": "paragraph"}, {"id": "28i423cv", "data": {"html": "
How can we get there? We can drop straight like a stone and then trade around. We can show 44500, trade from there to 45600, and move toward the target range.
"}, "type": "paragraph"}, {"id": "5mv4uljy", "data": {"html": "
On the daily chart I will show the development of the short impulse that began on February 12.
"}, "type": "paragraph"}, {"id": "ssej4hb0", "data": {"alt": "futures", "url": "/uploads/2026/03/image-114-1100x567.png", "size": "100%", "align": "center", "caption": "", "linkUrl": ""}, "type": "image"}, {"id": "q80irlu5", "data": {"html": "
At the -1 deviation from the VWAP of the March 16-17 impulse, a clean tactical short was built and we went south (range 47250-47450). This week sellers did a good job in the 46680-46830 range. And all the liquidity placed down to 46000 was ultimately positioned clearly short.
"}, "type": "paragraph"}, {"id": "vll3k50b", "data": {"html": "
If viewed from the standpoint of the large short impulse, we came straight to the -2 deviation from VWAP. This means that at the current stage the expansion south may be limited by a conditional 44500 (as discussed above), followed by a return.
"}, "type": "paragraph"}, {"id": "6hgr5jx7", "data": {"html": "
In any case, a strong seller should not let it go beyond the 45720-45910 range at the moment, and in the extreme case no further than 46050-46220, if they play a volatile decline with large pullbacks.
"}, "type": "paragraph"}, {"id": "xfwyfavm", "data": {"text": "ES Futures (S&P 500)", "align": "center", "level": 2}, "type": "heading"}, {"id": "1my3iro4", "data": {"html": "
ES futures fell more than 2% from the week’s open and almost 5% from the week’s highs. That is not little.
"}, "type": "paragraph"}, {"id": "y8zgwn2c", "data": {"html": "
The week closed at the lower boundary of the 6400-6490 range. The week’s liquidity is all above, just as on the previous instrument.
"}, "type": "paragraph"}, {"id": "wb5nn5kd", "data": {"alt": "futures", "url": "/uploads/2026/03/image-115-1100x564.png", "size": "100%", "align": "center", "caption": "", "linkUrl": ""}, "type": "image"}, {"id": "df4z9vag", "data": {"html": "
And if so, the targets for the first half of April are at the upper boundary of the 6150-6235 range, although the lower boundary can also be touched with tails. I see no point in drawing the scheme further.
"}, "type": "paragraph"}, {"id": "vzs7gptt", "data": {"html": "
Of course, there is an understanding of how such a scheme can be played short if the overall situation worsens. But why do that if there are always nuances?
"}, "type": "paragraph"}, {"id": "cilj14vy", "data": {"html": "
On this instrument we will build the short impulse from February 26. And here it is very clear that it collapsed immediately to the -3 deviation of the impulse VWAP.
"}, "type": "paragraph"}, {"id": "qcilob6a", "data": {"alt": "futures", "url": "/uploads/2026/03/image-116-1100x566.png", "size": "100%", "align": "center", "caption": "", "linkUrl": ""}, "type": "image"}, {"id": "a3bbzw1r", "data": {"html": "
During the week, sales were built within the -1 deviation from the impulse VWAP. The accumulation range is 6635-6660.
"}, "type": "paragraph"}, {"id": "2wjrlqim", "data": {"html": "
If for some reason at the beginning or in the middle of the week they find a reason for growth, then the targets may be no further than 6584–6609. Within the short impulse, pullbacks at the beginning of the week are expected to 6456–6477, and if playing it a bit more interestingly, then up to 6500–6520 for a partial trading-through of the imbalance from the end of last week.
"}, "type": "paragraph"}, {"id": "pyiil9aw", "data": {"text": "NQ Futures (Nasdaq-100)", "align": "center", "level": 2}, "type": "heading"}, {"id": "ooor80vs", "data": {"html": "
NQ futures still look weaker than all the others, which is normal for this instrument. During the week they calmly came to the lower boundary of the 23200-23600 range. And this, of course, speaks to the weakness of buyers or their complete absence.
"}, "type": "paragraph"}, {"id": "73alstnh", "data": {"alt": "futures", "url": "/uploads/2026/03/image-117-1100x562.png", "size": "100%", "align": "center", "caption": "", "linkUrl": ""}, "type": "image"}, {"id": "x5brm1gf", "data": {"html": "
The targets for a further decline are at least 22800, and even 22200 would not be out of place.
"}, "type": "paragraph"}, {"id": "lbvea57s", "data": {"html": "
Aggressive sell-offs are best seen in this instrument. The imbalance in both directions in 24000–24500 stands out very clearly. And so far there are no hints that they will go trade through this “hole” in the profile.
"}, "type": "paragraph"}, {"id": "1ubi89jv", "data": {"text": "Conclusion", "align": "center", "level": 2}, "type": "heading"}, {"id": "m3fawg8b", "data": {"html": "
Stock index futures are looking further downward. And nothing can be done about this until the geopolitical situation changes and the Fed enters the game. And in the current situation, the Fed is postponing its entry into the game, since inflation is accelerating at a rapid pace.
"}, "type": "paragraph"}], "version": 1}