
U.S. Stock Market Futures: Review and Forecast for 20-24/04/2026
{"blocks": [{"id": "8isk7glh", "data": {"html": "
"}, "type": "paragraph"}, {"id": "28tj38a0", "data": {"html": "
Last week unfolded under the sign of peace negotiations between the United States and Iran. By the end of the week, Trump broadly lifted the American blockade from the Strait of Hormuz. Traditionally, as soon as the markets closed, Iran replied that it was necessary to stop blocking the ports.
"}, "type": "paragraph"}, {"id": "pr3dgni6", "data": {"html": "
Be that as it may, stock index futures are in an extremely optimistic mood. Almost all instruments (except the Dow) updated their all-time highs. This is a classic game of "buy the rumors and sell the facts". There are not many facts yet, and on rumors one can keep growing.
"}, "type": "paragraph"}, {"id": "qgef5kox", "data": {"html": "
However, the growth is supported by optimism in the technology sector. But the question remains: where to get rare-earth metals, cheap energy, water, copper, etc., in order to provide the basic infrastructure for AI.
"}, "type": "paragraph"}, {"id": "ulm8fhnh", "data": {"html": "
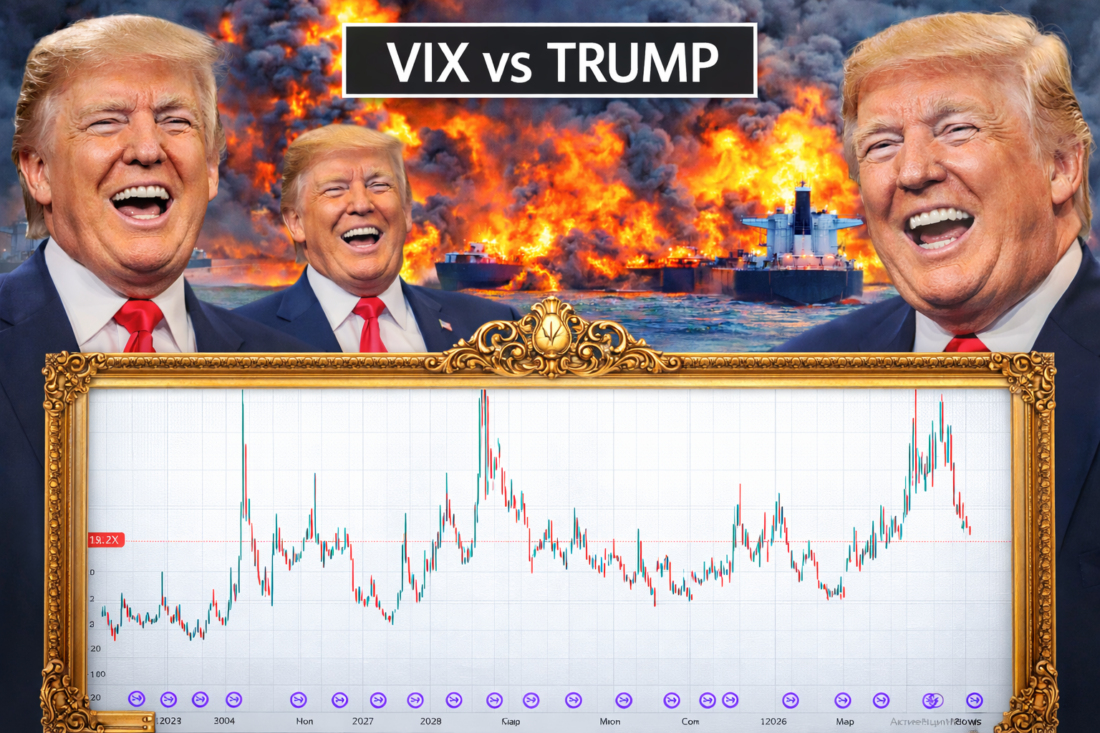
Against the backdrop of boundless optimism, the VIX volatility index reached 20 points. At the same time, on April 14, 2.34 million contracts were turned over on paper. There had not been that many either before the conflict began or after.
"}, "type": "paragraph"}, {"id": "0klmdzvr", "data": {"html": "
So we are watching VIX: if it rises above 22 while equities start falling, then there is a high probability of a serious decline. And if VIX goes below 18-20, then funds will still have time and strength for another expansion to the north.
"}, "type": "paragraph"}, {"id": "oxov2c5j", "data": {"html": "
And now let us talk about ES / YM / NQ futures. It is difficult to talk, as I missed the reversal moment, not believing that the market was showing the strongest buy impulse.
"}, "type": "paragraph"}, {"id": "4r897g24", "data": {}, "type": "readmore"}, {"id": "f117ftsm", "data": {"text": "YM Futures (DJ-30)", "align": "center", "level": 2}, "type": "heading"}, {"id": "xmi0cmmj", "data": {"html": "
YM futures are lagging behind other stock index futures. Players managed to overcome the resistance zone in the 49350-49750 range (weekly chart). If we proceed from the fact that market sentiment is unlikely to change in the coming weeks, then the 50000 mark will be reached very soon.
"}, "type": "paragraph"}, {"id": "0uow5yme", "data": {"alt": "futures", "url": "/uploads/2026/04/image-45-1100x563.png", "size": "100%", "align": "center", "caption": "", "linkUrl": ""}, "type": "image"}, {"id": "5s4mrzuk", "data": {"html": "
Now let us move on to the analysis of the daily timeframe.
"}, "type": "paragraph"}, {"id": "tymw9np1", "data": {"html": "
In the previous review, I said that it was necessary to trade through the volume gap formed in the post-market on April 7. But they did not do that. And it was absolutely not necessary to do it, given the market structure.
"}, "type": "paragraph"}, {"id": "chpovyuf", "data": {"html": "
Overbought conditions were removed through a flat move in the general range of 47830-48150. Overall, this happened back the week before last. In the past week, from Tuesday to Thursday (April 14-16), liquidity was accumulated in the range where the VAL zone is 48370-48400 and the VAH zone is 48670-48800.
"}, "type": "paragraph"}, {"id": "9bu3goas", "data": {"html": "
Already on Friday, April 17, the quote produced another impulse. This is the third expansion into buy. And usually the third expansion is the last.
"}, "type": "paragraph"}, {"id": "2zovml4v", "data": {"html": "
Friday closed at the very highs: the 49640-49810 range. Liquidity for pushing through is located in the 49290-49360 range.
"}, "type": "paragraph"}, {"id": "ljqthmf4", "data": {"html": "
And again, as last week, I will talk about the need for reverse trading. Well, I just cannot proceed from the idea that the guys are ready to keep driving the quote north through flats.
"}, "type": "paragraph"}, {"id": "oca8bd0b", "data": {"html": "
The sharply increased open interest on Friday at the highs also speaks in favor of this idea. This is how a reversal is usually prepared, even if only a tactical one.
"}, "type": "paragraph"}, {"id": "8non077z", "data": {"html": "
The next point suggesting the probability of a reversal is the weekly and daily close around the +2 deviation from the buy impulse that began on March 30. Usually in such models they trade back toward the +1 or +1.5 deviation, if the mood is extremely aggressive.
"}, "type": "paragraph"}, {"id": "leijw2p0", "data": {"alt": "futures", "url": "/uploads/2026/04/image-46-1100x568.png", "size": "100%", "align": "center", "caption": "", "linkUrl": ""}, "type": "image"}, {"id": "03m7m6d6", "data": {"html": "
In general, I would definitely expect trading around 49000, and from there they may show 48000 by Wednesday.
"}, "type": "paragraph"}, {"id": "jnq74cik", "data": {"html": "
The alternative is to go north again through a flat not below 49000 by Wednesday-Thursday.
"}, "type": "paragraph"}, {"id": "7smwylwm", "data": {"html": "
Another alternative is to gather liquidity closer to 50000, which is first distributed as a pullback south. This is Tuesday-Wednesday.
"}, "type": "paragraph"}, {"id": "1ywhza9c", "data": {"text": "ES Futures (S&P 500)", "align": "center", "level": 2}, "type": "heading"}, {"id": "txvgy0k1", "data": {"html": "
ES futures updated the historical high by 2%. This is a very serious result from a high base. Over three weeks the growth was about 11.5%..
"}, "type": "paragraph"}, {"id": "2hekn732", "data": {"alt": "futures", "url": "/uploads/2026/04/image-47-1100x564.png", "size": "100%", "align": "center", "caption": "", "linkUrl": ""}, "type": "image"}, {"id": "756ebfay", "data": {"html": "
It gives the impression that the quote is aiming toward 7300, but let us not get ahead of ourselves.
"}, "type": "paragraph"}, {"id": "g7be42fv", "data": {"html": "
On the daily cluster chart, the situation is also quite unambiguous. If on YM futures there was at least a three-day liquidity accumulation in a flat, which makes the growth more sustainable, then on ES futures the consolidation was only on Thursday, April 16, in the 7058–7080 range.
"}, "type": "paragraph"}, {"id": "zy6lhr1s", "data": {"html": "
The week was closed in the 7152–7176 range, and they broke into the range after aggressively gathering liquidity in the 7120–7138 area.
"}, "type": "paragraph"}, {"id": "8o6b957r", "data": {"alt": "futures", "url": "/uploads/2026/04/image-48-1100x567.png", "size": "100%", "align": "center", "caption": "", "linkUrl": ""}, "type": "image"}, {"id": "9blknl4p", "data": {"html": "
What is the plan? My opinion is simple: a pullback to 7058–7080, and maybe straight to 6988–7006. If they do not go beyond 7050, they may shift into rotations of 7050–7150 or 6950–7050.
"}, "type": "paragraph"}, {"id": "a08q0qwj", "data": {"html": "
I do not see a continuation of the explosive growth, but Trump can arrange even more than that.
"}, "type": "paragraph"}, {"id": "09sg43zg", "data": {"text": "NQ Futures (Nasdaq-100)", "align": "center", "level": 2}, "type": "heading"}, {"id": "lfw5o7bx", "data": {"html": "
And the last futures contract for today. The NQ instrument showed colossal growth of about 15%.
"}, "type": "paragraph"}, {"id": "zbnnal1p", "data": {"html": "
The futures contract is much closer to the potential target than other quotes (+2 deviations from the impulse VWAP since April 2025). And judging by the news available on April 19, there is no reason to swap optimism for fear.
"}, "type": "paragraph"}, {"id": "mgikfet5", "data": {"alt": "futures", "url": "/uploads/2026/04/image-49-1100x564.png", "size": "100%", "align": "center", "caption": "", "linkUrl": ""}, "type": "image"}, {"id": "mzf8toos", "data": {"html": "
If we talk about the daily timeframe, it is worth paying close attention to the following points.
"}, "type": "paragraph"}, {"id": "cs9zoi0j", "data": {"html": "
The main support zone is in the 25000-25350 range. This is exactly where the move started on April 13. Every day except Thursday had an impulsive look. And Thursday itself, if viewed within the intraday movement, was a place to add volume for the next move.
"}, "type": "paragraph"}, {"id": "erz8bkb2", "data": {"html": "
In any case, Thursday's range (if taken very broadly, 23600-26500) can safely be marked as a support range. Of course, a pullback to 25900-26000 is also possible if buyers move on to normal work.
"}, "type": "paragraph"}, {"id": "n6qdgxo4", "data": {"alt": "futures", "url": "/uploads/2026/04/image-50-1100x581.png", "size": "100%", "align": "center", "caption": "", "linkUrl": ""}, "type": "image"}, {"id": "07usn4db", "data": {"html": "
The weekly close took place in the 26990-26875 range, around +2 deviations from the VWAP impulse. For now it is hard to believe that on Monday Americans will be ready to work higher, but we will see.
"}, "type": "paragraph"}], "version": 1}