
Two Fingers Strategy - easy as pie
 Hello, fellow forex traders!
Today we will look at a simple trading strategy from our forum called Two Fingers (“Two Fingers”). The name of the system can be seen either as a sign of the strategy's simplicity or as the famous V, the sign of victory. It is based on following the trend on daily charts, while we will enter on corrections using a lower timeframe. The system has already gained huge popularity due to its effectiveness.
System Characteristics
Platform: any
Currency pairs: any
Timeframe: D1-H4
Trading time: around the clock
Recommended brokers: Alpari, Roboforex, Exness
Installation

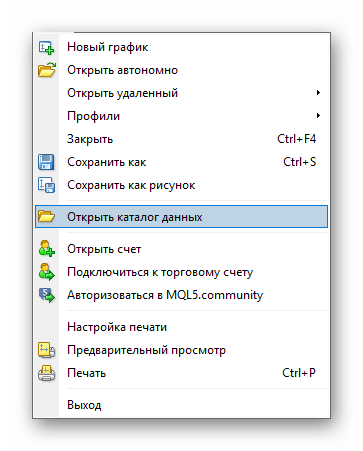
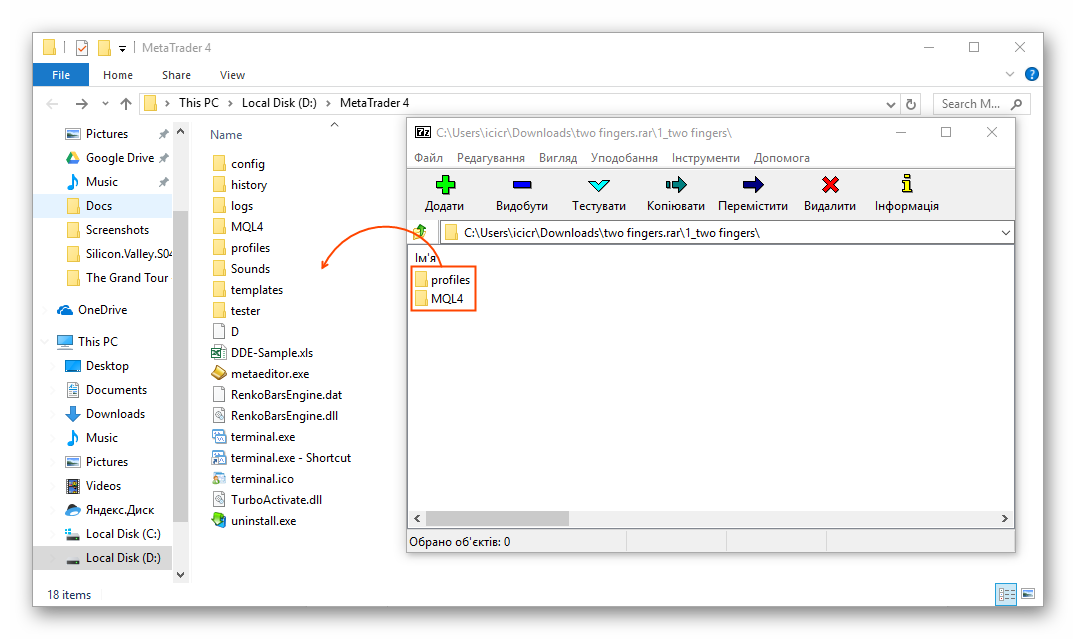
Installing the system is quite simple. You only need to copy the MQL4 and profiles folders from the archive into the data directory of MetaTrader 4. To do this, open the terminal data directory via “File” - “Open Data Folder”.
 Then simply drag the files from the downloaded archive and restart the terminal.
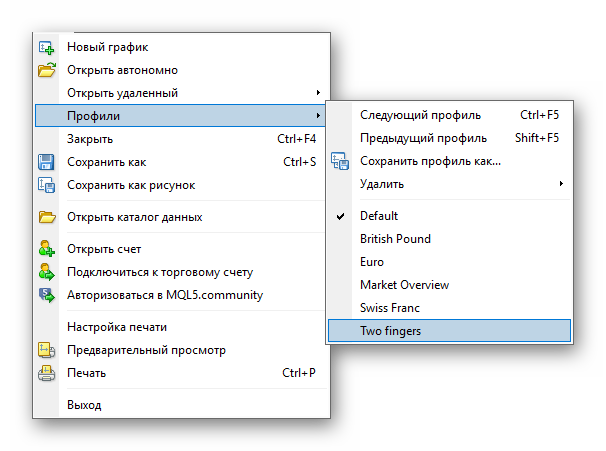
 After that, in the terminal open the strategy profile via “File” - “Profiles” - “Two fingers”.
 If everything is done correctly, you will be able to switch easily between the templates by selecting the D1 timeframe.
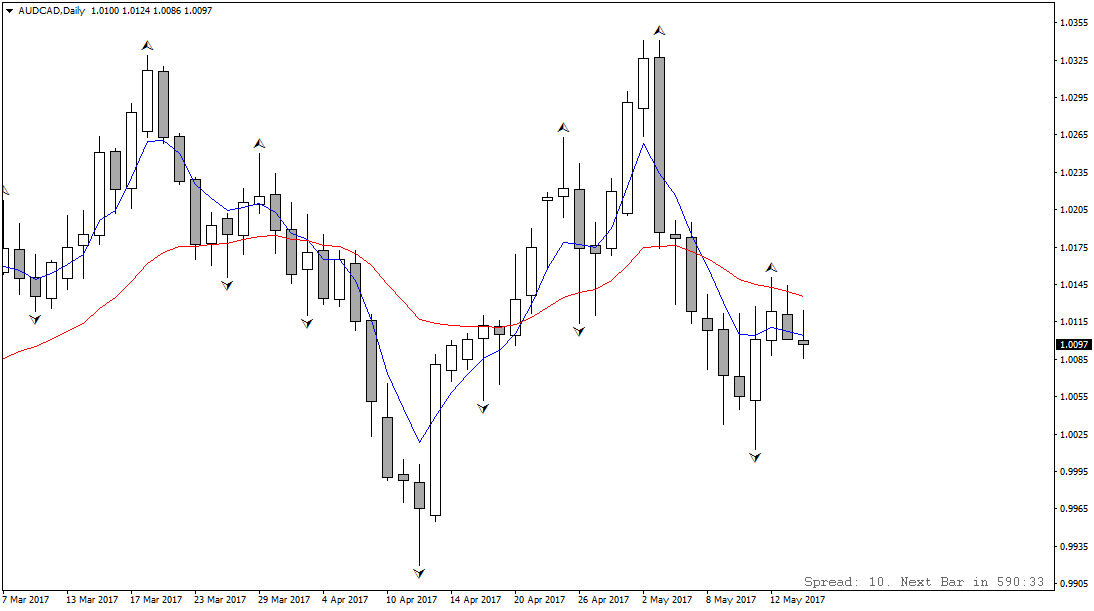 ...or H4.
Strategy Idea
First of all, I would like to express my gratitude to the member of our forum with the nickname Brom for sharing this strategy. The strategy is nothing more than a modification of the method by which Eduard Singatullin (one of Alpari's analysts) makes market reviews.
The idea of the strategy is as follows. We find a prolonged trend on daily charts, which often continues for many days or even weeks and, like any other trend, it has pullbacks. We try to enter on those very pullbacks (or corrections) so that, first, we have room left for the price to move and, second, there is justification that the price movement will continue in the direction of the trend. To make the entry more precise, we switch to a lower timeframe (when we are looking for an entry point).
Entry Rules
So, the first thing we need to do is determine the trend on D1. It is determined using moving averages. We will use moving averages with periods 22 and 5. If the 22 moving average is above the 5, the trend is downward. Conversely, if the 5 is above the 22 moving average, the trend is upward.
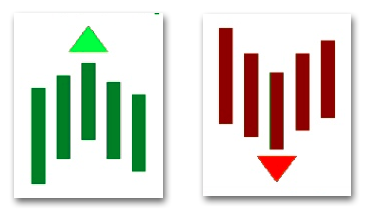
Having determined the trend, we wait for a fractal to form. A classic Bill Williams fractal consists of 5 candles, with a peak in the middle. We wait for such a structure to form against the trend. That is, if the current trend is downward, then we wait for a lower fractal to form. Conversely, if the trend is upward, we wait for an upper fractal to form.
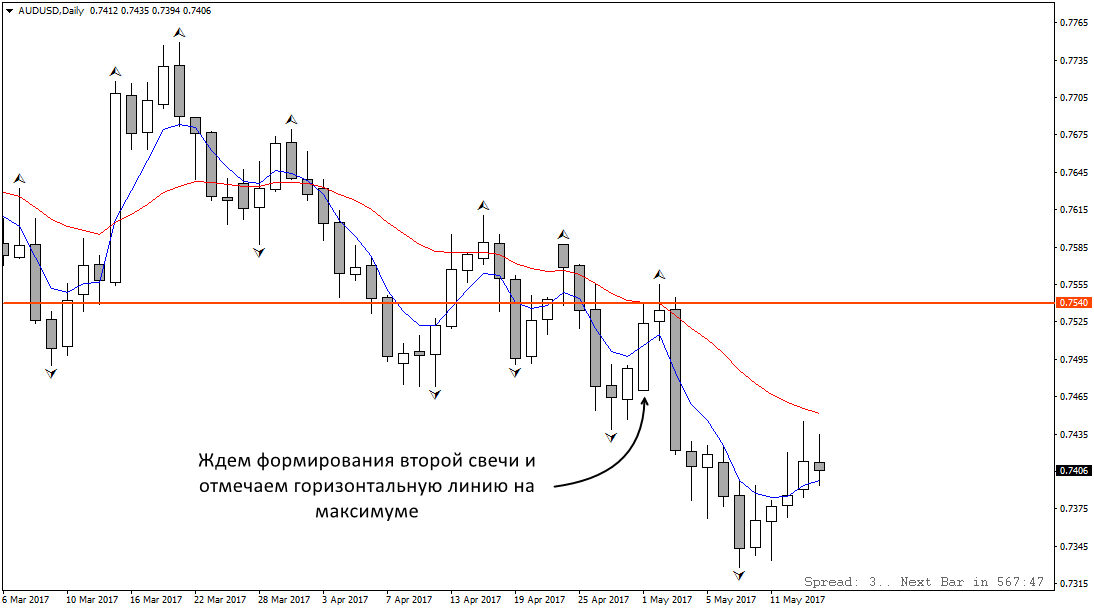
 After the second candle following the fractal has finished forming, we draw a horizontal line at its high (if these are sells), after which we switch to the H4 chart.
 On the H4 chart, we wait for the OsMA indicator to break the zero level. At the same time, the price at the moment of the breakout must be below our horizontal line. This is needed so that we can be sure that the trend has not changed and our forecast is still valid. If the price had been higher, we would have simply skipped the signal.
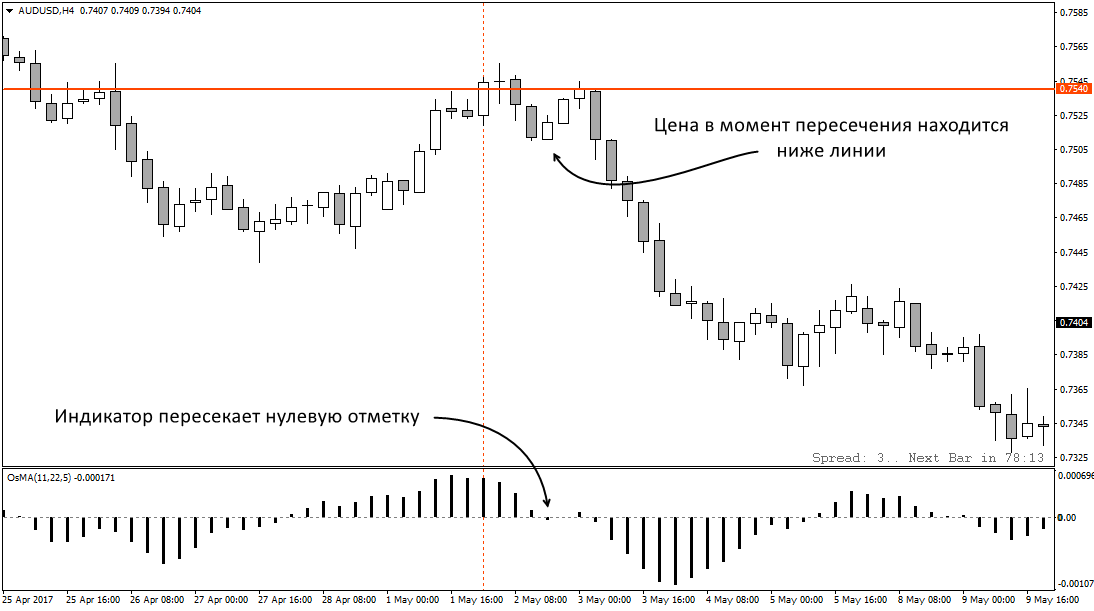 At this point we can enter the market. But, since we remember that entering at market is not entirely reasonable, we will place pending orders. In this case, we will place a Sell Stop below the low of the signal candle. When we place a pending order, we lose nothing if the price suddenly reverses.
Stop Loss and Take Profit
Naturally, we do not forget to set stop loss and take profit. There can be a lot of options here. A good solution would be to place the stop behind a local extremum on the H4 chart, or behind the high of the fifth (signal) candle on D1. If you trade more long-term, then place stops on D1. In general, wherever the stop looks more reliable and reasonable, that is where it should be placed.
You can exit the position on a reverse OsMA crossing. As an option, when a certain amount of profit is reached, you can move the stop loss to break-even and wait for a reverse crossing of the moving averages on D1.
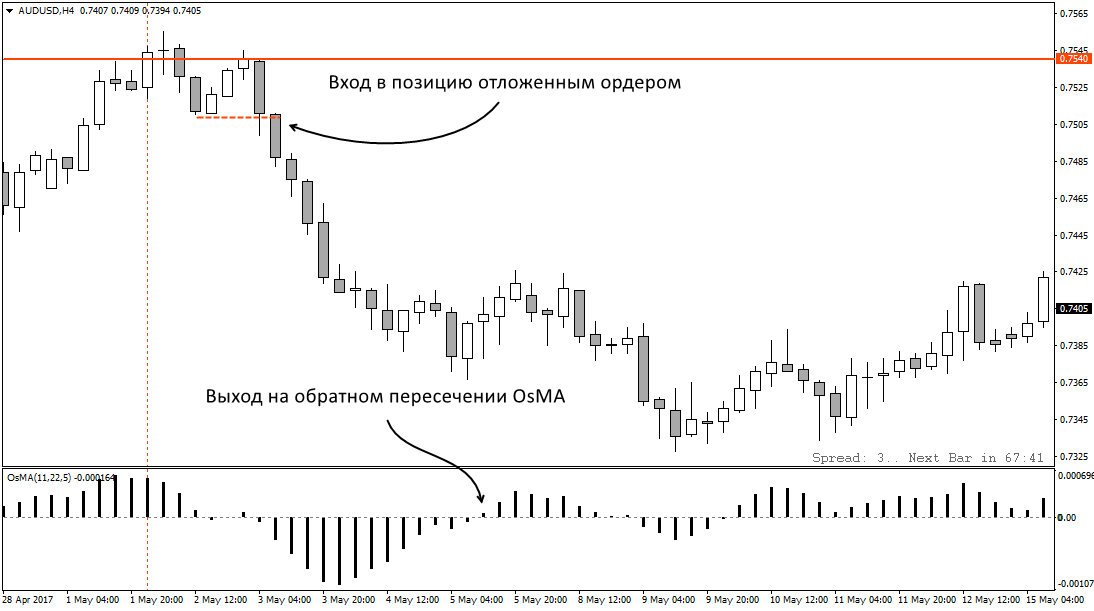 Also, to determine the exit point, you can use graphical analysis and draw channels (as the author of the strategy does), stretch a Fibo grid on the daily chart, or use key levels.
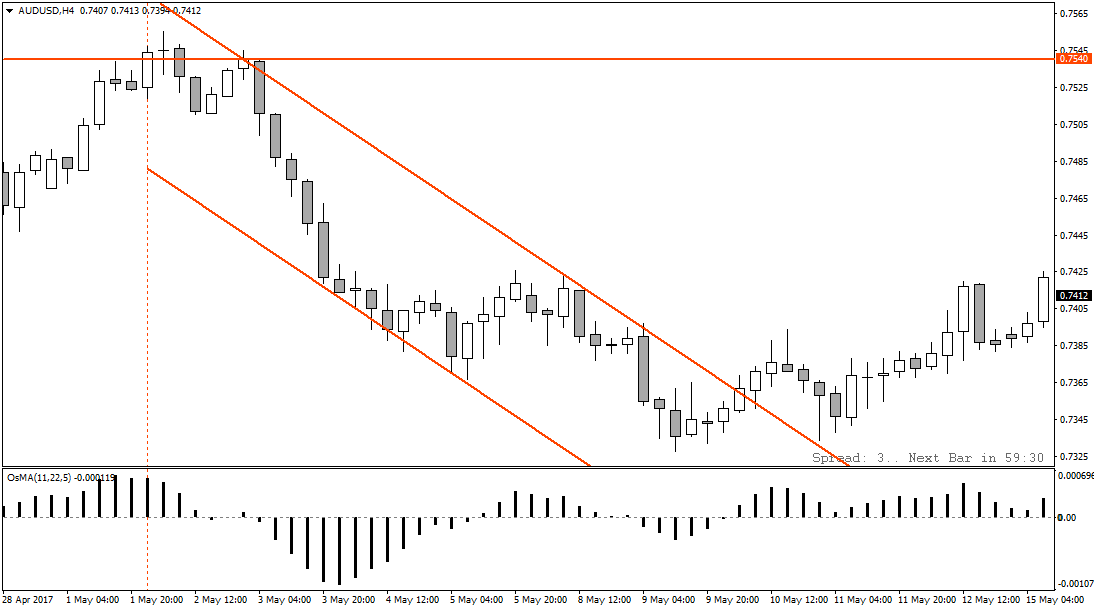 Among the additional options that can be used are adding to positions on new breakouts. But this tactic, again, is designed for a longer trade duration, when a position is held for many days. At the same time, the potential strategy signal remains valid for about 1 to 3 days (according to the system author's observations).
Auxiliary Expert Advisor

Given that there are many currency pairs and the eyes get tired from prolonged analysis, an auxiliary expert advisor was written that gives signals about potential entries. The signal on the chart is accompanied by a sound alert. Here, for example, we received a signal on the GBPNZD pair.
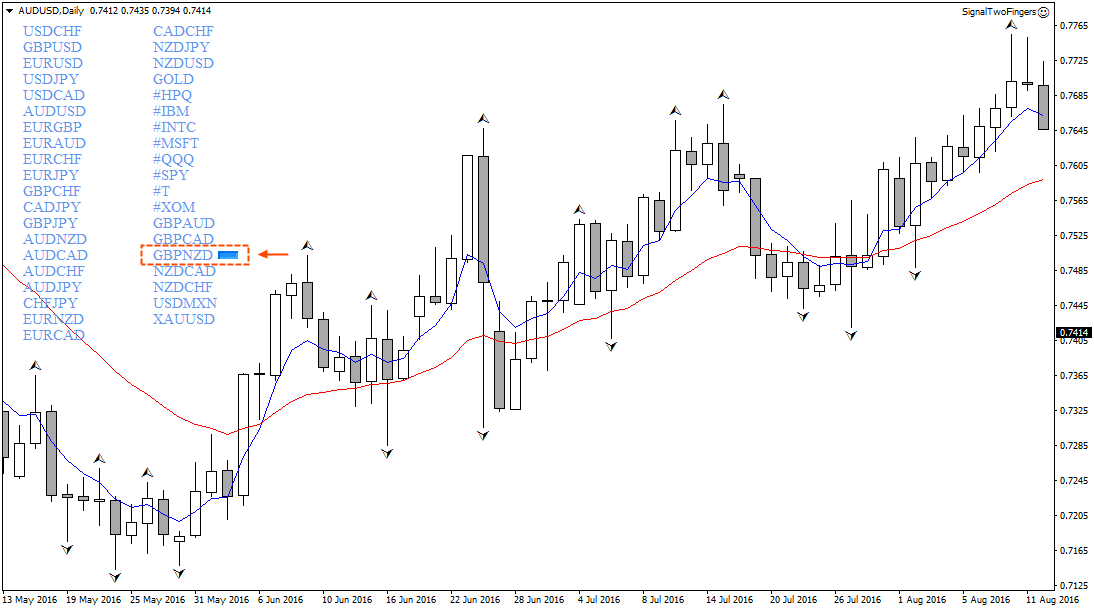 Given the obvious uptrend, we will enter with a buy. We set a line at the low of the second candle after the fractal and move to the H4 chart.
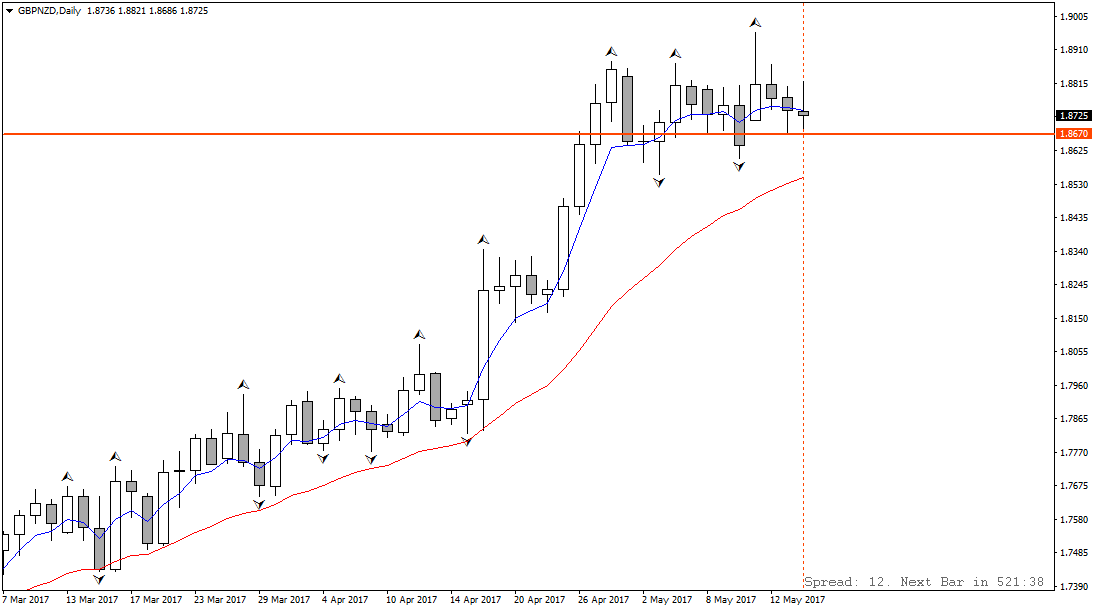 Here we wait for OsMA to cross the zero mark and place a Buy Stop order slightly above the candle on which the crossing occurred. In this specific case, this rule could have been neglected, given the long wick of the signal candle, and the order could have been placed closer to the price. We set the stop loss slightly below the horizontal line, which corresponds to the nearest local low.
Conclusion
The system is simple, practical, and caused a storm of interest on our forum, although it appeared only recently. It will be especially suitable for those who do not have much free time, which is helped by the fairly large timeframes, H4 and D1.
When trading, do not forget about money management; calculate the risks. Given the daily charts and large stops, it is not worth risking more than 1% of the deposit in a trade. You can calculate the lot size using the lot calculator on our website. Also, be sure to read the forum thread, where the author explains unclear points. In addition, an expert advisor for this trading system is now being actively developed.
Download the Two Fingers Strategy Files

Respectfully, Pavel Vlasov TradeLikeaPro.ru
