
Standard Deviation: What a Trader Needs to Know

Standard Deviation (SD) is part of the standard package of indicators in Metatrader and other widespread trading platforms. The tool shows the measure of deviation of the current quote from the average value over a period specified by the user. The best-known use of SD for traders is the deviation coefficient of the upper and lower Bollinger Band line. The Standard Deviation indicator is the hero of today's review.
Indicator Characteristics
Platform: Any
Currency pairs: any
Timeframe: any
Trading time: around the clock
Recommended brokers: Alpari, RoboForex, NPBFX
Description of How the Indicator Works

Standard Deviation translates as standard deviation, a mathematical term describing the measure of dispersion (variance) of the values of a random variable. The SD indicator is based on the formula:
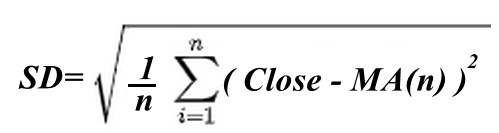
It is completely identical to the calculation of the standard deviation defined relative to period n as the squared difference between the current Close price of the candle and the value of the simple moving average of the selected n-period, divided by the number of candles in this interval. In the standard settings it is equal to 20.
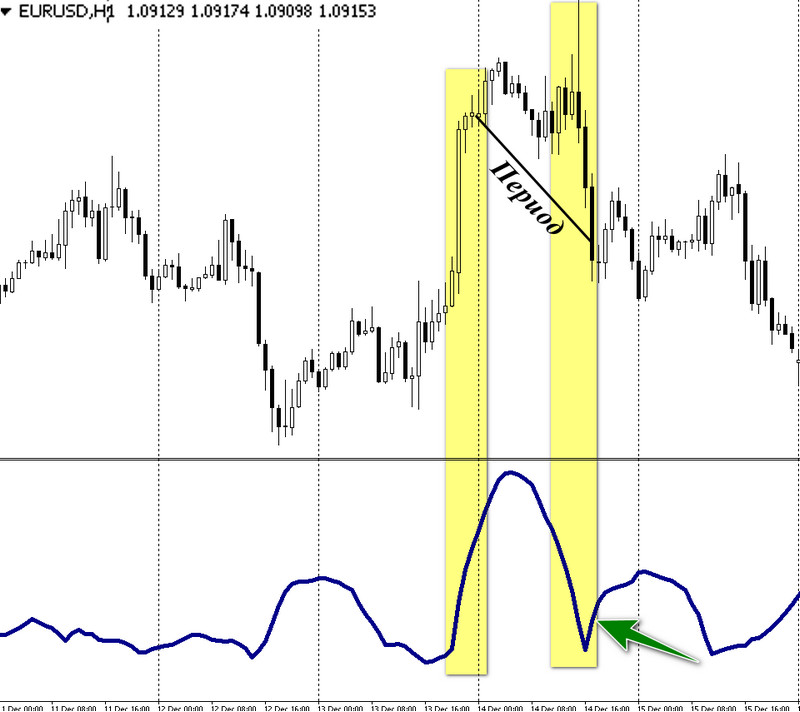
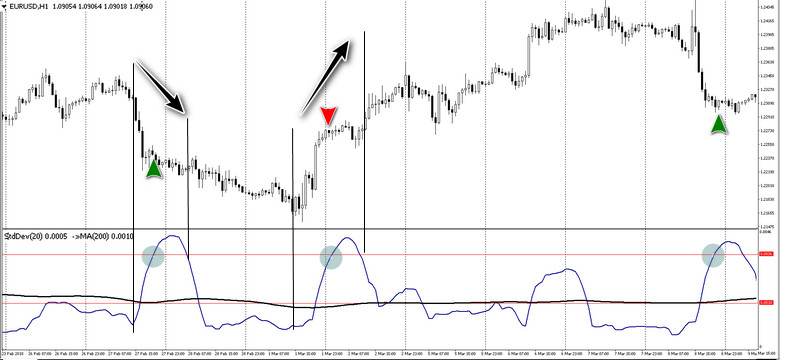
In essence, the indicator curve is nothing more than trading volatility. The curve is in no way connected with the directions of trends on the chart. It rises as a strong movement develops in either direction and falls when the candle range decreases, but with a lag that is associated with the "illness" of the average line.
Pay attention to the two areas of the EURUSD quote chart marked with a marker. The strong growth of the euro at the end of the day led to abnormally high Standard Deviation values. The next day, the correction "killed" the upward movement with a strong falling trend.
However, volatility showed a decline because the moving average contained a significant segment of data from the previous day. The previous range of candle changes was much higher than the current one, and the SD curve began to rise as soon as the candles of the new session entered period 20.
Using the Indicator in Trading

The Standard Deviation indicator is practically not used by modern traders separately or as part of trading systems because its formula is implemented more visually in Bollinger Bands. As already shown above, the SD curve is not synchronized with quote trends; it is a numerical measure of volatility. Unlike it, Bollinger Bands conveniently display the critical boundaries of price deviations directly on the chart.
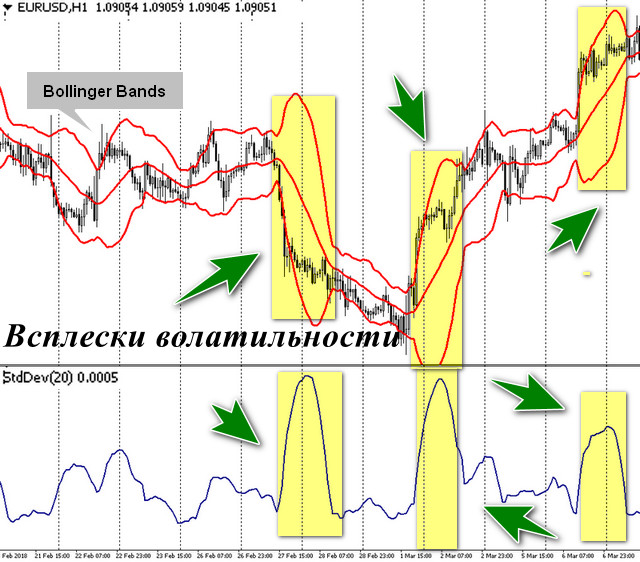
Traders who prefer to receive pure volatility signals from the Standard Deviation indicator use them to confirm a countertrend entry and to detect early trend reversals intraday.
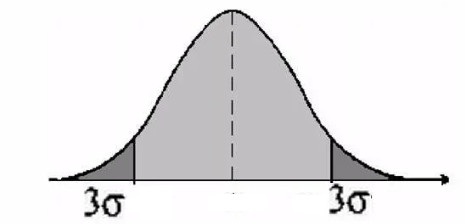
Trades against the trend are determined by the "three sigma" rule, a postulate of probability theory. It states that 99.73% of the values of a random, normally distributed variable will not exceed a threefold deviation from the average values of the selected set (interval).
To find an entry point into a countertrend trade, the average volatility value is determined by applying a long-period moving average with a period of 200 to the Standard Deviation chart. Its value is multiplied by 2, a coefficient calculated by J. Bollinger when creating the indicator. As soon as the SD line exceeds the double average value, the trader opens:
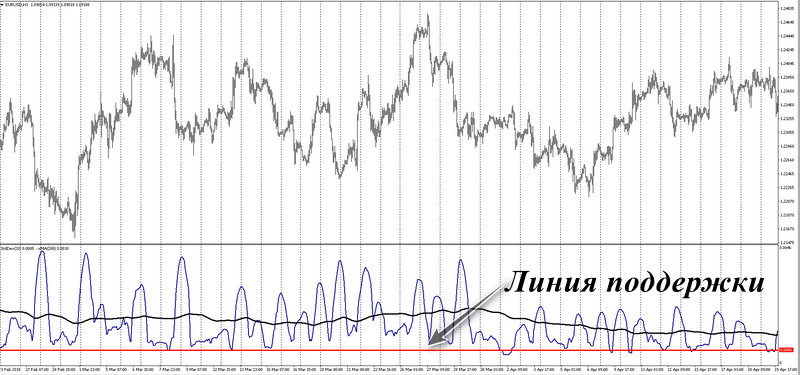
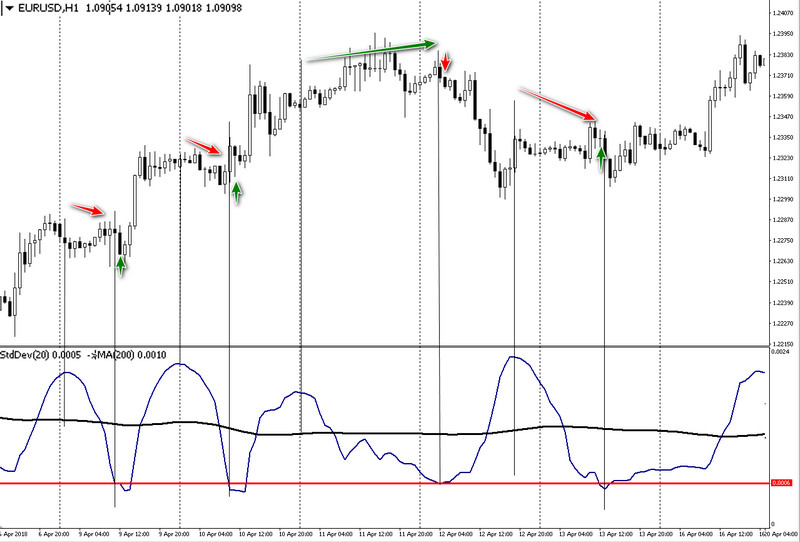
The strategy for detecting an early trend reversal is based on the assumption that a sharp drop in volatility to minimum values often coincides with a change in sentiment among large players. They are determined according to the construction rule of the support line, so that as many historical extreme values as possible fall on the drawn line.
As soon as the Standard Deviation curve falls below the level of minimum values, the trader:
Money management of the two presented trading tactics is determined by other indicators required to implement a full-fledged trading system. It is important to note that in the case of countertrend trades the trader should hold the position for a short time. If early trend detection is chosen, the position is held longer, but the stop-loss is moved to breakeven at the first opportunity.
Standard Deviation Settings

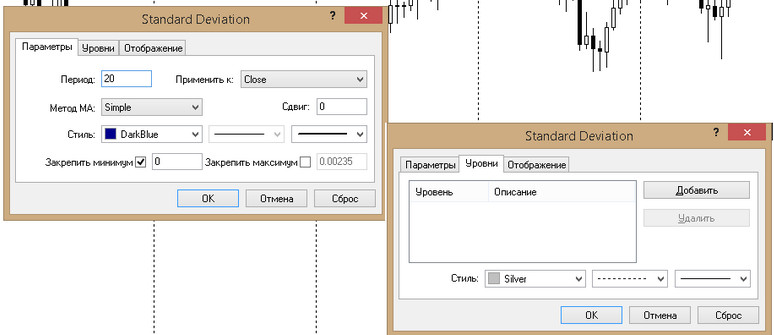
The indicator settings window contains one parameter that affects SD readings, the period. The trader must choose the number of candles over which volatility will be calculated. The default value of 20 is suitable for the H1 or D1 timeframe; when choosing other options, it is necessary to carry out testing.
The "Levels" tab can be used to fix average and minimum volatility values on the chart, so that it is convenient to implement the signals of the two SD application methods described above.
Conclusion

The Standard Deviation indicator shows how efficiently and simply probability theory methods can be used in the Forex market. If you use the examples given in the article, you can discover the advantages of identifying overbought and oversold zones over oscillator formulas.
Comparing trends with volatility cycles will help determine trend reversal points more accurately, which cannot be caught using the readings of the Bollinger Bands indicator. This is another argument for keeping the indicator in modern trading systems.
Best regards, Alexey Vergunov
Tlap.io
