
Session Volume Model - Liquidity Loading and Distribution
Before opening a trade, traders usually look for a trading model on the chart.
If we talk about technical models, they look for reversal or trend continuation formations. If we talk about candlestick patterns, then engulfing, fortress, crosses, and so on immediately come to mind. In the same row are price action patterns, for example, different base-drop variants.
All these patterns work, and all of them have an objective basis - previously loaded liquidity. This is a necessary condition in any market.
In this article, we will examine the main types of volume models and their place in the market auction. Knowledge of these models will significantly improve, if not trading itself (without capital management, nothing will help you earn consistently), then the understanding of the market as a whole.
The concept of a volume model and its place in the market auction
A session volume model is a pattern of liquidity loading and subsequent movement within the current auction. How should this be understood?
To begin with, let me remind you that trading on the exchange is organized according to the double auction principle, within which price moves from the cheapest sale to the most expensive purchase and vice versa. In other words, the bottom of the market is the place where sellers run out, and the top of the market is the place where buyers run out. Everything is simple and clear.
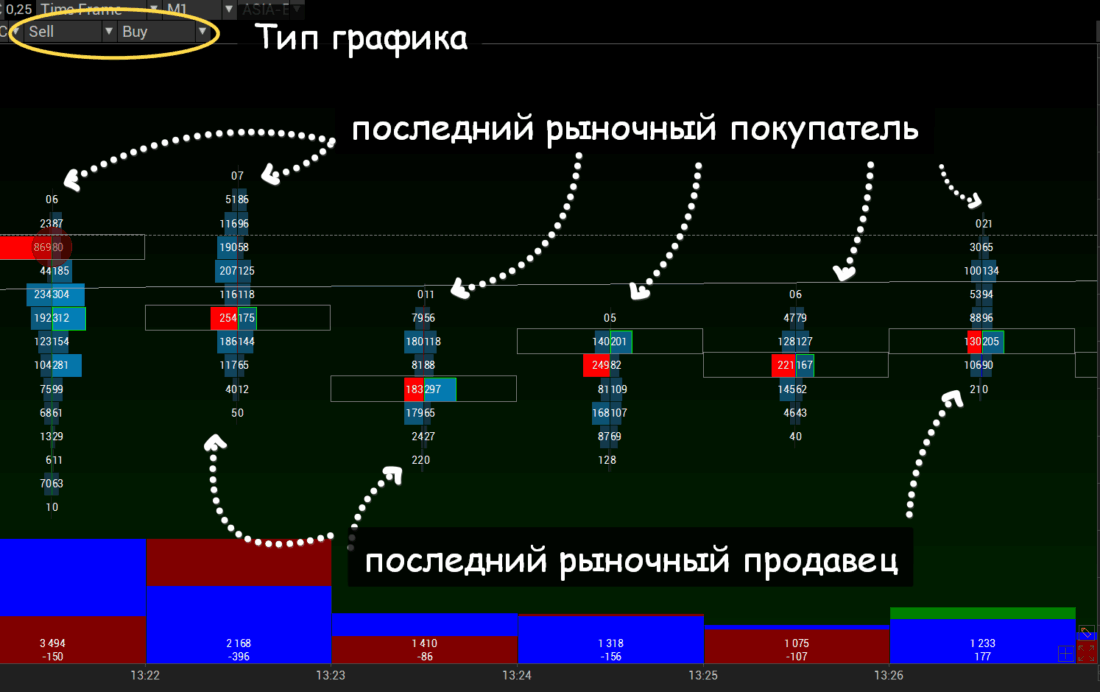
Within the double auction, it must be understood that balance (consolidation, flat) is a place where both buyers and sellers are comfortable trading: their forces are generally balanced, and the boundaries are clear.
The point of control (POC) and, a little more broadly, the core, is the place of greatest equilibrium, where trading opportunities are the least interesting within the current timeframe. At the same time, this place serves as that very still pool where whales and sharks dwell. In short, smart money. Here it is easiest for them to quietly build a large position over a certain period of time, which will later produce distribution in the direction that interests them.
In turn, imbalance (distribution, trend, impulse) is the place and time when one of the sides (sellers or buyers) effectively leaves the market. For example, during a buy impulse, there are not enough sellers' market orders to absorb all buyers' limits, while market buyers aggressively absorb all the sellers' limit activity, sweeping it away in their path.
After distribution, the excitement dies down, and a new auction (balance) begins in a new price zone, that is, equilibrium sets in.
Based on this, session volume models are types of liquidity accumulation and distribution. In the simplest case, it is enough to see and understand them, as well as how and when they can be traded.
A more professional approach implies taking placed horizontal volumes into account in the form of specific numbers.
For example, here is the hourly BTC-USDT chart on the Bybit exchange.
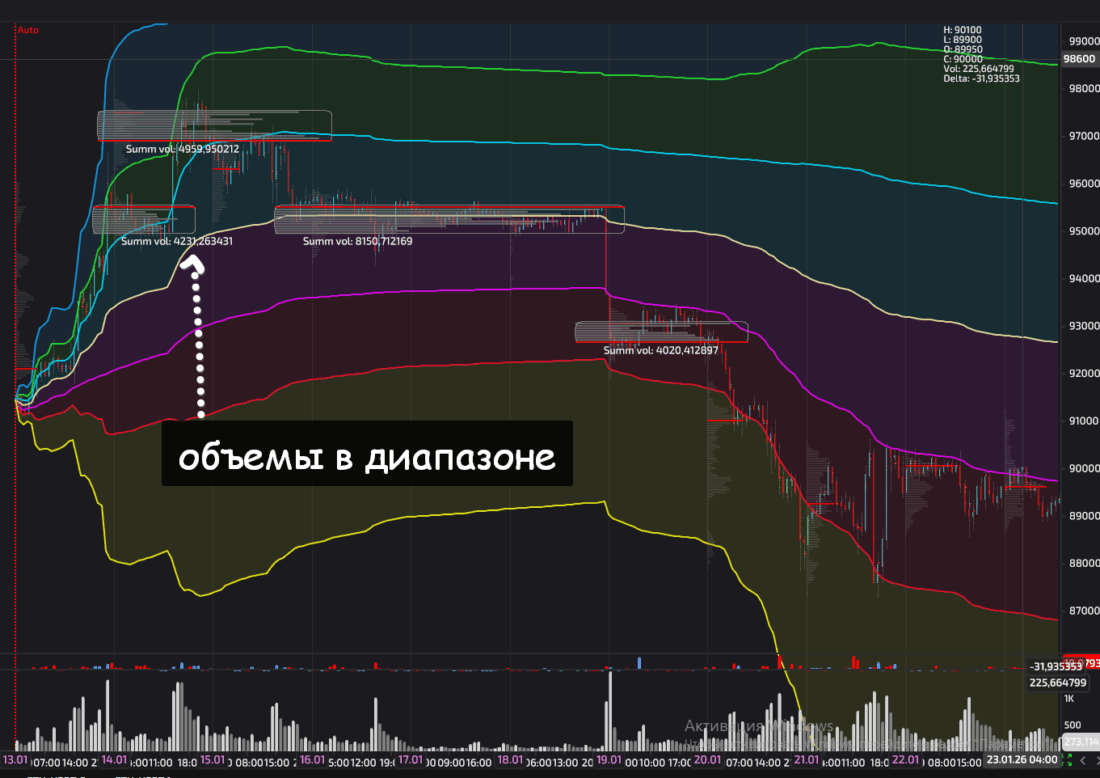
Here you can see that 4000-5000 coins, quickly rotated in a range of about 0.5 dollars, over 10-15 hours give a distribution of 2.5-3 dollars at least at the end of the impulse cycle. These same volumes, accumulated within an impulse, give a passage range one and a half to two times larger.
In turn, 7-10 thousand coins, rotated in the same 0.5-dollar range over 60-90 hours, give an impulse with a range 2-3 times larger than in the previous example.
Thus, the more horizontal volume is accumulated in a comparable range, the longer the passage. The relationship is quite linear. But we will talk about this in more detail in another piece.
It should be understood that the accumulation of certain volumes is not a guarantee of transition into an impulse. It must also be remembered that the parameters change from time to time: if today certain horizontal volume figures are enough, then at another time other values will be needed for a similar movement.
As we have already understood, a volume model is inseparably linked with time. This means it should be sought within a certain time interval and always with hourly, daily, weekly, monthly, and so on rhythms in mind.
If we talk about volume models within a week, then it is better to call them a weekly auction. And if we are talking about a daily or session auction (European / American session), then it is more convenient to simply say "session." By the way, RTH (regular trading hours) is exactly the working session time on American exchanges.
The type of the session volume model is inseparably linked with a very important statistical parameter - the probabilistic passage range. Impulse sessions most often have a larger passage range on average, while balance sessions always have a smaller one.
How do you calculate the range of a session or any other auction?
It can be estimated roughly with ATR (Average True Range), which is included among the standard indicators in most terminals. But it is better to use a statistical method, which includes:
- Manual or automatic collection of range values over a certain period.
- Calculation of statistical values: median (splitting the sample in half), quartile (quarters of the sample values), lower and upper deciles (10% of values), maximum and minimum.
- Analysis of distributions and the search for patterns.
Here is an example of collecting statistics on the YM instrument (DJ30 index futures). Period: from September 1 to December 3, 2025 (68 sessions). Session: RTH (8:30–15:15 CT).
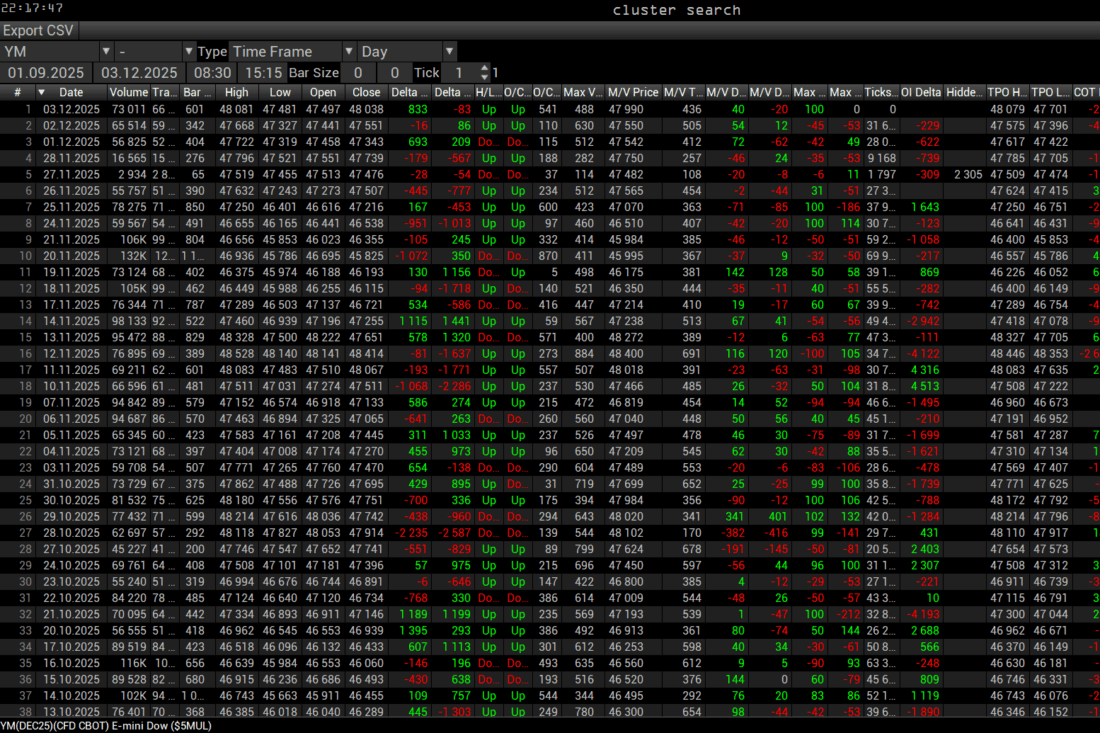
Range analysis. Minimum is 65 ticks, maximum is 1230, median is 421, lower quartile is 330, upper quartile is 573, lower decile is 265, upper decile is 787. 50% of sessions are 330-573 ticks, 90% of sessions are 265-787 ticks.
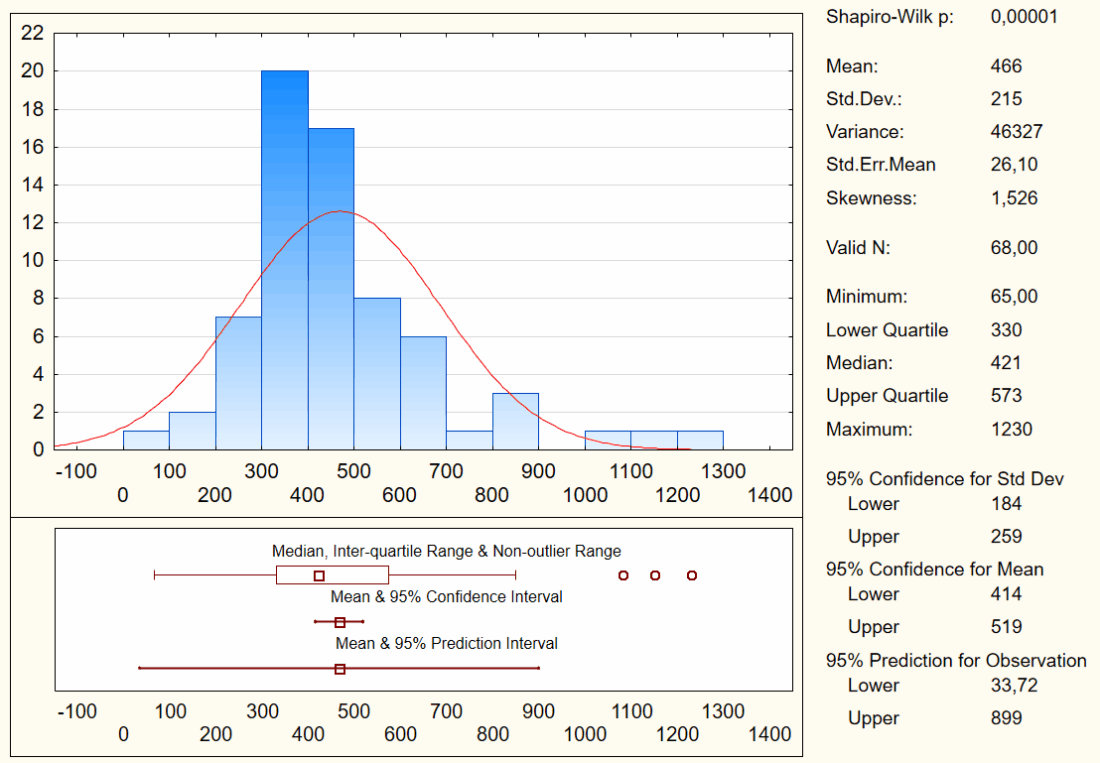
Deeper analysis implies searching for dependencies of the session range on the initial balance range, initial balance volume, initial balance POC volume, and even on the average volume per tick of the initial balance.
Regression analysis of these parameters makes it possible to obtain fairly accurate forecasts of the expected session range, on some instruments sometimes even tick for tick.
In addition, the range potential and the session type depend on what phase the market is in on the higher TF and where the quote is located at the moment. For example, if within the week the quote is near the upper boundary of the balance, there is a high probability of seeing a reversal session.
It is also worth taking into account the overall values of the day and week ranges. For example, if during the European session the quote has covered the standard range of the entire day, then there is a high probability of seeing a reversal session or a balance session in America. Of course, the impulse may also continue, but here too the higher timeframe must be analyzed.
We will talk about this in more detail another time.
Let us return to the models.
In fact, the definition can be expanded: a volume model is a certain set of liquidity for distribution over a certain period of time. Within an hour, a balance of a certain volume in a certain range can be distributed to the buy side. At the same time, within the framework of the session auction, all of this is a balance that will then be distributed within the framework of the weekly auction.
Types of Session Volume Models
Session volume models can be divided into the following general types:
- impulse (several kinds)
- reversal (several kinds)
- balance (regular and volatile)
- normal directional (several kinds)
The division of some sessions is rather conditional. For example, a reversal session may be impulse-reversal, that is, in the first half of the session (say, from 8:30 to 10:30) the quote is in a buy impulse, and after a short balance from 11:30 it goes into reversal.
A good model is visible already in the first half hour to hour after the start of trading; this time is called the initial balance (initial balance). The development of more complex, though sometimes no less interesting, models is shifted in time: the start of the dynamics is either moved one or two hours away from the initial balance, or postponed until after noon.
By the way, within a monthly auction there are usually no more than 3-4 good impulse sessions with a large movement range. Of course, when the quote is in an impulse on the higher timeframe, the number of impulses also grows (the gold chart in the second half of 2025 and the first half of 2026 is clear evidence of this).
Also, on volatile instruments (such as gas NG or ether ETH), impulse or impulse-reversal sessions can be seen a little more often.
In the following articles, we will examine in detail all the main types and subtypes of sessions, while here we will only outline their appearance in general terms.
What an impulse looks like, we discussed in other materials. All the characteristics of an impulse are described there. Let me remind you of the key points: 2-3 flat sets, 3-5 expansions, movement below/above VWAP.
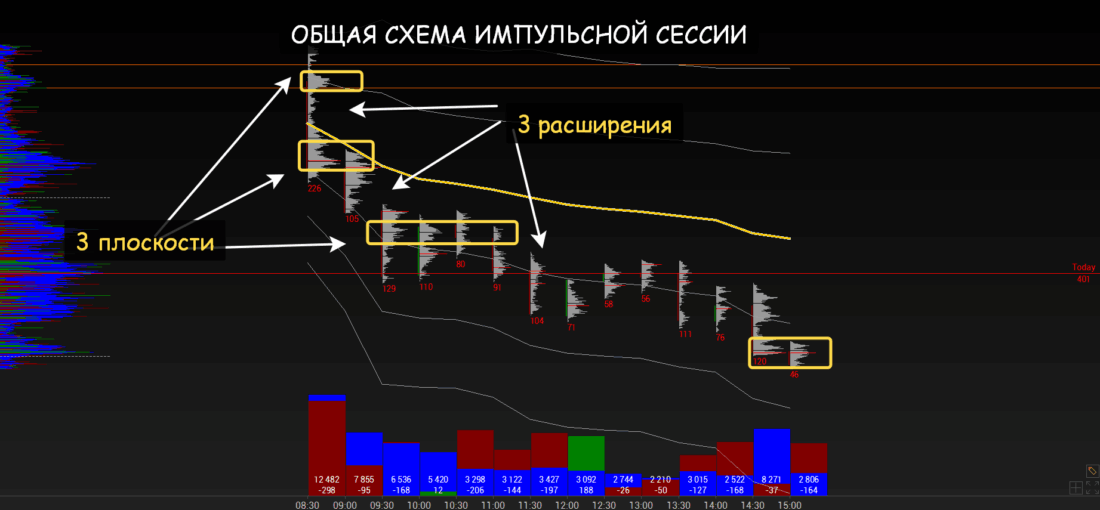
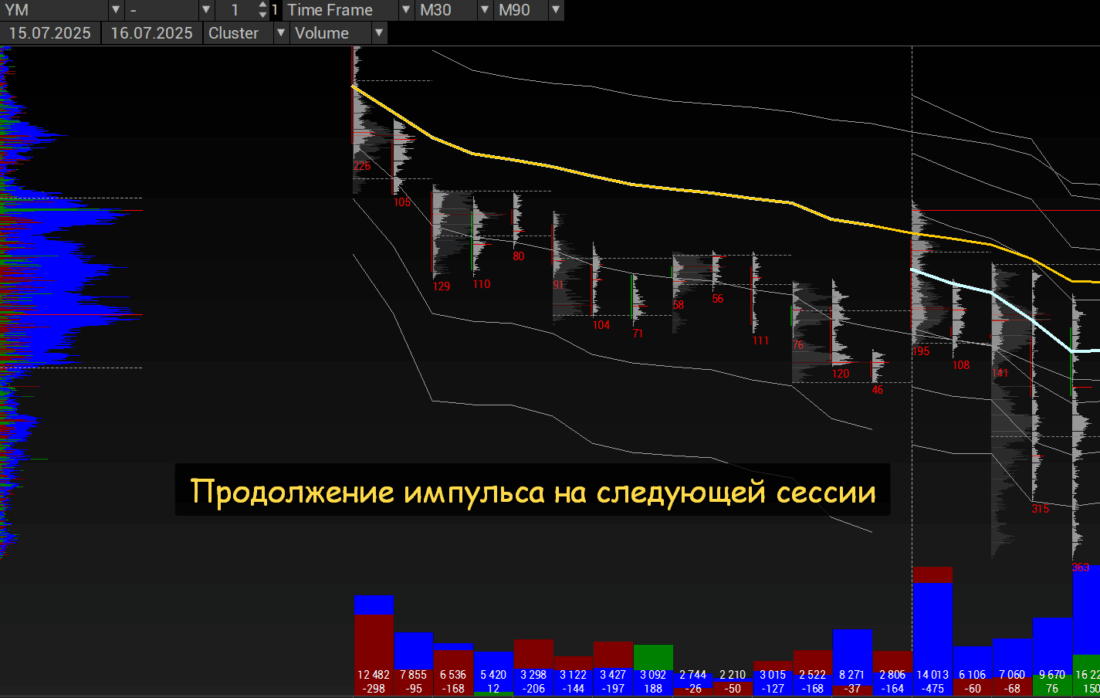
Quite often, an impulse continues in the next session or over the course of several following sessions.
A reversal session is characterized by one direction in the initial balance or in the first half of the session and full trading in the opposite direction at least back to the starting point, or with a transition into a full-fledged impulse in the opposite direction.
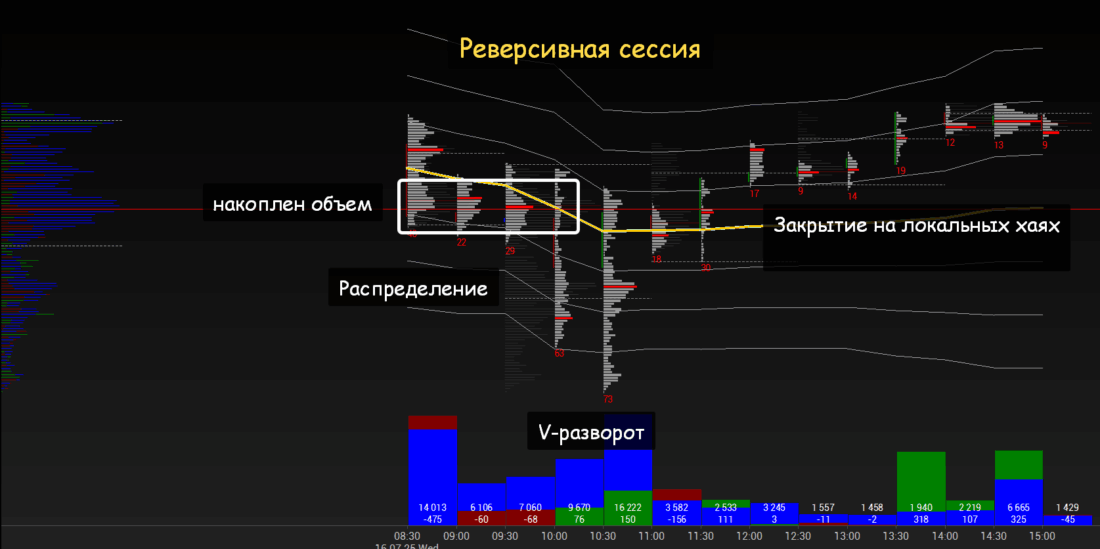
One of the variants looks as follows: there is some liquidity loading, often taking the form of loading as part of preparation for an impulse. After the loading, we see an expansion in one direction with a sharp reversal in the opposite direction and with the session closing at the starting point or beyond it (the farther, the better).
The reversal time is most often from 9:30 to 10:30. But there are sessions where the reversal occurs as early as around 8:45.
By the way, there is a separate article on the V-shaped reversal about what the reversal itself looks like from the point of view of volume structure.
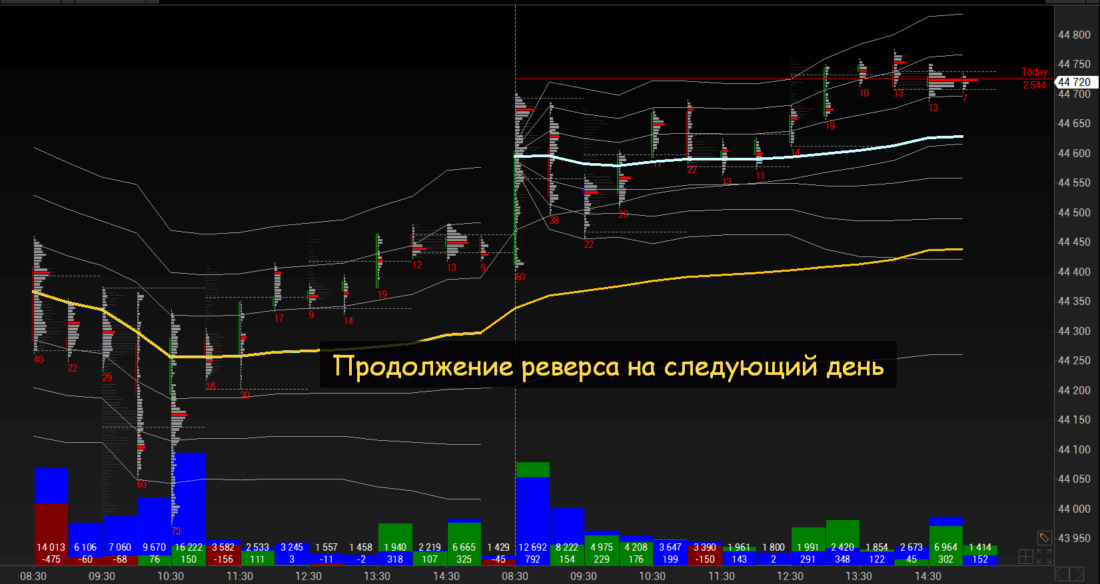
A true reversal session continues the next day either in the form of an impulse or in the form of a normal distribution, as in this case.
A normal session looks as follows. There may be some distribution in the initial balance. In our example, the first distribution was in the direction of the main move, but this is not mandatory. More often, normal sessions find balance slightly above or below the opening point, after which the main distribution goes in the opposite direction from the initial move.
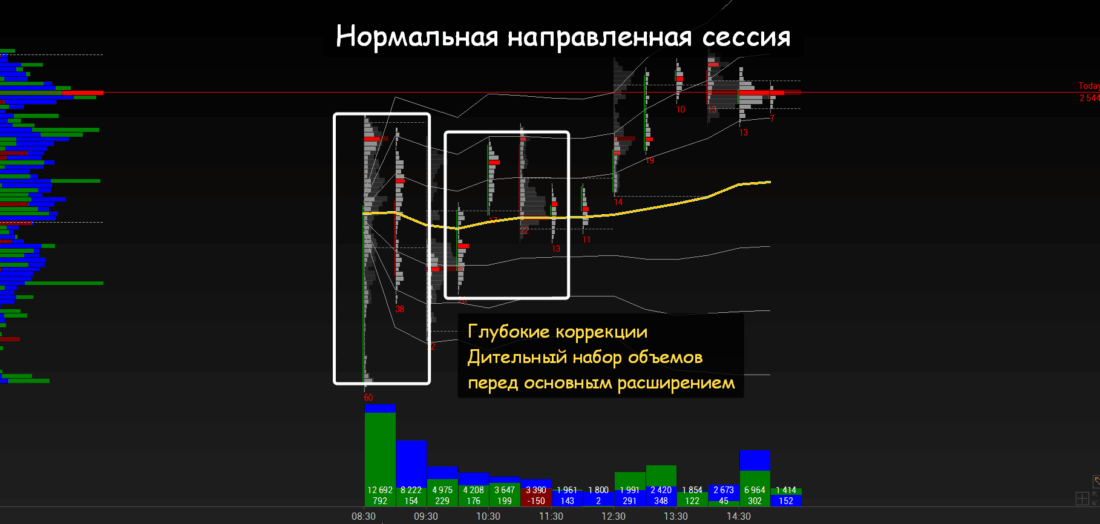
A normal session is characterized by deep pullbacks, prolonged accumulations, and short expansions. Such sessions are also characterized by long periods of volume loading before the main strike, which is shifted to the second half of the day or to the second part of the first half of the session (10:30-11:30).
By the way, on weekly auctions, swing traders are very fond of models of this type.
The last type of session is the balance session. As an example, I will show a balance session that could have become an impulse session, a reversal session, or even just a normal session, but did not. In such sessions, there is a sharp movement in one direction in the first half hour to hour (the initial balance), after which the quote "stops" and volatility drops sharply.
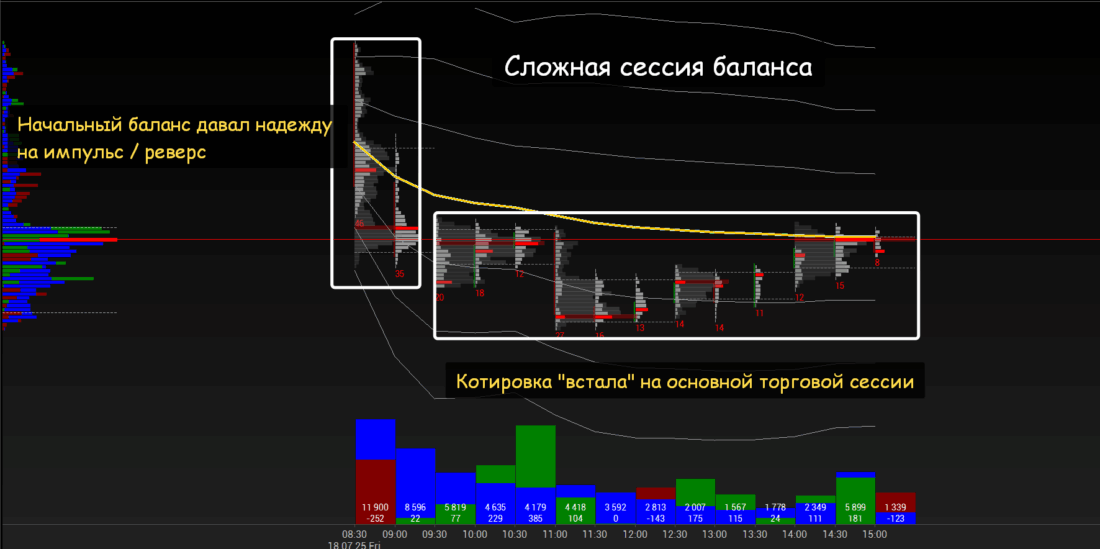
In ordinary sessions of this type, during the first hour there may be some volatility in both directions with gradual fading.
And this is what a regular balance auction looks like. As the attentive reader has guessed, all the examples above show sessions that follow one another. The picture below shows a weekly auction within which the sessions discussed above occurred in sequence. This is a classic balance, where the quote rotates around VWAP. The potential of trades is limited by the boundaries set in previous periods.
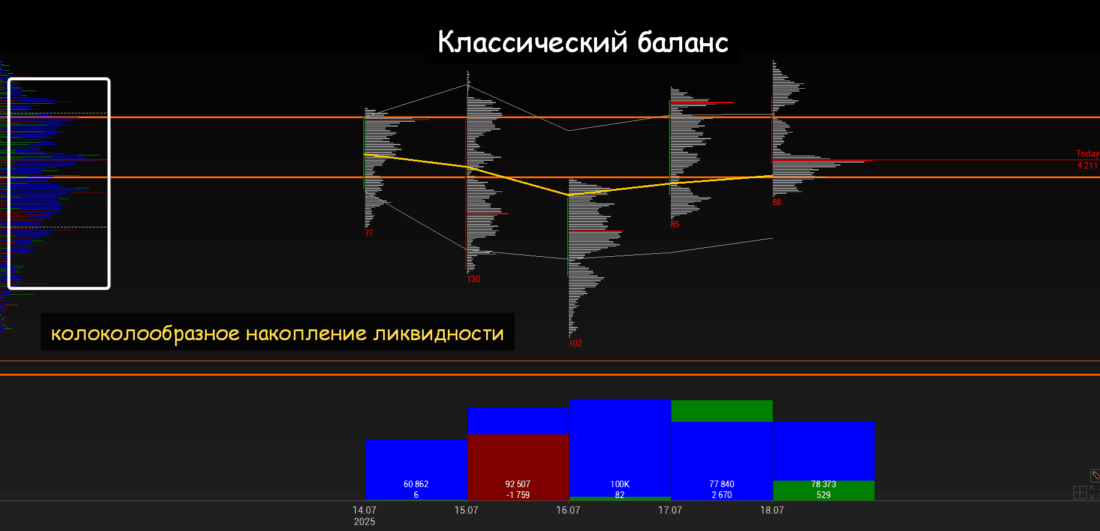
Within a daily session of this type, working from the boundaries is not very interesting, but within a weekly one, it is quite reasonable.
How to Determine the Session Type
To learn how to determine the probable type of the upcoming session, you need to take the following steps:
- Conduct a study: review at least the last 100 sessions to "train" your eyes.
- Carry out the calculations discussed above.
- Start trading and accumulate experience.
Conclusion
Understanding session types gives an understanding of the day's potential, and therefore a more or less correct assessment of the upcoming movement, including the probable range and the duration of holding the position.
In the following materials, we will examine session types in detail and how to work in them.