
Serpentine Fibonacci Sequence - Applying a Known Tool in New Market Realities

In many classic trading textbooks, the postulate about the invariability of market fluctuations is often mentioned, which allows us even today to apply strategies from the last century. Such a statement is valid for long-term and medium-term trading. At the day trading level, trends with pullbacks are increasingly being replaced by rapid impulses.
Life does not stand still: people change, technologies change, markets change. Traders, perhaps more than representatives of other professions, feel and notice these changes, and among the first. And for profitable trading in the financial markets, they must always be fully armed. Today in our material we will examine a variation on the well-known Fibonacci tool in the new realities of the market, and see what it can give to us, currency speculators.

The transformation of classic intraday movements has been taking place since the first day of the development of electronic trading. Each new decade of the XXI century brings a significant increase in data transfer speed and processor performance.
In the forex market there are becoming more and more scalpers, robots, VPS servers; orders are placed and canceled in milliseconds. Billions of dollars of liquidity move between the accounts of market participants in a matter of seconds.
Impulse surges in the quotes of currency pairs intraday are the result of such rapid liquidity flows and robot trading. To adapt to the new intraday paradigm, we have to rebuild the tools of technical analysis, using a neoclassical approach.
Fibonacci levels are our first attempt to adapt canonical theories, mathematically substantiated by the same principles as the search for the first correction lines.
Classical Fibonacci Theory in the Forex Market

At the first stage of learning trading, when building resistance and support lines, almost every one of us became acquainted with Fibonacci levels. This is one of the most popular topics on Forex: on our site alone you can find more than five articles and many mentions, it is enough to type the corresponding tag into a search engine.
Fibonacci levels were discovered by the creator of wave theory, financier Ralph Nelson Elliott, and used as constants of trend correction for detecting the bottom or top of waves. The found coefficients turned out to be universal for determining the continuation of a trend, channels, circles, clusters and even time zones.
The effectiveness of Fibonacci levels has been proven by time; they are available in the standard package of any trading platform. Analysts use this series of standard percentage values to build support and resistance levels, while theorists and practitioners of trading base strategies and trading systems on them.
Despite many application options (inversions, mirror projections, etc.), the same series of standard values has been used for decades:
This fact explained the use by the founder of wave theory of the results of dividing numbers in the form of relative percentage ratios to determine the bottom or tops of waves. Fibonacci levels can be considered a consequence of the theory of wave motion, proven by nature itself and mathematics. The peaks and troughs of waves make these levels resistances and supports in trend movements.

This fact explained the use by the founder of wave theory of the results of dividing numbers in the form of relative percentages to determine the bottom or top of waves. Fibonacci levels can be considered a consequence of the theory of wave motion, proven by nature itself and mathematics. The tops and bottoms of waves make these levels resistance and support in trend movements.
How to open a new Fibonacci level?

In the search for new values, let us turn to the Farey series, which revealed a sequence of positive irreducible fractions, where the denominator will always be equal to a number one greater than the number of the sequence:
With the sequence n=8, the denominator of a fraction will never exceed the digit 8, and so on. The theorem and the Farey sequence give many interesting mathematical properties; in particular, one of them is the presence of Fibonacci numbers in it.
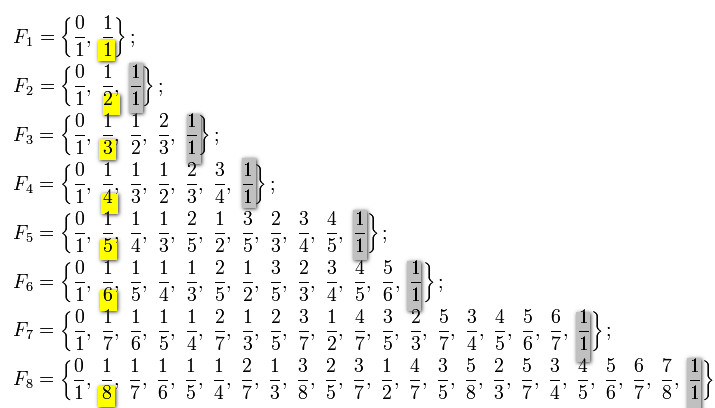
If we perform the mathematical operation of addition in the presented series in the picture above, we can reduce them to the following form:
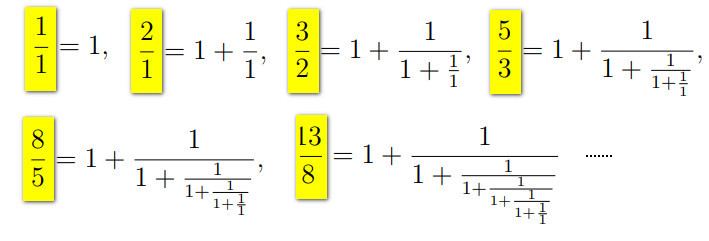
The result is a series of fractions of infinite length, where Fibonacci numbers are clearly traced:
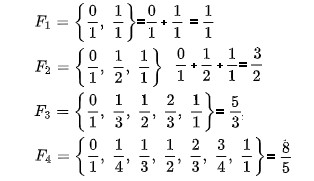
In mathematics, it received the name of the Fibonacci-Farey sequence. Its numbers can be written in another form:

Mathematician Alexander Veits transformed this series of fractions into a serpentine form of the Fibonacci sequence:
Cross-dividing the numerator of the previous fraction by the denominator of the following one, excluding the first term, gives the 0.145 level. In the second part of the descending serpentine sequence, by dividing the denominator of the previous fraction by the numerator of the next fraction after it, we get the 68 level.
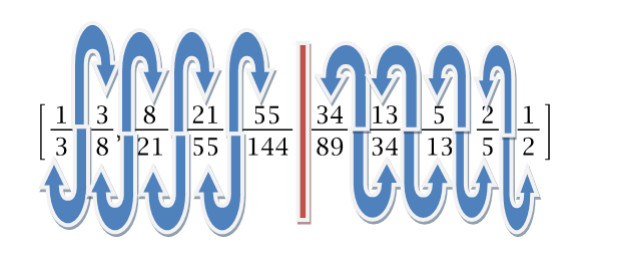
Cross-dividing the numerator of the previous fraction by the denominator of the next one, excluding the first term, gives a level of 0.145. In the second part of the descending serpentine sequence, dividing the denominator of the previous fraction by the numerator of the next fraction gives level 68.
Serpentine Fibonacci Sequence Levels in the Forex Market

The close location of the first line to the extremes is justified by the rapid development of currency trends, which do not have time to roll back to the old 23.6%, 38.2% and lower levels. In most cases, touching these lines occurs during a reversal or in a flat, forcing the trader to miss most of the directional movement.
The problem of remoteness from the maximum begins to manifest itself negatively during a prolonged trend. The figure below considers an example of a three-day growth of EURUSD quotes. On the hourly chart it can be seen that the old theory does not allow the trader to enter already at the third maximum update, and he misses the impulse on the third day.
One of the confirming signals of trend continuation is its transition from an intraday to a medium-term form, but it is precisely at this moment that the levels stop working. Considering the fact of using levels 61.8 and 68 for placing a stop-loss, it can be noted that the additional few percent in this case save the trader from unnecessary stops thanks to the use of a Forex trading strategy based on the serpentine Fibonacci sequence, but only intraday.
The problem of distance from the maximum begins to manifest itself in a negative way with a long trend. The figure below shows an example of a three-day growth in EURUSD quotes. The hourly chart shows that the old theory does not allow entrytraderalready on the third update of the maximum, and it misses momentum on the third day.
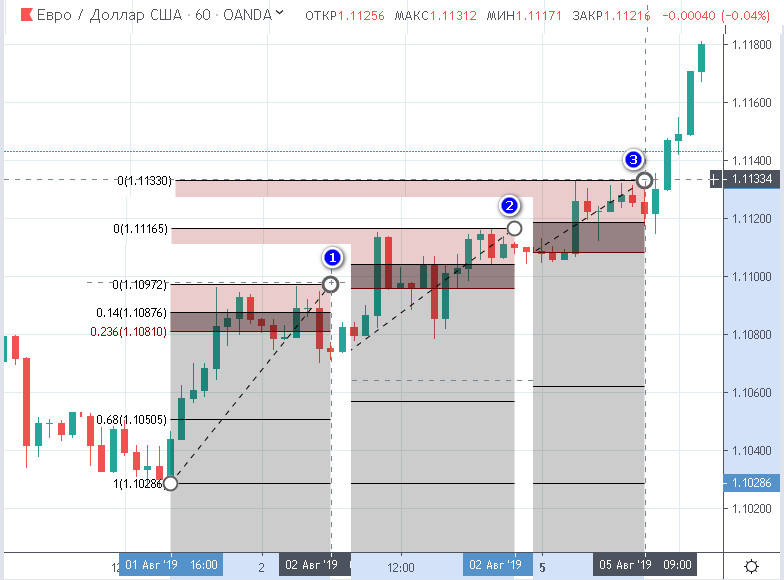
Fibonacci levels have the unique property of adjusting to market volatility, expanding or moving away from the current price as the fluctuation range increases. The intraday strategy based on the neoclassical lines of the serpentine sequence takes the start of the day as the reference point of the trend, skipping the first three candles.
Trading strategy for Fibonacci sequence levels in the Forex market

In 70% of cases, the Asian session or the European segment following it determines the overall trend, while the highest trading volatility occurs at the end of the day. This means that signals of a trend change - the knocking out of stops at the 68% level - will fall in the first half of the day with minimal expansion of the levels, and therefore of the loss as well.
At this time, the main Asian markets open, butvolatilityremains low on many pairs, which allows you to enter at minimal cost (feet).
Platform: MetaTrader 4
Currency pairs: any that do not contain AUD, NZD, JPY
Timeframe: H1
Trading time: 3-00 - 21-00 MSK
Recommended brokers: Alpari, RoboForex, AMarkets
Characteristics of the strategy
In the Metatrader trading platform, Fibonacci tools are given an entire section, which opens as follows: the "Insert" submenu, the "Lines" option.
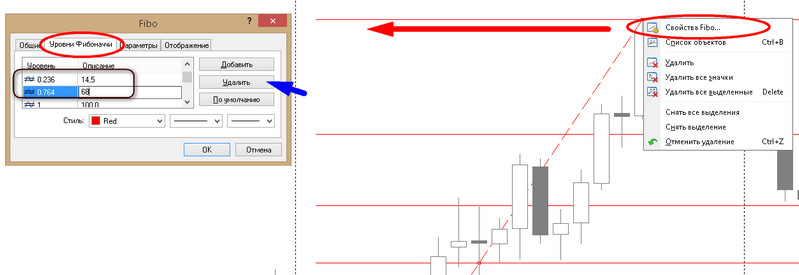
To change the standard values to the custom 14.5 and 68, you need to stretch the levels at any point on the chart, then click on them with the right mouse button. An additional menu will open for the trader, where the indicator settings window can be called through the "Fibo Properties" item of the indicator.
The tab with the corresponding name is responsible for displaying the levels; by clicking twice in the cells with the numbers, we change their values to 14.5 and 68, and remove the unnecessary ones with the "Delete" function (the numbers 23.6; 38.2; 50; 61.8; 76.4).
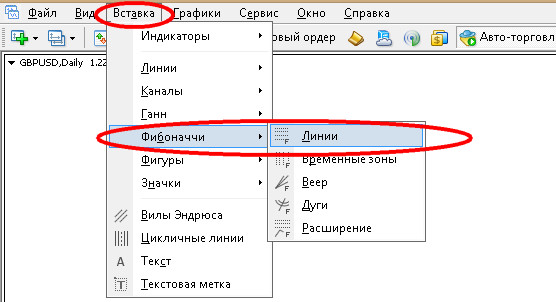
If everything is set correctly, the final appearance of the Fibo lines on the chart will change as shown in the figure below:
Trading Rules of the Strategy
After the third candle closes, at the 14.5 level we place a pending order of the following type:
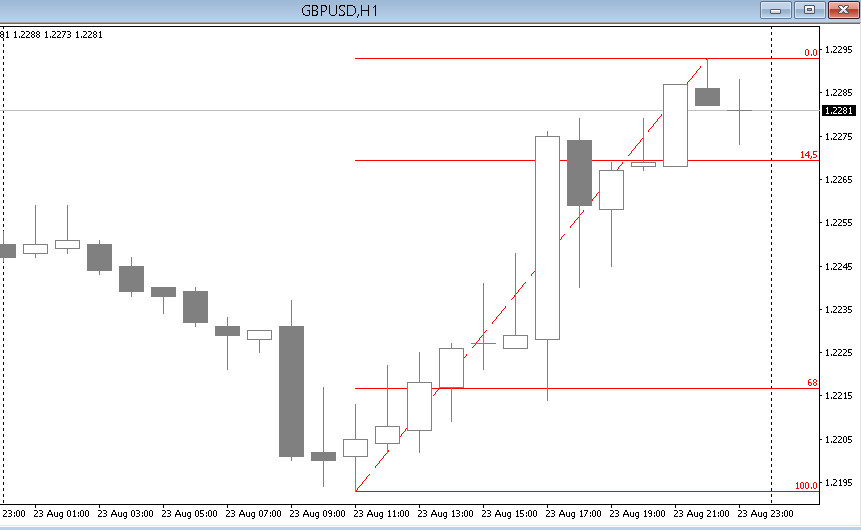
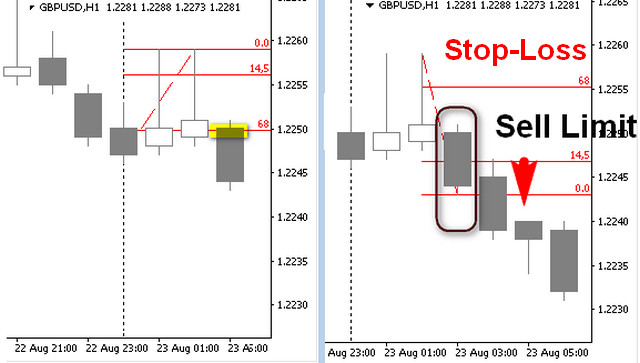
Stop-loss is added only after the trade is made, by the value of level 68. A change in trend direction occurs as soon as the candle touches this line with its tail or body.
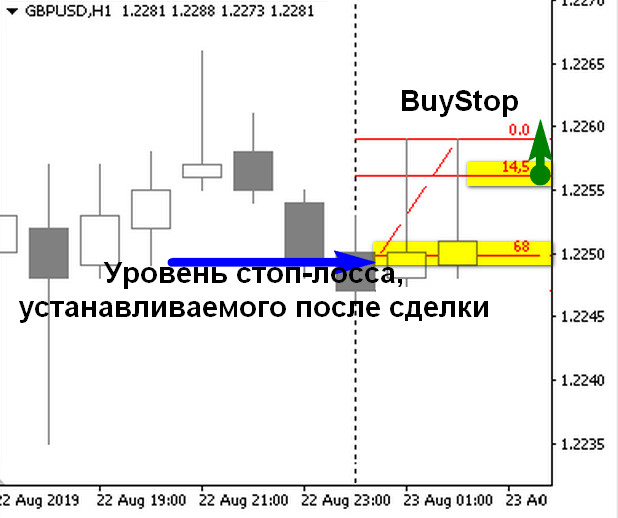
After the third candle closes at level 14.5, we place a pending order of the form:
The large mathematical introduction is connected with the need to substantiate the author's finding of level values based on the serpentine Fibonacci sequence. Our site was the first to publish material on this topic on the Internet.
Respectfully, Ivan Petrov
Tlap.io
Conclusion

The development of financial technologies and the Internet speeds up the process of making transactions on the Forex market, which changes the nature oftrends, forming a large number of impulse recoilless movements within the day. The levels presented in the article allow you to adapt to the new paradigm of intraday trading, taking into account the volatility and features of three trading sessions: Asian, European and American.
A large mathematical introduction is associated with the need to justify the author’s finding of level values based on the serpentine Fibonacci sequence. Our site is the first to publish material on this topic on the Internet.
Best regards, Ivan Petrov
Tlap.io
