
ROI and ROE in Simple Terms

When a trader first comes to the financial markets, they are overwhelmed by a flow of quotes, indicators, and other people’s “successful success stories.” But after several trades, a simple question inevitably arises: “How well am I really trading?”.
When answering this question, some assess profit by the amount earned, others look only at the percentage return, while others analyze the efficiency of capital use.
If you look impartially, a profit of 1000 dollars may be an excellent result for a deposit of 5000 and a failure for a deposit of 100,000. It is precisely to evaluate the result of trading and, more broadly, investments that the indicators ROI (Return on Investment) and ROE (Return on Equity) exist.
Despite their similar names, these indicators measure completely different things. ROI shows the efficiency of a specific investment or trade, while ROE is used to evaluate a business and helps understand how well a company uses its shareholders’ money.
For a beginner trader, understanding these terms is especially important. Applying or not applying ROI and ROE is the dividing line between gambling and building an effective trading system.
What Return on Investment (ROI) Is
ROI (Return on Investment) is translated as “investment return” or “payback on investments.” It is one of the most popular financial indicators in the world. It is used by investors, traders, entrepreneurs, marketers, and business owners.
The main task of ROI is to show how much profit each invested ruble, dollar, or other currency has brought.
The basic calculation formula is very simple:
ROI = (Profit / Investment Amount) × 100%
Profit is calculated after deducting all expenses if they relate to this investment.
For a trader, “invested capital” is the amount that is actually involved in a specific operation, that is, the position size (for example, measured in lots). Let’s look at an example.
A trader bought Bitcoin for 5,000 dollars. After some time, the value of the position rose to 6,000 dollars, and the trader locked in the profit, earning 1,000 dollars.
ROI = (1000 / 5000) × 100% = 20%
The return of this trade (investment) was 20%: this means that every invested 100 dollars brought another 20 dollars of profit.
Thus, ROI shows not just the amount of profit, but the relative efficiency of an investment, and therefore ROI is much more informative than a simple amount earned.

ROI is used in practically all areas of investing: trading cryptocurrencies, stocks, currencies, etc. The efficiency of investments in real estate, venture projects, startups, essentially any business, even advertising, is evaluated in the same way (in fact, even primarily).
So there is nothing surprising about ROI being a universal way to compare the results of different trading strategies.
Why ROI Is Important for a Trader
Beginners often evaluate results only by the amount of profit. This is a serious mistake.
Let’s imagine two traders. The first earned 2,000 dollars using a deposit of 100,000 dollars, while the second earned 500 dollars with only 5,000 dollars of capital.
If you look only at profit, the first one looks more successful. However, ROI shows a completely different picture, because the first received about 2%, while the second earned about 10%.
It turns out that the second used capital much more efficiently, and that is exactly why professionals almost always compare trades through percentage returns.
Despite its popularity, ROI cannot be considered a perfect indicator.
It does not account for:
the risk of the trade;
the duration of the investment;
the probability of losses;
the volatility of the asset;
the maximum drawdown.
In trading, risk depends on accounting for the size of the drawdown and the overall probability of losses.
For example, two strategies may show the same ROI. But the first achieves the result calmly, while the second regularly goes through 60% drawdowns.
Obviously, the level of risk is completely different. Therefore, ROI should preferably be used together with other performance indicators.
An important enemy of ROI is time.
Imagine that the first trader earned 15% in a month, and the second did so in two years. If you look only at ROI, their results are identical, which is absurd.
Therefore, serious analysis always uses annualized return (CAGR) for periods longer than a year, or brings ROI to a common time denominator. If a trader earned 15% in 3 months, it cannot be compared with an annual bank deposit.
For a very rough estimate, of course, you can multiply the monthly return by 12, but only with linear scaling, which is almost unattainable in trading.
On the other hand, ROI can be recalculated through compound interest. In our example it looks like this: (1+0.15)(12/3)−1≈74.9%(1+0.15)(12/3)−1≈74.9% annually. Feel the difference: simple multiplication would give 60, while compound interest gives 74.9%.
Compound interest clearly shows the power of reinvestment, but it also inflates expectations during short successful streaks.
Another ROI risk is ignoring costs.
Beginner traders often do not account for the broker's commission. Suppose 8 dollars were paid to enter and exit a position (a common situation on CME). If the total profit is 200 dollars, then the net profit is 192 dollars.
ROI should be calculated based on net profit after deducting all expenses. And in this respect, scalping is a very expensive business, because the broker's commission takes away, for example, 1 point of profit.
If the scalping target is 10 points, then profit immediately drops by 10%. And if there are many trades with a 1:1 ratio of profitable trades to losing ones, then commissions in total can outweigh the profit.
Traders also often forget to properly account for leverage.
If a trader trades with 1:2 margin leverage and enters a trade worth 2000 dollars, then the broker blocks only 1000 dollars in the account. Let the profit from the trade be 300 $.
A beginner calculates ROI based on the collateral: in the example, it is 30%. But this contains a danger. If you evaluate the real trade volume (2000 $), then ROI is 15%.
The first calculation is correct from a formal point of view, but it completely disorients you about risk. In our example, not only the profit potential is taken into account, but also the loss potential. ROI based on collateral can only be used in parallel with an analysis of the stop-out risk; otherwise, it is a path to blowing up the account.
Taking all these factors into account, ROI should preferably be used together with other performance indicators.
ROI vs P&L: what is the difference
Beginners often confuse ROI and P&L indicators, although they answer different questions and are used in different situations.

P&L (Profit and Loss) shows the absolute financial result of a trade: how much money the trader earned or lost. It is usually expressed in the account currency: dollars, euros, rubles, or another currency.
For example, if a trader bought Bitcoin at a price of 100,000 USDT and sold it for 103,000 USDT, his P&L would be +3,000 USDT (excluding fees). If the price fell to 98,000 USDT, P&L would equal –2,000 USDT.
ROI (Return on Investment) shows not the amount of profit, but the efficiency of capital use. It is measured as a percentage and helps understand what return an investment generated relative to the funds invested.
Imagine two traders: the first earned 1,000 USDT using a 20,000 USDT deposit, while the second earned the same 1,000 USDT but traded with a 5,000 USDT deposit.
By P&L, their results are identical — both made a profit of 1,000 USDT. However, ROI will differ significantly: the first trader's return will be 5%, while the second's will be 20%.
It turns out the second trader used his capital much more efficiently.
What Return on Equity (ROE) Is
ROE (Return on Equity) translates as “return on equity.” In classic fundamental analysis, ROE shows how much net profit a company generates for each dollar (euro, ruble, USDT, etc.) of shareholders' equity.
When speaking about trading, the ROE indicator refers not to a trade, but to the trader, and shows how efficiently he uses his money.
If we compare ROE with ROI, then ROI is a characteristic of a specific market operation, while ROE is already a characteristic of the trader as the owner of capital.

The formula for calculating ROE looks as follows:
ROE = (Net Profit / Equity) × 100%
Net profit is taken after taxes have been paid.
At first glance, this is formally the same formula as ROI. But the semantic shift is enormous. In the ROE formula, the denominator is not the cost of a specific purchase, but the entire trading capital that sits in the brokerage account and is exposed to risk. This indicator shows whether capital is really growing or not.
Suppose a trader earned 5000 dollars in net profit over a year with equity of 10000 dollars. In this example, ROE equals 50%, which means that each dollar of equity brought him 50 cents of profit for the year.
For many large investment companies, a 15% figure is considered decent (we are talking about billions of dollars under management). ROE of around 20–30% often indicates very efficient use of capital.
However, an overly high figure requires caution in interpretation. Sometimes it appears not because the trader works excellently, but because he has greatly increased his debt burden. In this case, equity decreases, while ROE grows artificially.
The DuPont Formula for a Trader
In corporate finance, ROE is broken down into three components: profit margin, asset turnover, and financial leverage. The same can be done to understand the nature of profit from trading.
A trader's ROE can be broken down as follows:
ROE≈Average trade ROI×Capital utilization ratio×Leverage
For example, if trader A gets 50% ROE, this may be the result of: an average ROI on the asset of 5%, using the full deposit as collateral (ratio 1), and leverage of 1:10 (5% × 1 × 10 = 50%).
But trader B shows an average trade ROI of 7.5%, while he invests only 20% of capital in the market (ratio 0.2), leverage 1:1 (without borrowing): 7.5% × 0.2 × 1 = 1.5% per trade. By making 10 such “turnovers” (30 trades with 20% of the deposit equals 6 full capital turnovers per year), he reaches his 15% ROE.
This decomposition is critically important. It reveals what produced the result. High ROE created exclusively by huge leverage (the “Leverage” component) is fragile. One sharp move, and the capital will be destroyed (margin call). High ROE created by stable positive ROI on trades (the “Profitability” component) is a sign of a professional trader.
The Key Difference Between ROI and ROE in Trading

Why does a trader absolutely need to calculate both indicators and clearly separate them in their mind?
The ROI of a trade is the "battlefield." It shows the quality of the entry and exit analysis.
If the average ROI per trade (the ratio of profit to position size) is consistently negative, neither increasing leverage nor fully loading the deposit will save the situation — it will only bring total collapse closer.
A trader must catch a decline in trade ROI and review the strategy: perhaps entries have become rushed, while take-profits are too narrow.
Account ROE is strategy and risk management.
ROE reflects the result of managing the entire portfolio. It depends not only on the ROI of a single trade, but also on what share of capital the trader risks and how they use leverage.
You can have a modest ROI of 2-3% on each trade, but through competent money management receive an outstanding account ROE of 50-100% per year without extreme drawdowns. This is the foundation of professional trading.
From Theory to Practice: What a Trader Needs
How can you implement ROI and ROE in trading with maximum benefit? Here are several steps.
Mentally divide your account.
To do this, create an Excel spreadsheet with two tabs.
The “Trades” tab. Here, for each closed position, you calculate net ROI as a percentage of the position size, taking commissions into account. This is an indicator of your “feel.”
The “Capital” tab. Here you enter the daily or monthly account balance. Calculate ROE for the week, month, quarter, and year. Build a balance chart.
Introduce a benchmark for comparison.
It makes no sense to celebrate an ROE of 15% if the S&P 500 stock index rose by 25% over the same period with similar drawdowns. You should not simply make money — you should beat passive investments adjusted for risk. Otherwise, active trading does not justify the time spent.
Compare trade ROI by category. Your trade spreadsheet can show surprising things: your ROI on currency-pair trades is +2%, while on gold it is -5%. Or the ROI of long positions is consistently higher than that of short ones.
This knowledge will allow you to remove unprofitable areas and focus on what works best.
Calibrate risk through ROE. Determine a psychologically acceptable level for yourself. Suppose your goal is 30% per year.
With an average trade ROI of 2% and a frequency of 2 trades per week, how much capital needs to be deployed? Using the reverse linkage, you will be able to understand that there is no need to “gamble” with the entire deposit. Mathematics will protect you from tilt.
Not everyone is comfortable working with Excel before opening a trade. In that case, it is worth using the “trade profit/loss calculator — P&L, ROI, ROE, and liquidation”.
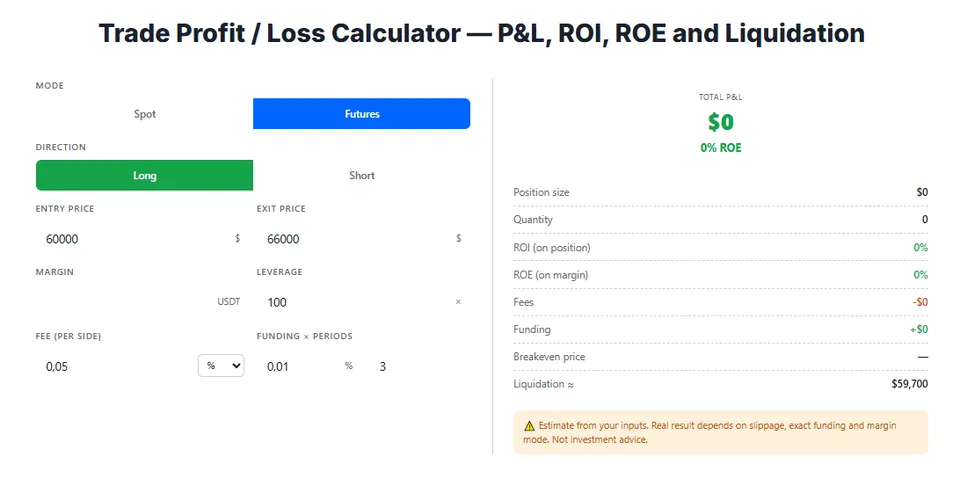
In addition to ROI and ROE, it shows the breakeven price and the liquidation price for futures.
How does the P&L calculator work? Very simply.
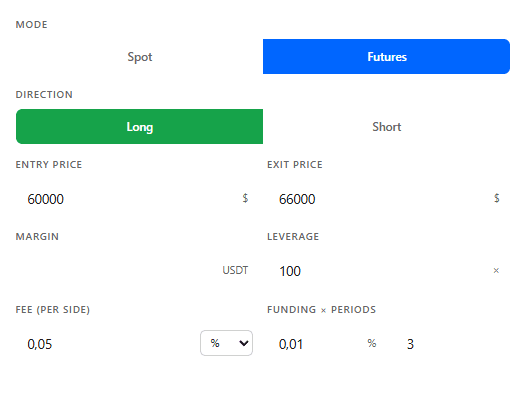
First, you need to select the calculation mode: “Spot” or “Futures.”
Then select the trade type: buy or sell.
After that, set the opening and closing prices of the trade.
For futures, set the margin (collateral) and leverage. For spot, set the position size.
At the next step, you need to set the commission amount in % or in $.
Separately for futures, you need to enter the funding rate and the expected number of funding periods.
As a result, the trader receives a summary table. For spot, it lists the position size, trade volume, ROI, ROE, commissions, and breakeven price.
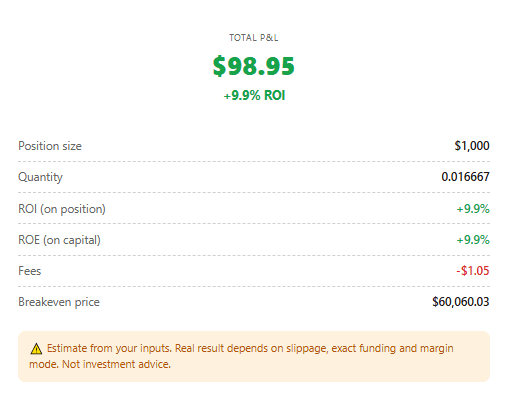
In turn, the futures table additionally shows funding and the liquidation price.
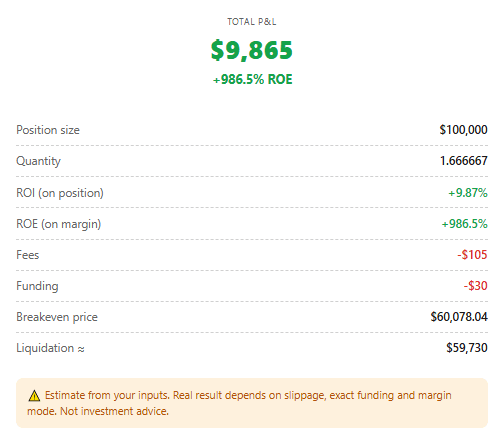
After completing the trade, you can enter the actual data into the calculator and transfer the figures to the Excel table we discussed above.