
Powerful Liquidation Indicators on TradingView

Liquidation indicators appeared on TradingView quite a long time ago.
And there is nothing surprising about that: crypto futures liquidation zones are reasonably viewed by traders as potential reversal zones or zones whose breakout will signal the development of a move.
From dozens of liquidation indicators available on TradingView, we selected two scripts popular in the trader community: Liquidation Levels (by Leviathan) and Liquidation Reversal Signals (by AlgoAlpha). The first liquidation indicator has stood the test of time and hundreds of thousands of users, while the second was released quite recently, in November 2025, but has already drawn interest from tens of thousands of TradingView visitors.
Liquidation Indicator Liquidation Levels
The Liquidation Levels liquidation indicator was released by LeviathanCapital in December 2022.
Leviathan Capital (37.5 thousand followers) is the author of scripts that were popular in 2022-2024. Unfortunately, he has not released new indicators for more than 1.5 years, but the old ones work correctly, and that is what matters most.
TradingView shows that the date of the last update for the Liquidation Levels liquidation indicator was August 8, 2023. At the moment (February 2026), the indicator has gained more than 300 thousand views.
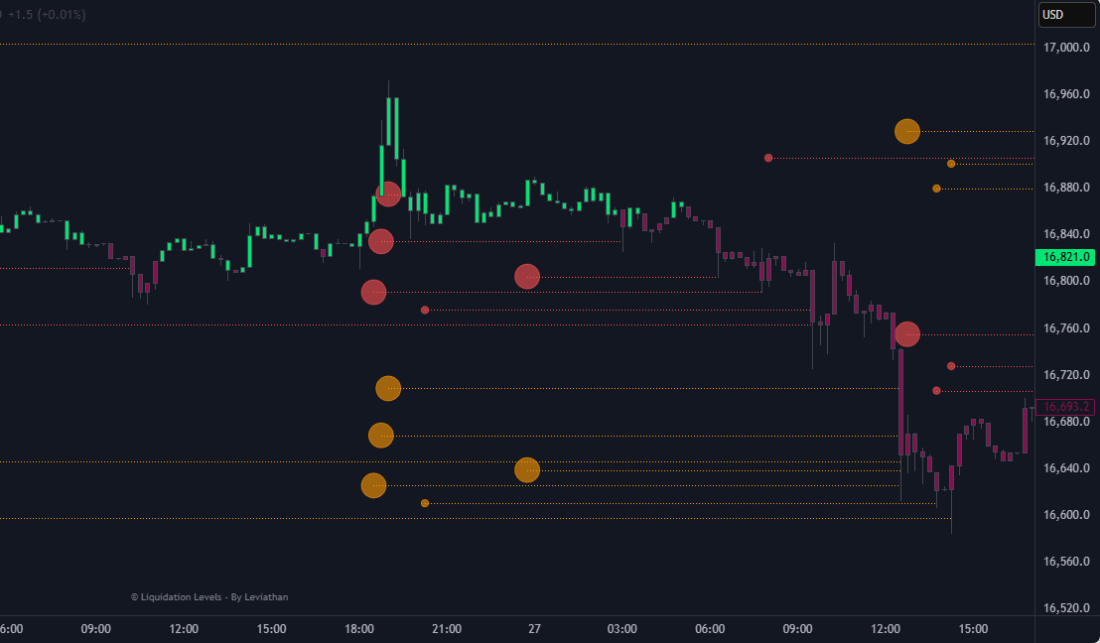
Liquidation Levels is a protected (closed-source) Pine indicator that plots estimated "liquidation levels" (zones/lines and bubbles) based on analysis of open interest, volume, and CVD (Cumulative Volume Delta).
The main idea built into it by the developer is to show where a potential liquidation zone is located so these zones can be used in trading as liquidity-grab levels.
This indicator offers a choice of Primary Source of Data: the user personally specifies which data to use in the calculation. The set of options and the author's recommendations are as follows:
- Open Interest (OI) — recommended for use on Binance perpetuals (TradingView provides OI there). The author considers open interest the most important parameter for assessing position opening/closing.
- OI + Volume — a combined mode; useful in the same places where OI is available.
- OI + CVD — OI with a cumulative volume delta approximation.
- CVD (imitation of cumulative volume delta) — a mode without OI, suitable for spot / stocks / indices where OI is unavailable.
- Volume — a volume-only mode (also for markets without OI).
Important: the author warns that TradingView provides a limited set of open-interest data, so the best results will be on perpetual futures quoted on Binance, because open-interest data can be taken from there.
The liquidation indicator under discussion offers the following options for visualizing information:
Liquidation Levels lines, which indicate potential liquidation prices with different leverage sizes (different leverage levels) taken into account. CLOSE / HALF / VWAP / VWMA can be chosen as the basis for the calculation.
Liquidation Level Bubbles ("bubbles"), which mark the appearance of new significant levels. The size of the bubbles reflects the relative magnitude of positions (small / medium / large) based on standard deviations (z-score).
Market Order Bubbles (market buy / sell bubbles) are intended to visualize large aggressive volumes placed at market. The author assumes that large market orders may point either to real liquidations or to large entries.
Color Candles makes it possible to color candles by the selected criterion (OI Delta / Volume / Stoch), which adds extra visual context to the direction of activity.
Leverage Ratio is a marker indicator of the market's relative "debt load" (approximate; works if OI is available). Crosses above/below price give a signal: above = more leverage, below = less.
Market Info Screener / Legend / Hide Filled Lines is a panel with brief information (OI, Volume, aggressive side, Leverage Ratio).
The indicator works as follows. It tracks anomalies in order flows / volumes (comparison with MA / standard deviation) — when there are more "new positions" than the threshold based on deviation σ, a level / bubble is generated.
This is a standard approach: searching for statistically anomalous clusters of open positions on the assumption that liquidity accumulations are located there.
For market bubbles, volume filtering (the CVD approach) is applied to visualize aggressive buying / selling (potential liquidations / strong entries).
Indicator Settings
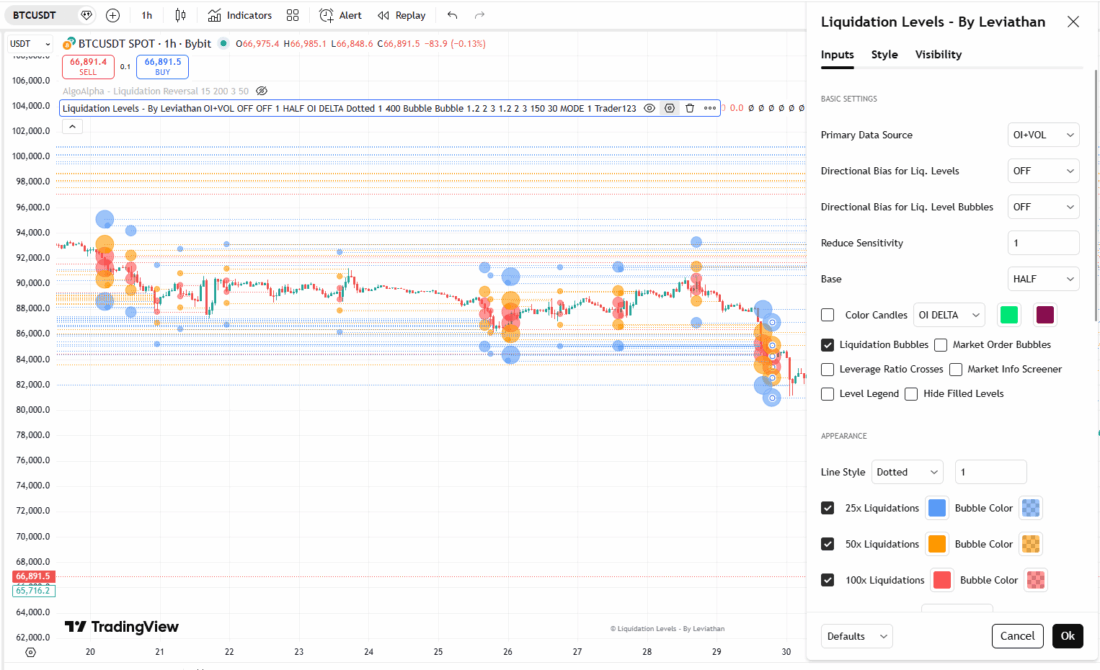
Basic settings / data source
- Primary Source of Data: Open Interest, OI + VOL, OI + CVD, CVD, Volume.
Filtering / sensitivity
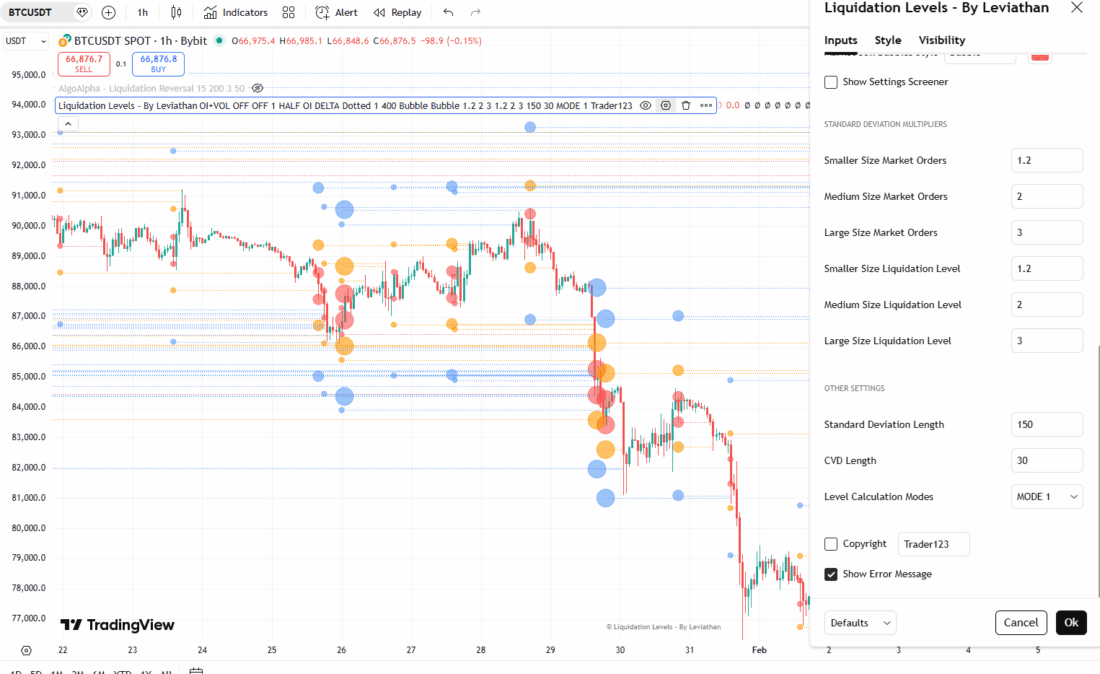
- Reduce Sensitivity — a global threshold multiplier for Smaller/Medium/Large levels (reduces/increases the number of generated levels).
- Standard Deviation Multipliers — three threshold multipliers for bubbles/levels (they regulate what should be considered a "large" value).
- Standard Deviation Length — the window (bars) for calculating deviation σ (adjusts the "localness" of signals).
- CVD Length — the window for the cumulative volume calculation.
Computational foundation / base
- Base: CLOSE, HALF (middle of the candle), VWAP, VWMA. (levels are drawn relative to the selected base).
- Level Calculation Modes — 3 modes for the distance between the base and the levels (details in the UI).
Visuals
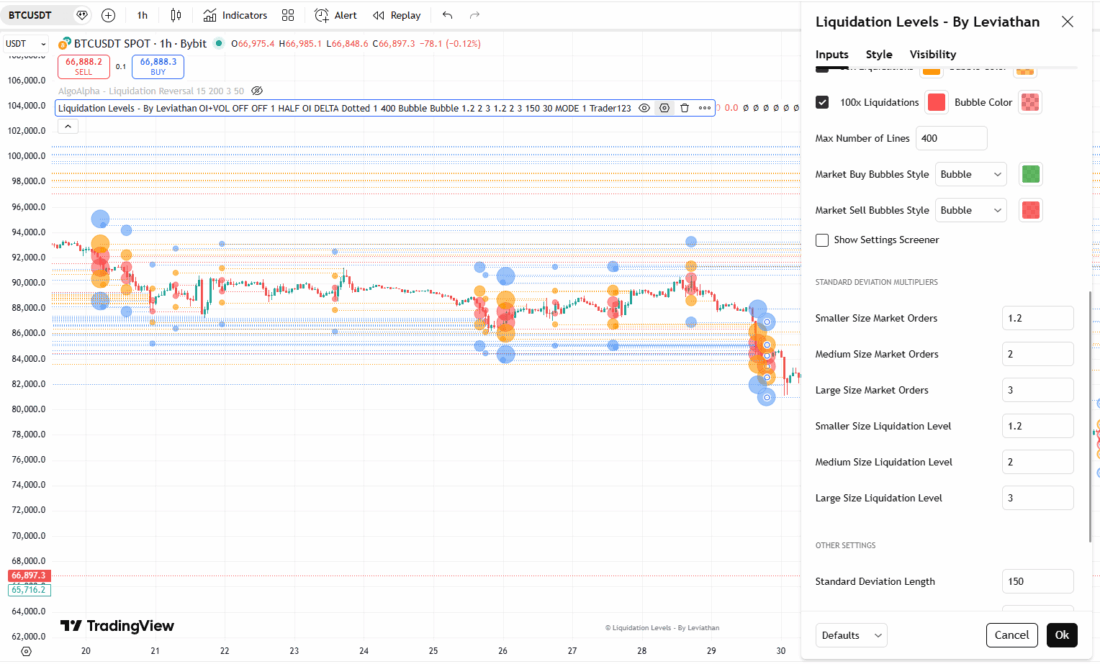
- Line Style, Line Color, Max Number of Lines (keep TradingView's 500-line limit in mind), Bubble Style, Show/Hide Legend and Screener.
Special
- Directional Bias for lines and bubbles (if ON, only the "probable" side is displayed).
- Hide Filled Lines — hides "worked-off" levels to reduce visual noise.
Reviews of the Liquidation Levels Liquidation Indicator
The reviews were taken from TradersList, Reddit, and TradingView.
In the crypto trader community, this liquidation indicator is generally perceived positively as a practical tool for visualizing liquidity zones. Users note the flexibility of the settings.
Among the drawbacks, traders mention the closed source code and the dependence on the quality of data provided by TradingView (especially open-interest data). Some traders note that the data provided by the Liquidation Levels indicator requires confirmation from other systems (I fully agree).
Liquidation Indicator Liquidation Reversal Signals
The open-source Liquidation Reversal Signals liquidation indicator was published by AlgoAlpha in November-December 2025. AlgoAlpha (more than 67 thousand followers) is one of TradingView's top authors. That says a lot.
In the three months after publication, this liquidation indicator gained ~85.8 thousand views. Such rapid growth in popularity was, of course, connected with the crash in the cryptocurrency market.
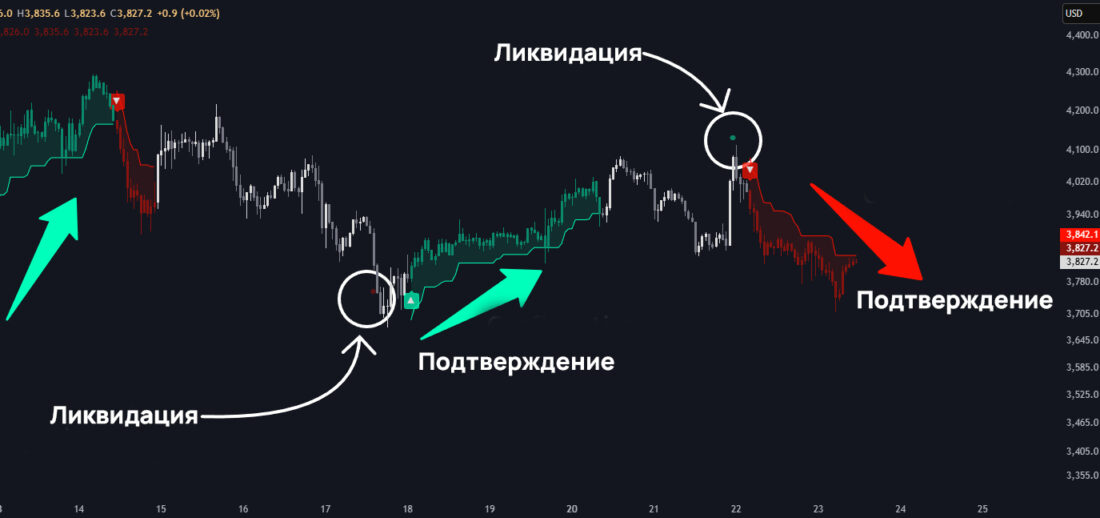
Liquidation Reversal Signals is an indicator that shows probable reversals caused by mass liquidations, combining directional volume statistics (a standard z-score estimate and volume accumulated in one direction on a lower timeframe) and the classic Supertrend as trend context.
A signal is considered valid if a statistical directional volume outlier coincides with a Supertrend reversal within a specified time window - then the indicator draws a circle/arrow and changes the fill/color.
The following data serve as sources for the calculation:
- Bar volume (up/down volume) — the indicator calculates a Z-score for directional volume on the selected lower timeframe (M15 by default) — this is the basis for searching for "liquidation anomalies."
- Supertrend — serves as a structural filter/context: a Supertrend reversal confirms that the statistical volume outlier coincided with a change in market structure.
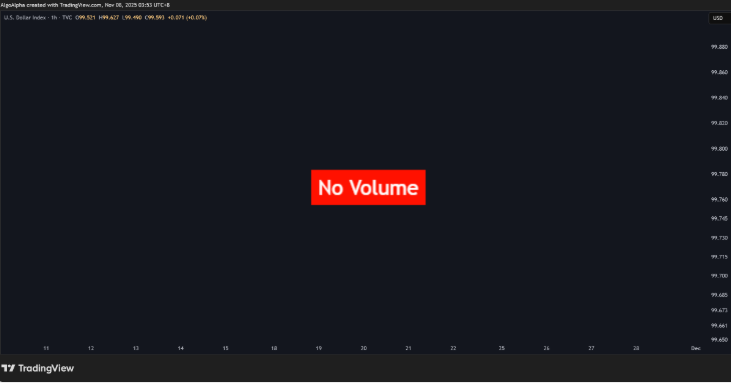
- Liquidity check (No-Volume warning) — the indicator gives a "No Volume" warning if the instrument is not liquid enough (otherwise there will be many false signals).
- Internal statistical windows — Z-score uses a lookback window (Z-Score Length) and standard deviations to determine extremes.
The liquidation indicator under discussion has the following options for visualizing information:
Rectangles/markers under bars (long liquidations) and above bars (short liquidations) — they record a statistically significant volume outlier.
Arrows / color changes — when, after a volume spike, a Supertrend begins within the timeframe, the indicator draws a confirmed arrow and changes the fill color (green = bullish reversal; red = bearish).
Fills / candle color changes — intensity/transparency is connected with the "magnitude" of the volume spike.
On-chart "No Volume" warning — insufficient volume on the instrument.
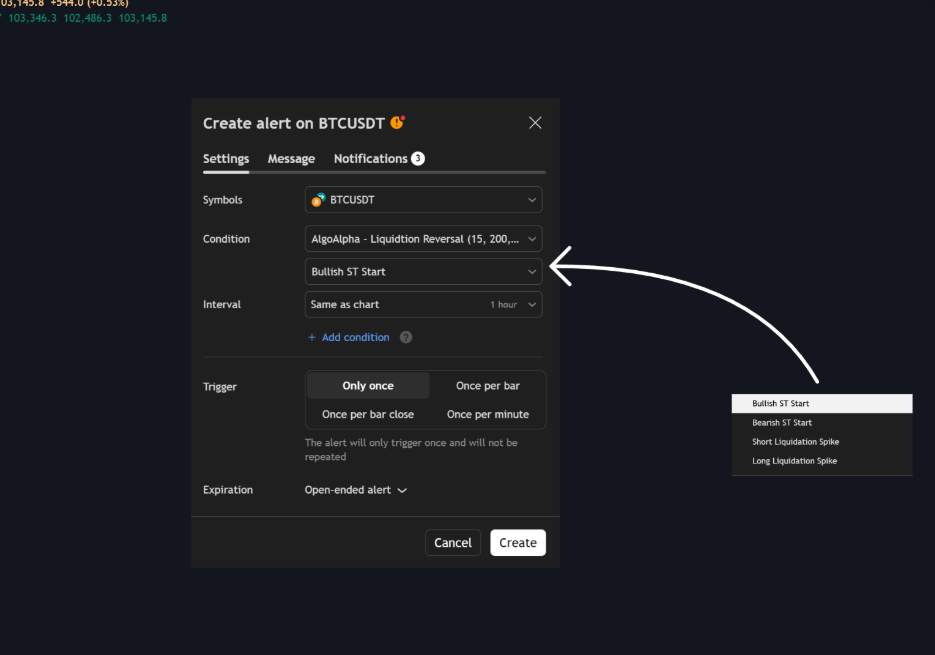
Alerts (notifications) — you can set up alerts for anomalous volumes and confirmed reversals.
Key Indicator Settings
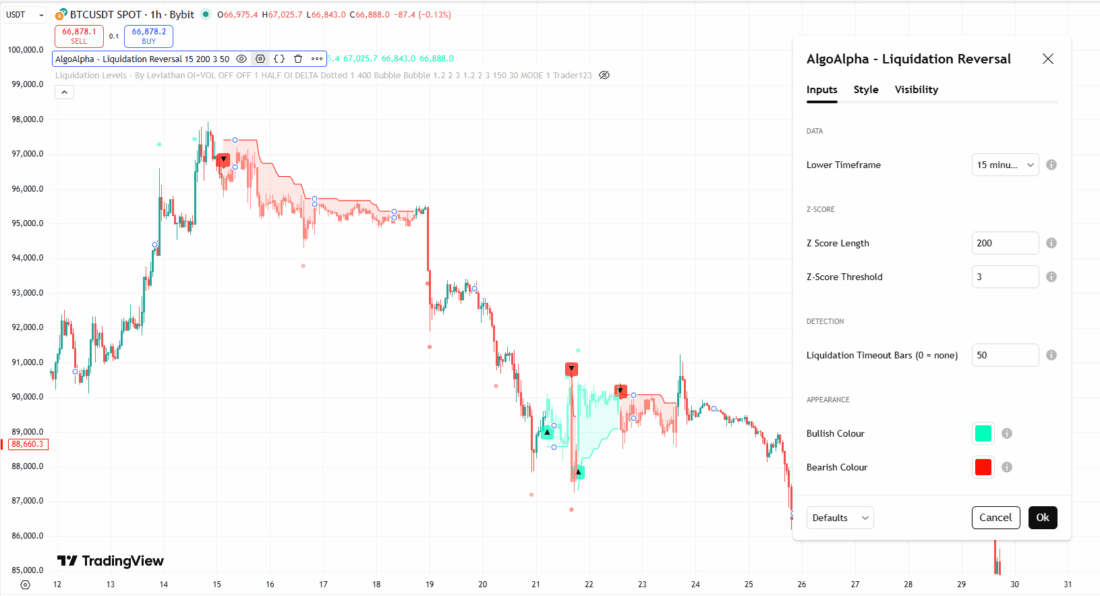
Lower Timeframe — the timeframe from which spike and direction data are taken (M15 by default). The lower the timeframe, the more accurately liquidity flows are identified, but the noise becomes much higher.
Z-Score Length (lookback) — the window for calculating z-score (longer — smooths/reduces false triggers; shorter — reacts faster).
Z-Score Threshold — the boundary of "extremeness" (higher — only very strong spikes; lower — more frequent/smaller events).
Timeout Bars — the acceptable number of bars between the detected spike and the subsequent Supertrend reversal, during which confirmation is considered valid (for example, 20-50 bars).
Alerts ON/OFF — a spike signal and/or a confirmed reversal signal.
No-volume filter — enabled automatically/configured to avoid triggers on low-liquidity assets.
The indicator provides ready-made conditions for setting up alerts:
- "liquidation spike" signal (volume event only),
- "confirmed reversal" signal (spike + Supertrend flip).
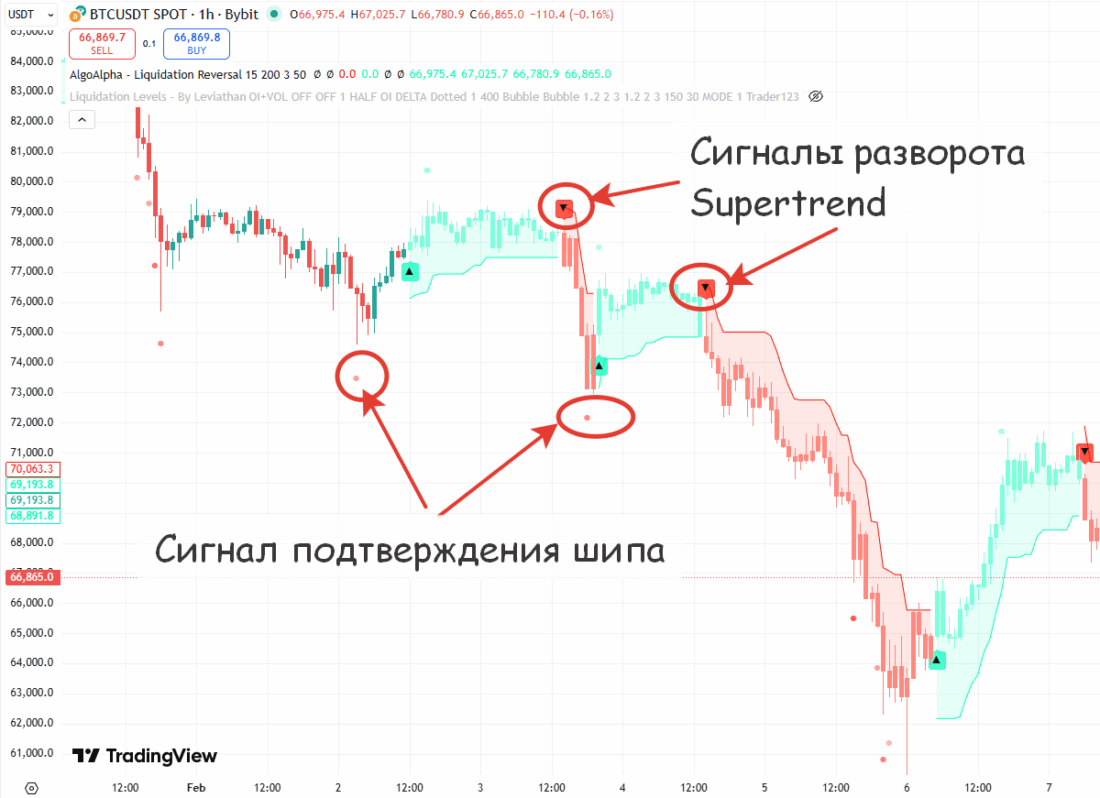
The author recommends combining a lower timeframe for volume analysis and the main working timeframe for Supertrend (for example, the main TF is 1 / 4 hours, the lower one is 15 minutes). In this case, the indicator records local stop-runs (liquidations) and checks whether a reversal follows them.
Reviews of the Liquidation Reversal Signals Liquidation Indicator
The Liquidation Reversal Signals indicator quickly gained popularity among crypto traders.
Almost immediately after release, YouTube reviews devoted to installing and using this indicator appeared.
The overall tone of the discussions is positive. Users report that it filters "real" volume extremes well and gives useful visual markers. At the same time, it is noted that there may be false triggers on low-liquidity instruments.
Overall, according to user reviews, the indicator requires correct tuning of Z-score and timeouts.
Conclusion
The best strategy for finding liquidation zones lies in combining TradingView indicators (the ones discussed above or any others - there are several dozen of them there), as well as in analyzing data that can be found on Coinglass.
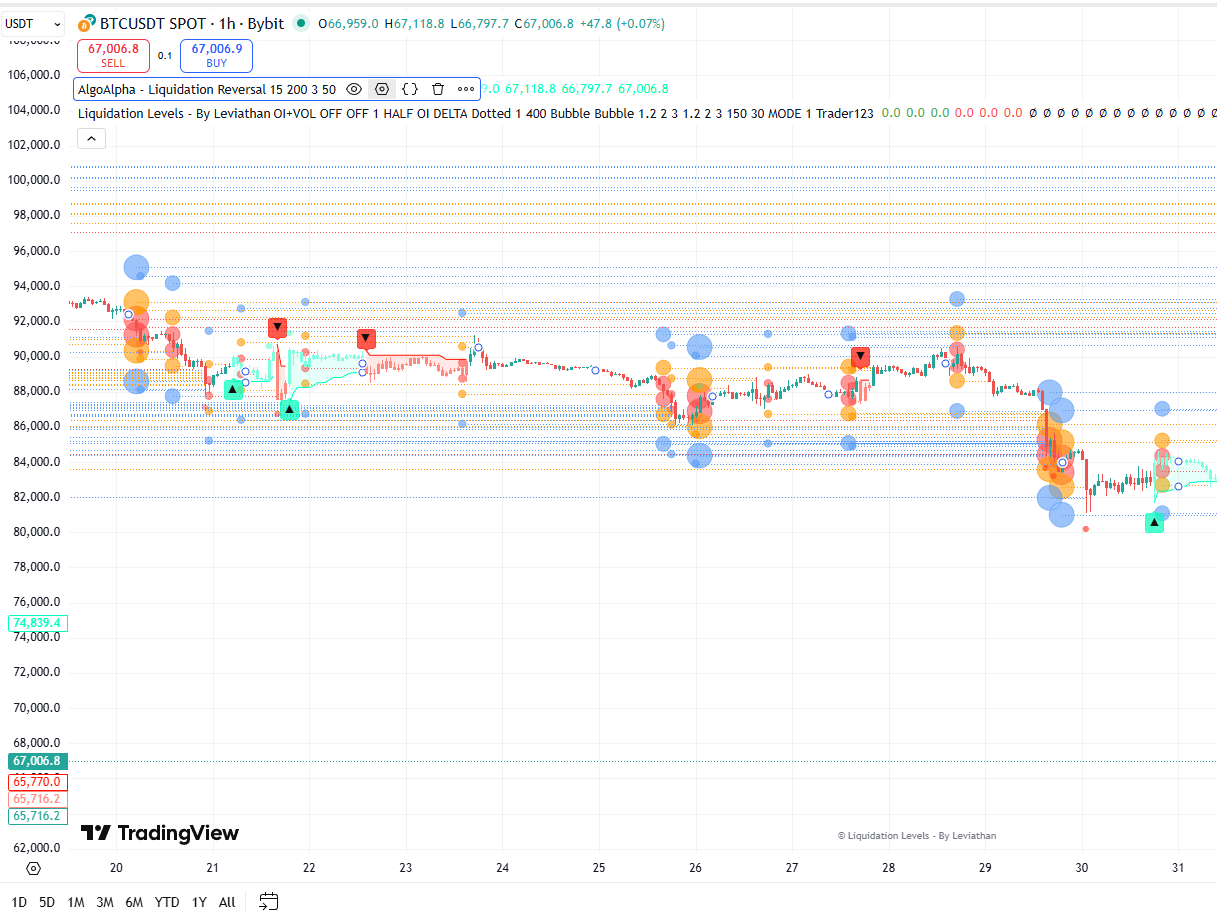
This is what a BTCUSDT chart looks like with the Liquidation Reversal Signals and Liquidation Levels liquidation indicators installed. In general, despite the slightly different calculation mechanics, the levels coincide. The more coincidences there are, the more reliable the zone.
In my opinion, Liquidation Reversal Signals is easier to understand and more accurate even with basic settings. The Liquidation Levels indicator sometimes glitches, but overall it is suitable for microscalping with basic settings.
Successful trades!