
Pin Bars in the Context of Market Movement: Important Points No One Talks About

Hello, ladies and gentlemen forex traders!
Today we will talk about the "royal" candle called the pin bar. Everyone sees it, it is simple and clear to identify. But is this pattern really that effective? There are numerous disputes around this topic between supporters and opponents of this method.
Let us say right away: far from every pin bar works out. At the same time, pin bars used in the context of market movement are an extremely powerful tool. In this article, we will examine specific trading examples for the D1-H1 timeframes.
How, among the many pin bars appearing on the chart, can you find the one whose probability of working out will be the highest? How can you minimize risk and increase potential profit? How can you, in a single trade with a 5% risk, increase your deposit by 50% or more?
We will try to answer all questions. Stock up on popcorn, it will be interesting.
Introduction
It so happened that when I was getting acquainted with the financial markets, a question arose before me: which price action pattern should I settle on after all?
It should be clearly visible and easy to identify on the chart. The overall structure should not be complicated, but absolutely understandable in use. It should be universal and work in different markets.
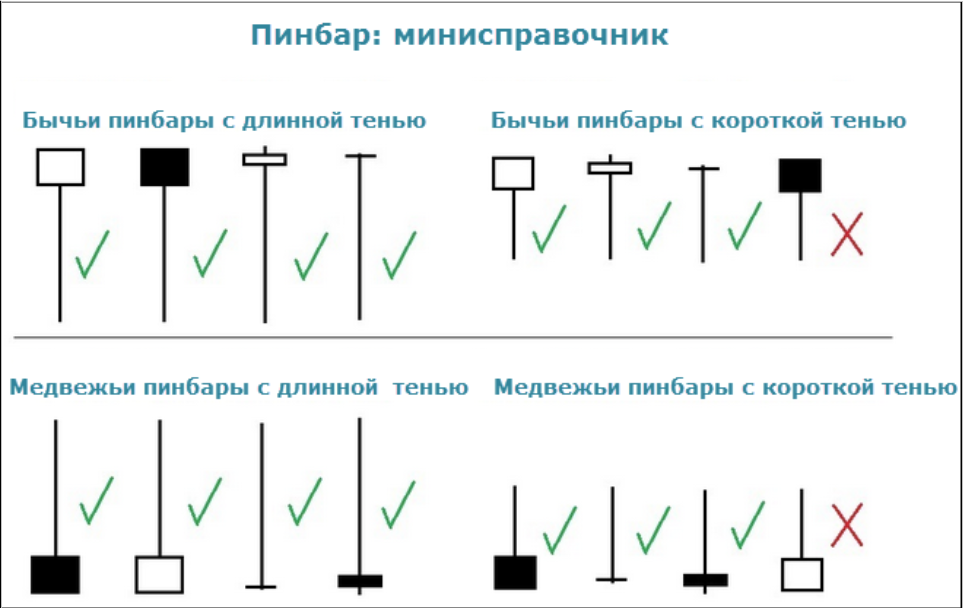
After analyzing all existing patterns in the form of Japanese candlesticks, my choice fell on a candle with a long shadow and a small body. On historical and theoretical data gathered over many years, I noticed a pattern of follow-through and a good, powerful move after such a candle appeared. This inspired me. I downloaded and printed out a mini-guide on pin bars. I topped up my deposit with a small amount and was already preparing to buy a new car. How wrong I was...
The Beginning of Trading
I bought my first book on trading by the world-renowned expert and trader Alexander Elder, "Trading for a Living."

And I began studying the basics, while simultaneously trading forex and writing down thoughts that at the time I considered important, practically rewriting the entire book. It said that you must not risk more than 1% of your deposit. Okay, let us go make money already.
The first trades, probably like for most people, were profitable. I saw a pin bar on the chart and opened a trade with a profit-to-risk ratio of 1:2. It looked something like this:
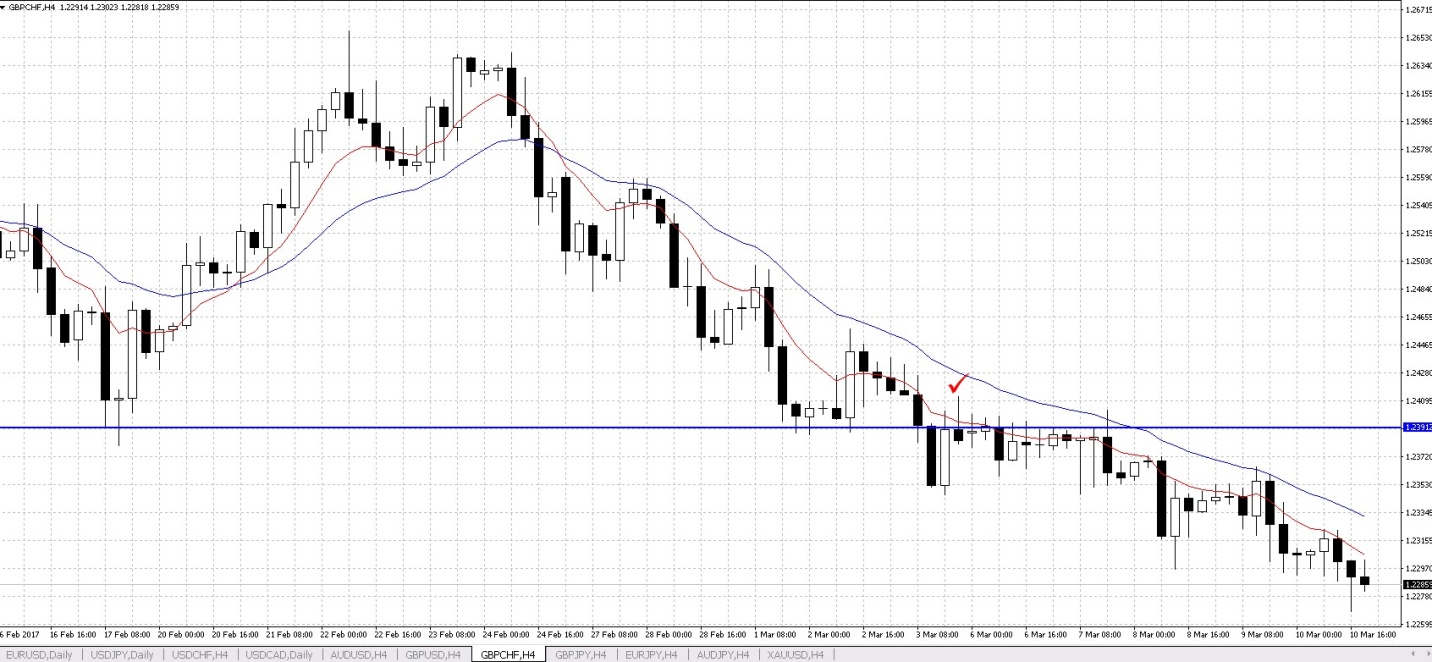
Screenshot from 4 years ago, GBPCHF, H4 timeframe. The entry pin bar is marked with a check mark. This is how I traded for some time.
Long hours at the monitor and opening trades without a system on practically every pin bar with a 1% risk did not bring the profits that I had set for myself. I should already have been approaching my first million, and instead there were some pitiful 20 bucks for an entire day of work.
But if there are more profitable trades than losing ones, I will increase the risk per trade, and in this way I will earn more. So what if I had read and studied the trading of experienced traders, where they said that in the first year or two the primary task should be preserving capital.
How long can I keep preserving it, it is already time to earn. Besides, my mother always told me that I am the best. Others did not succeed, but I will succeed.
The risk per trade begins to increase in proportion to the losses.
Something went wrong here: 4 losing trades in a row. Life had not prepared me for this, I am getting farther and farther from a million. I have to win it all back in the next trade (emotions are already at the limit, a state of tilt).
So the first deposit approached zero. Then came the first nervous breakdown. A feeling of complete helplessness and emptiness.
At the very least, severe depression is guaranteed.
After blowing deposits, many people have no desire to return to trading, because they begin to identify it with a negative feeling.
Trading Is a Psychological Activity

You want to change your quality of life for the better. You earned and set aside some amount for this. But psychologically you are not ready to lose it, you are only ready to increase it, and as quickly as possible.
The situation is that you built certain expectations around easy and quick earnings over a short period of time. And then a series of losing trades begins, and it simply breaks you morally. Expectations in trading are a destructive thing. The pain from this event will inevitably leave a mark.
I destroyed a huge number of such deposits. The problem of emotional control remained unresolved. I had already begun to blame pin bars for not working, while at the same time starting to trade other patterns. But the situation kept repeating itself.
Stage: Realization

Sooner or later you will come to the point where you will find all the answers to your questions within yourself.
Systems will suddenly start working, an understanding of price movement will come, and intuition will develop. It will be a new fresh look at things. In this regard, trading is an absolutely unique thing: it allows a person to develop as an individual, improve in various areas, and discover new levels of knowledge through a series of defeats and victories.
How to stabilize the psychological background and find harmony in trading, we will discuss another time, since that is a separate topic.
Returning to Pin Bars

I often encounter a situation in which I see some beginner posting a screenshot for discussion in a trading thread with recommendations:
- Guys, this is a PIN BAR, I am enteringgg, a sure 100% winner (well, and then you know how it goes);
- It is unrealistic to make money on it (having become disappointed, he goes off to sell advisors from the Tlap forum).
Friend, if you only knew what you will have to go through before the patterns you follow begin to work more or less regularly. In that case, you would be more restrained in your recommendations.
The main problem is trading price action patterns without understanding market movement. A candle by itself gives no guarantee of playing out; it only carries information about the opening, closing, high, and low of price movement over a certain period of time (depending on the chosen TF).
Everything works through a combination of factors that tilt the probabilities in your favor.
So which pin bars should you trade?
The ones where the market itself suggests that this pattern at this particular moment in time has the highest mathematical expectation for the probability of playing out. To understand this theory, you need to move on to practice.
Let us turn to the figure:
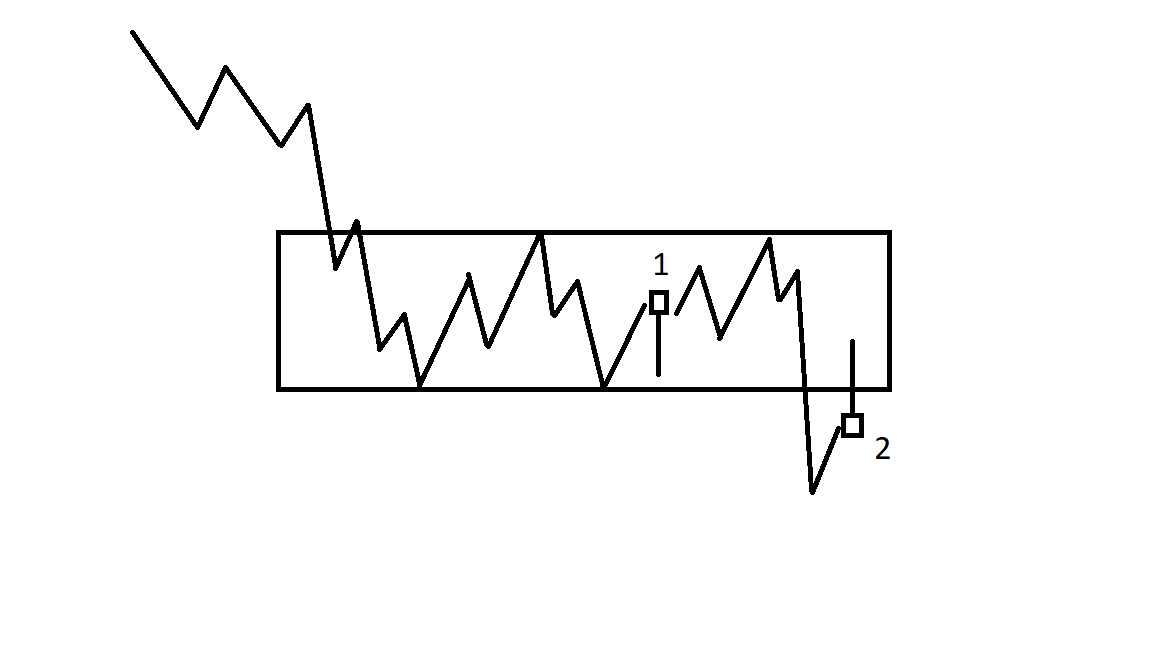
Here we see a downward trend. The price enters a consolidation phase, and in this corridor a bullish pin bar No. 1 is formed.
Is it appropriate there? Not at all. It is just a candle that does not suggest or point to anything (if it had been formed from the boundaries of a flat level, one could still talk about something).
Next we see a breakout of the zone along the trend, a retest, and the formation of bearish pin bar No. 2. Is its placement in this spot logical? Absolutely! Everything indicates that the downward movement will continue.
This is the method by which you should search for patterns on the chart. They must fit into the context of market movement.
There are only two types of working pin bars:
1. Reversal pin bars from a level;
2. Pin bars of movement continuation.
Let us consider these two options. Let us start with No. 2.

An effective option is to trade those pin bars where the price exits some zone, makes a retest by returning to the broken level, and forms a pin bar. In order to identify effective pin bars, it is necessary to understand where price movement is directed. The ideal option is impulse, retest, entry.
An entry option after a range.
As we know, price spends most of its time in a flat state (with no directional movement).
But after a flat comes a breakout, and that is what interests us. We, as traders, make money from price movement. In consolidation there is an accumulation of volume. We do not need any indicators, order books, or the opinion of the grandma from the next building.
If price breaks out, pierces the boundary, and holds above it, we wait for a retest and the formation of a pin bar.
Several more variants are possible:
1) Price may not pull back after the breakout and may go farther;
2) Pull back, hesitate at the level, and then move in the desired direction, forming a different pattern.
The third option is that an exit by stop-loss will sometimes happen. But there is no need to worry, there are enough entry opportunities.
People have pressing questions:
- All of this is very interesting, but so far not especially clear;
- Show me the entry point!
I am showing the entry point. H1 chart. Bullish variant:
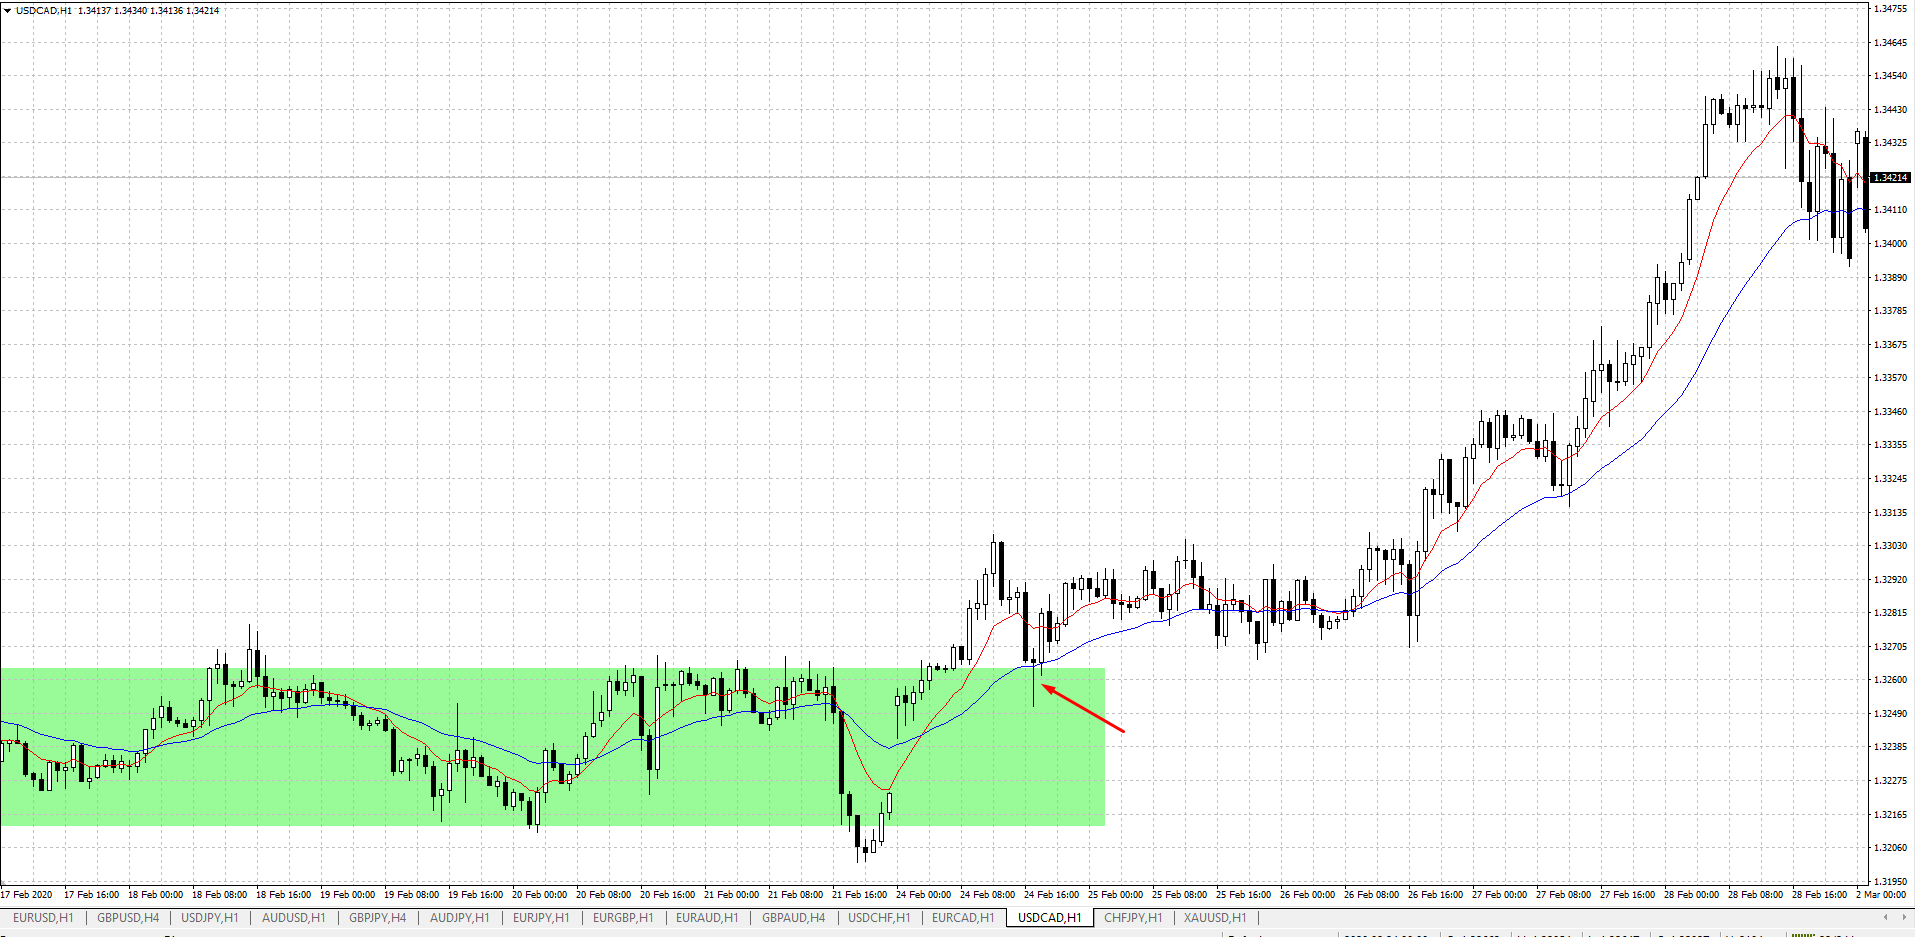
Bearish variant:
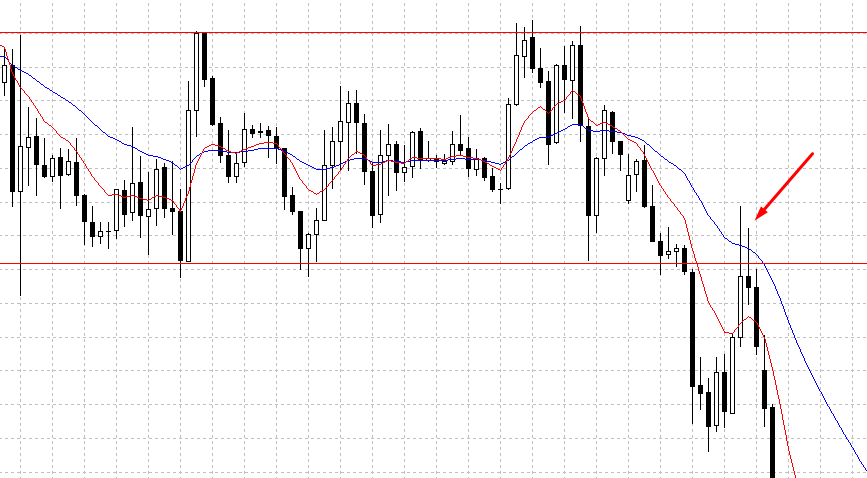
I remind you that initially you need to assess not the entry point, but the market movement itself, and based on the movement context, look for an entry point.
Price is moving in a corridor. We expect a breakout to one side or the other. After the breakout has occurred, it is necessary to wait for a pullback to the previously broken zone and the formation of a pin bar. Thus, we trade in the direction of the movement that has already begun.
Why is it necessary to wait for a pullback?
Entering after a pullback at the previously broken zone makes it possible to open a trade at the best price with a minimally short stop. The stop is placed either behind the spike/tail/shadow/wick of the candle, or behind the impulse of the level zone being broken (here we judge by the situation).
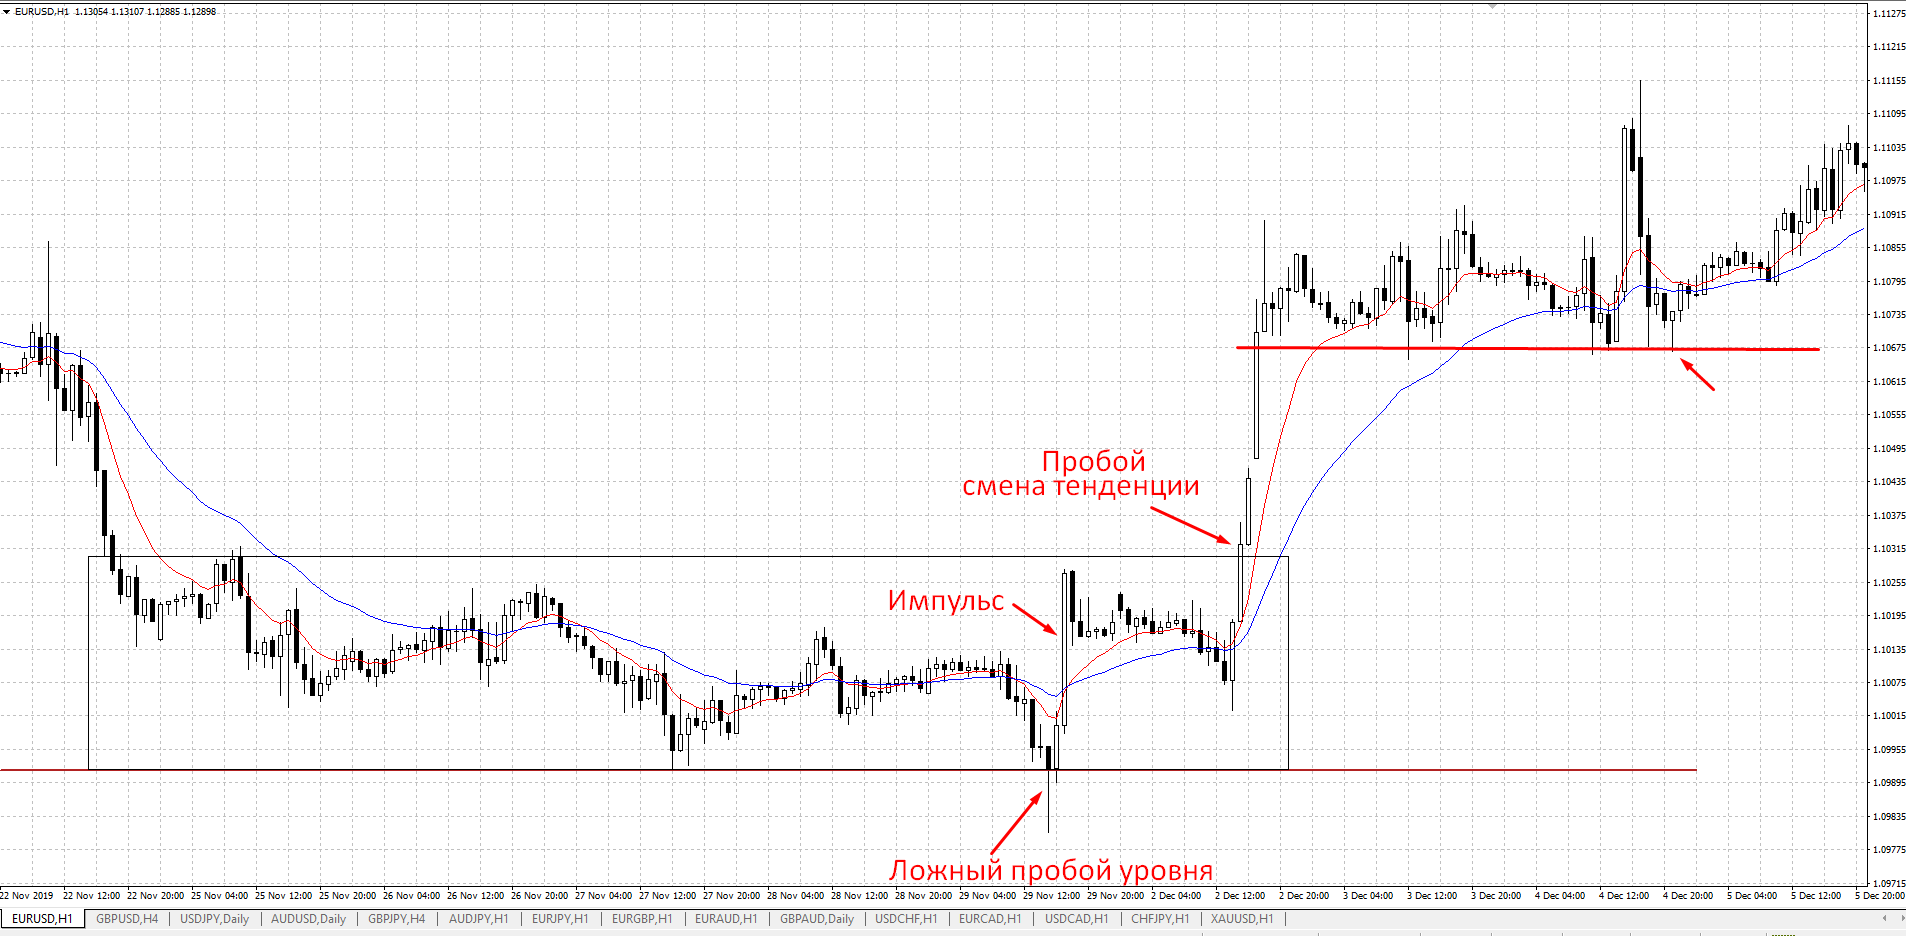
Let us examine a specific EURUSD trade, H1 timeframe.
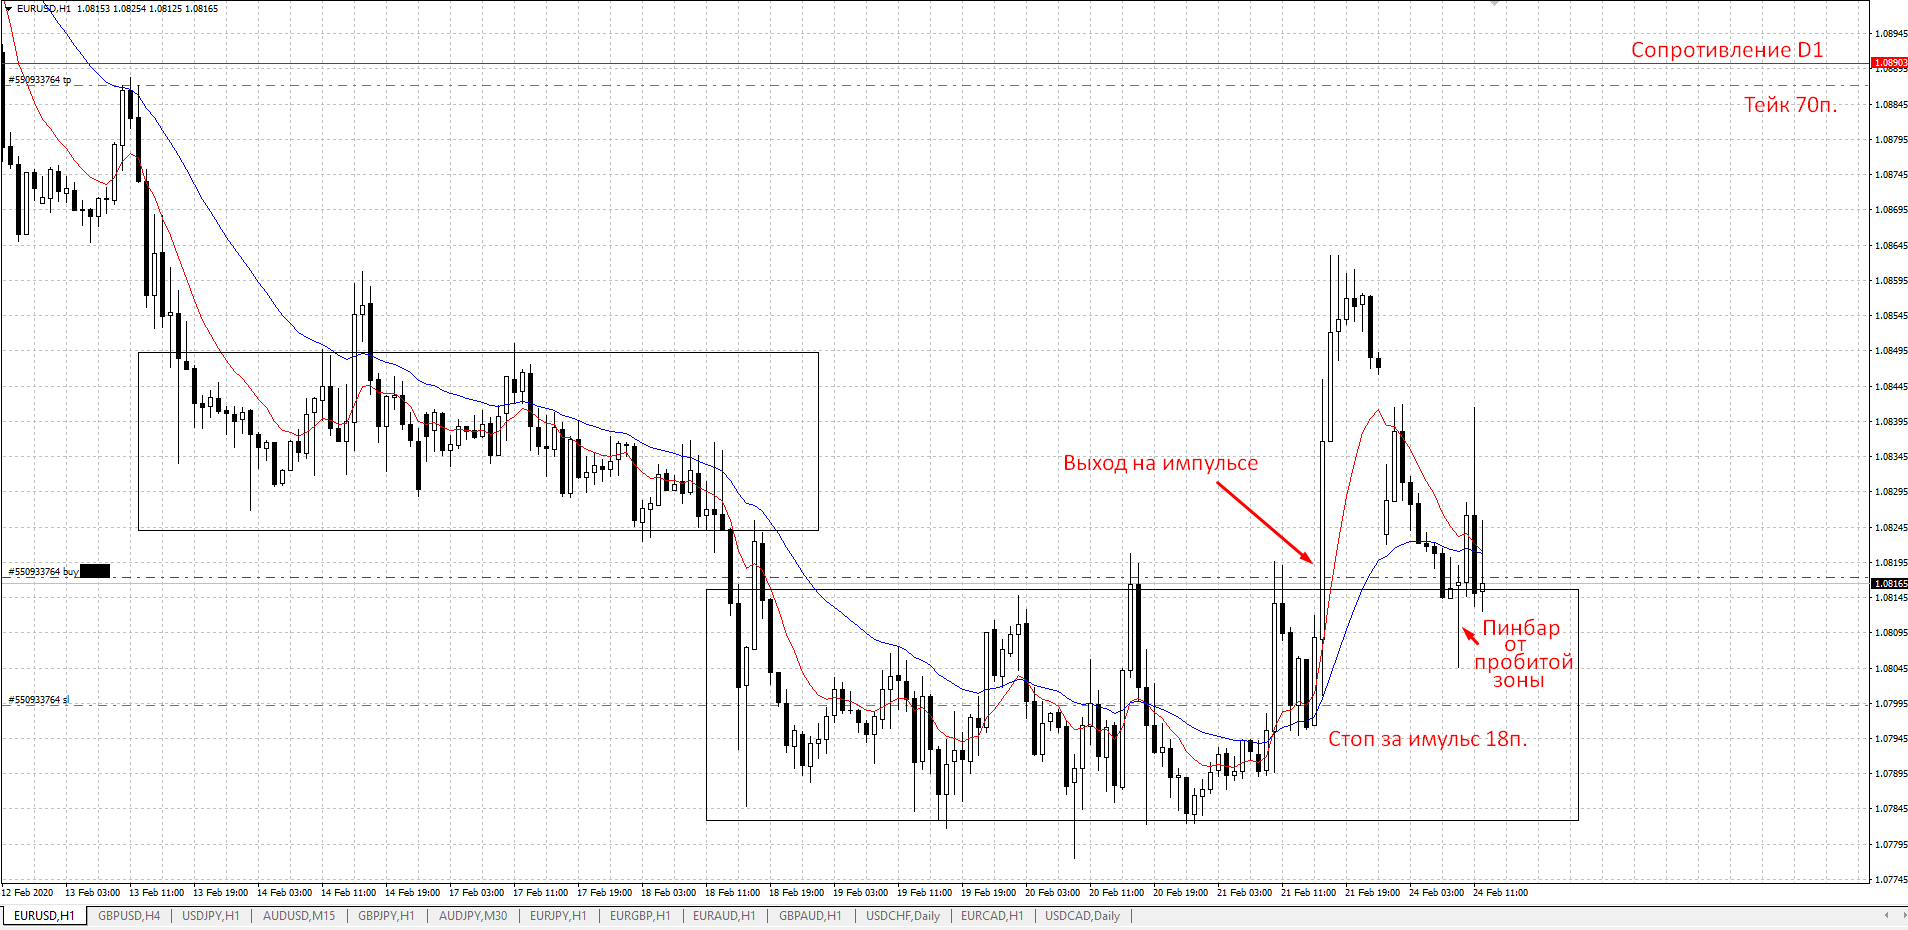
We see a downward trend on the chart. It will not last forever, especially in forex, sooner or later the tendency will change. Price enters a consolidation phase, forming a flat zone. Now there are three possible scenarios:
1) Price will spend some time marking time in this area;
2) Price will break the lower boundary, and the trend will continue;
3) Price will break the upper boundary, and the trend will reverse.
Here we observe the development of the third scenario. Price breaks the upper boundary and leaves on impulse. Now the task is to wait for a pullback to the previously broken zone. Price pulls back, falsely breaks the level boundary, while forming the spike of a pin bar, which tells us that price is rejecting this zone and preparing to move higher. Everything is ready. The trade can be opened.
In this situation the stop must be placed behind the large white breakout candle. The take is set at the nearest problem zone, marked by resistance from D1. One should always try to take at least part of the earned profit at the nearest problem level that will interact with price, because that is where pullbacks/corrections/consolidations begin.
Usually I prefer to take profit at the nearest level if it meets the criterion of R no less than 1:3. If there is a signal on the D1 chart in the direction of your move, then the trade can be held.
If the level is broken, it is not a problem: we will enter on the retest and keep moving. But if the price decides to reverse from this level, the profit earned will disappear.
Trade management

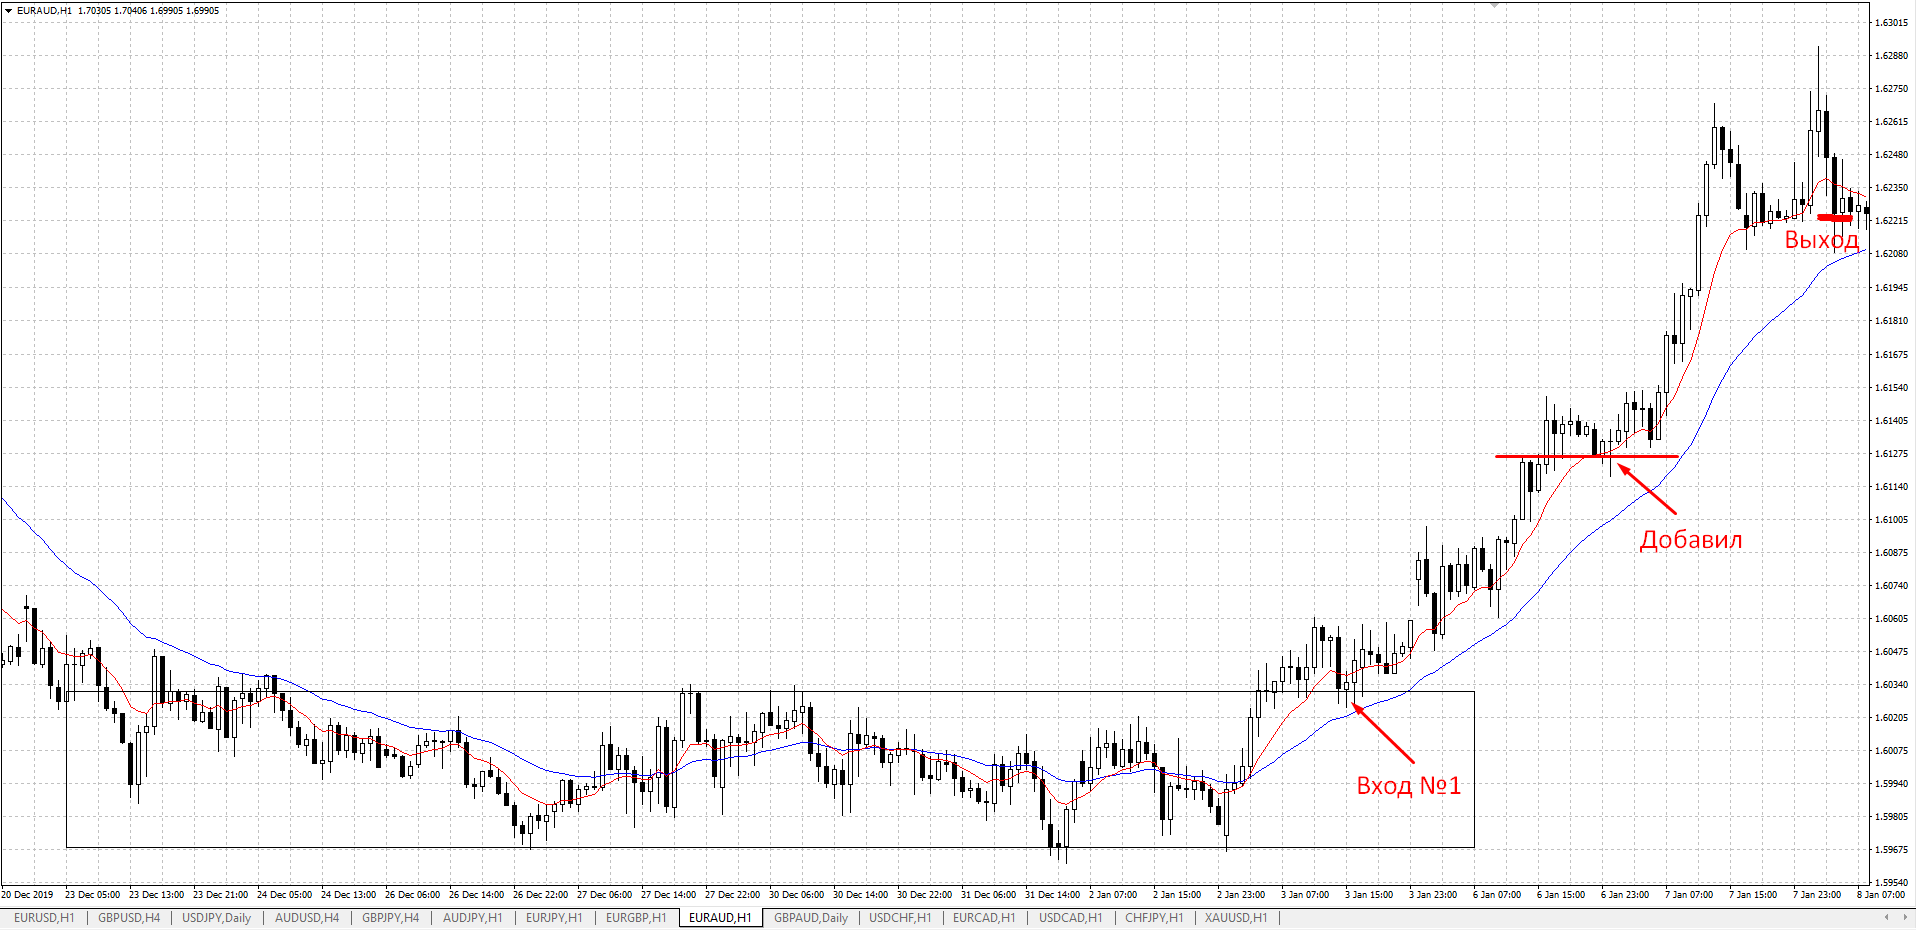
The price moves in the needed direction, then pulls back, forming two more pin bars. In this situation, a decision is made to minimize risk and increase potential profit. An addition is made to the position on the pin bar after a pullback of about 50% to the impulse of the large white candle (entry No. 2), already in the direction of the uptrend.
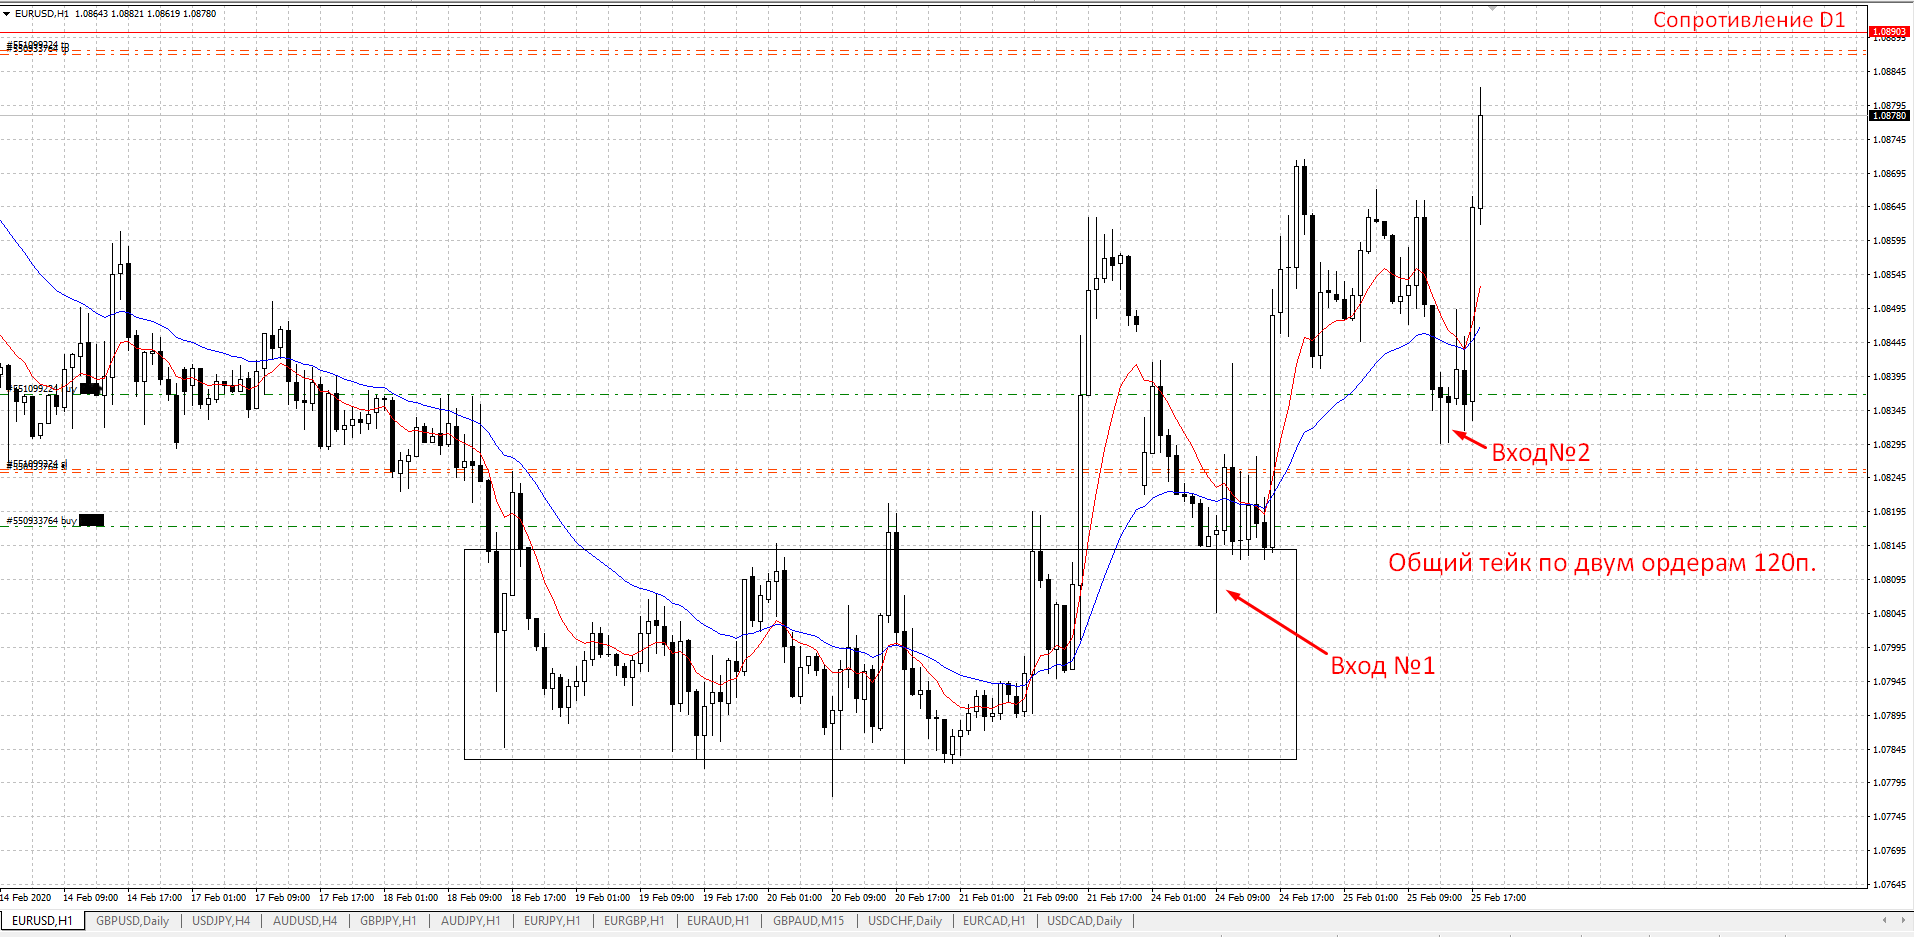
Stops from the first and second trades are placed below the tails of entry No. 2. There is no need to place the stop exactly at the end of the tail. I add from 3 to 10 pips depending on the pair and the timeframe. If you pay attention to entry No. 2, then after the first pin bar a second one formed immediately after it, whose tail practically touched the low of the previous one. In such situations, there is a high probability of stops being taken out. This is a standard safety cushion against widening spreads and the price returning to the low/high of the tail.
Thus, if the price decides to move against my position, the first trade will close with a small profit. The second trade will close with a loss, which in total will equal 2 pips of risk with a total potential profit on the two orders of 120 pips. I always try to minimize risk and increase profit, but only when the market itself allows it. I do not try to impose my wishes on it, but on the contrary, I listen to its advice in the form of price action patterns.
But this is already a more advanced trade management technique. In the early stages, you need to practice the entry, waiting for the take profit or stop loss (set and forget).
An entry option from price lows and highs along the movement.
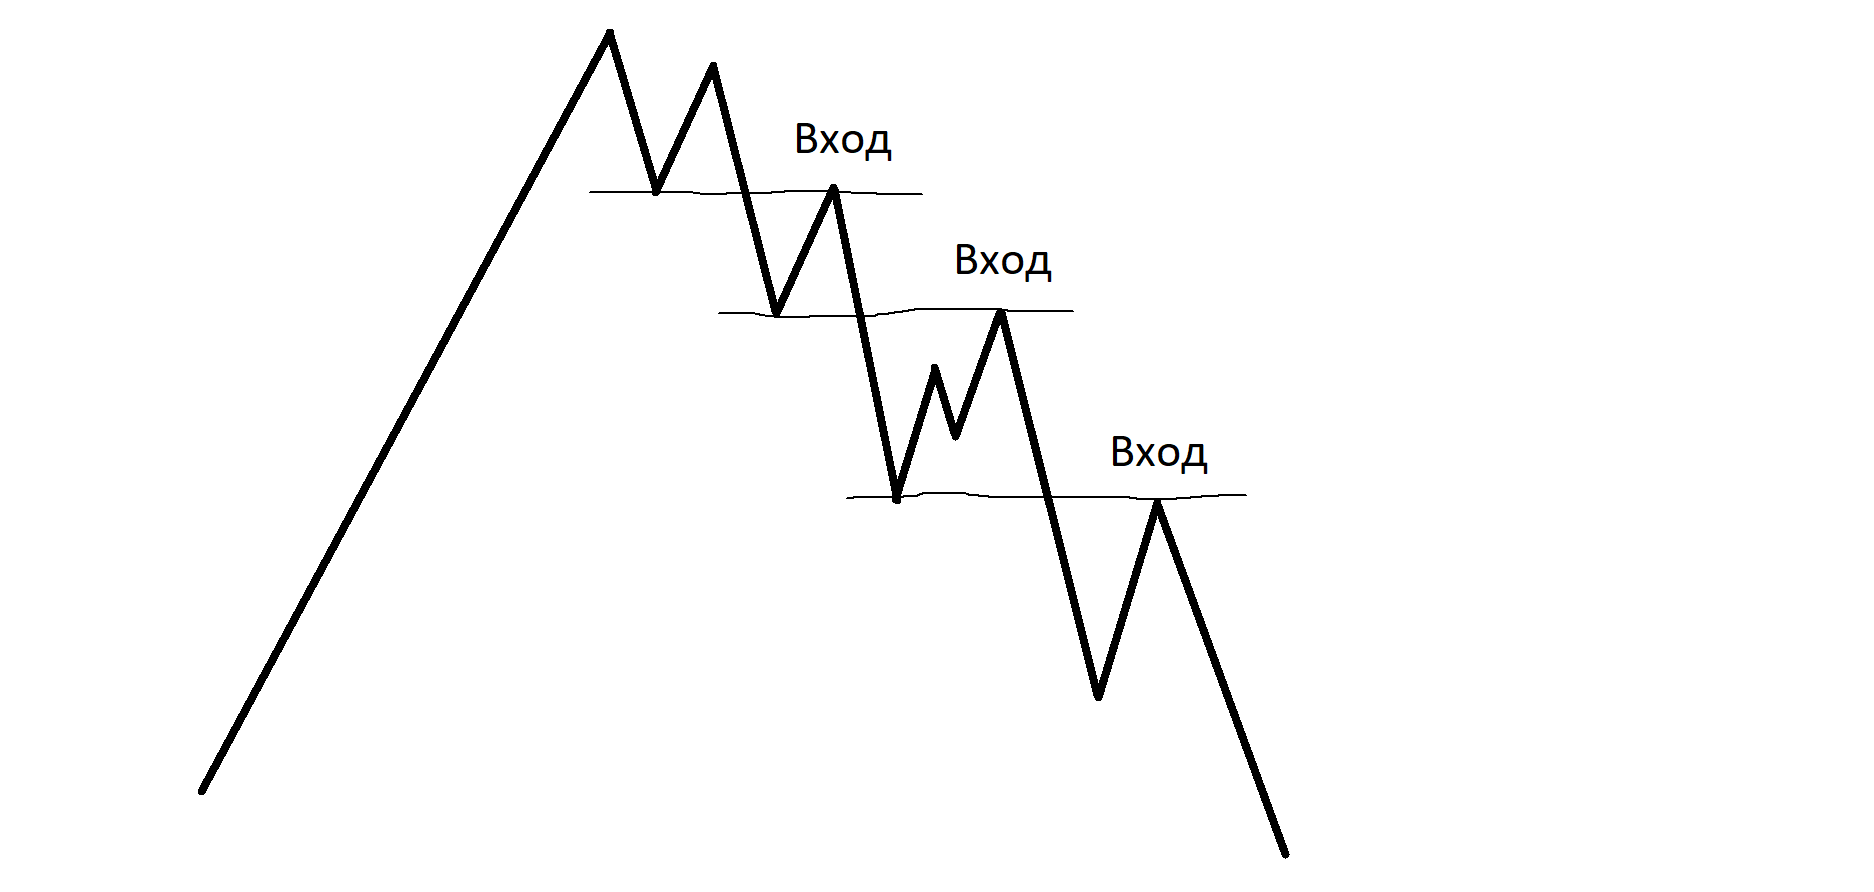
It looks like this. Bearish option:
Bullish option:
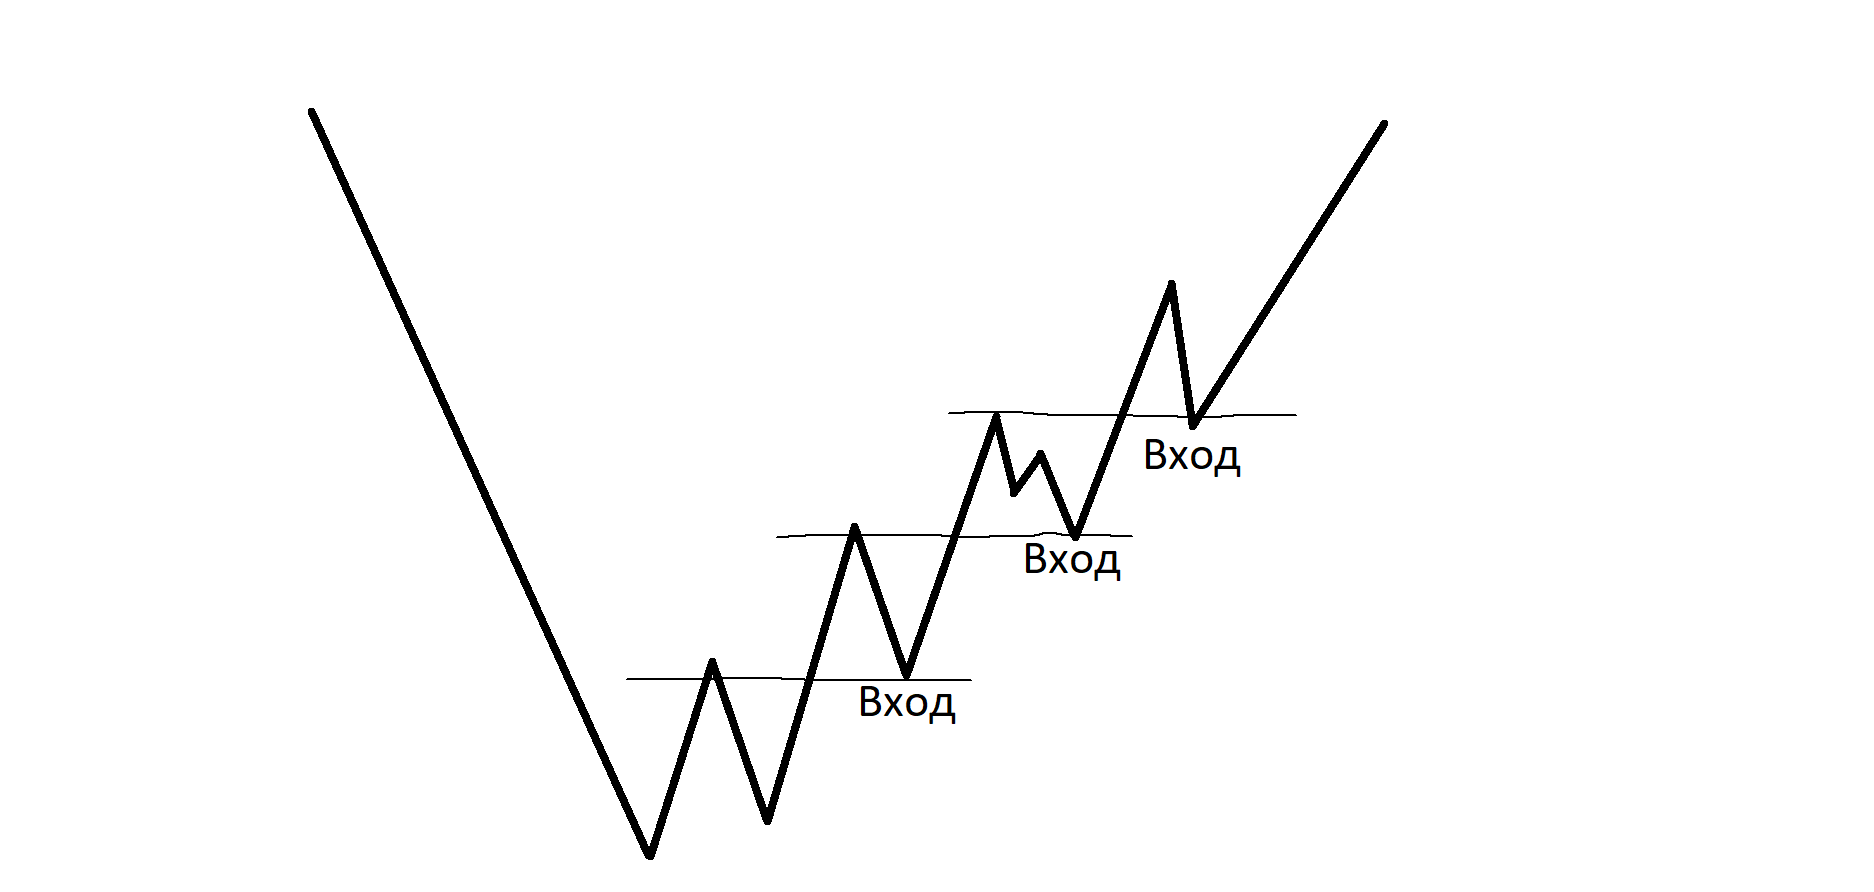
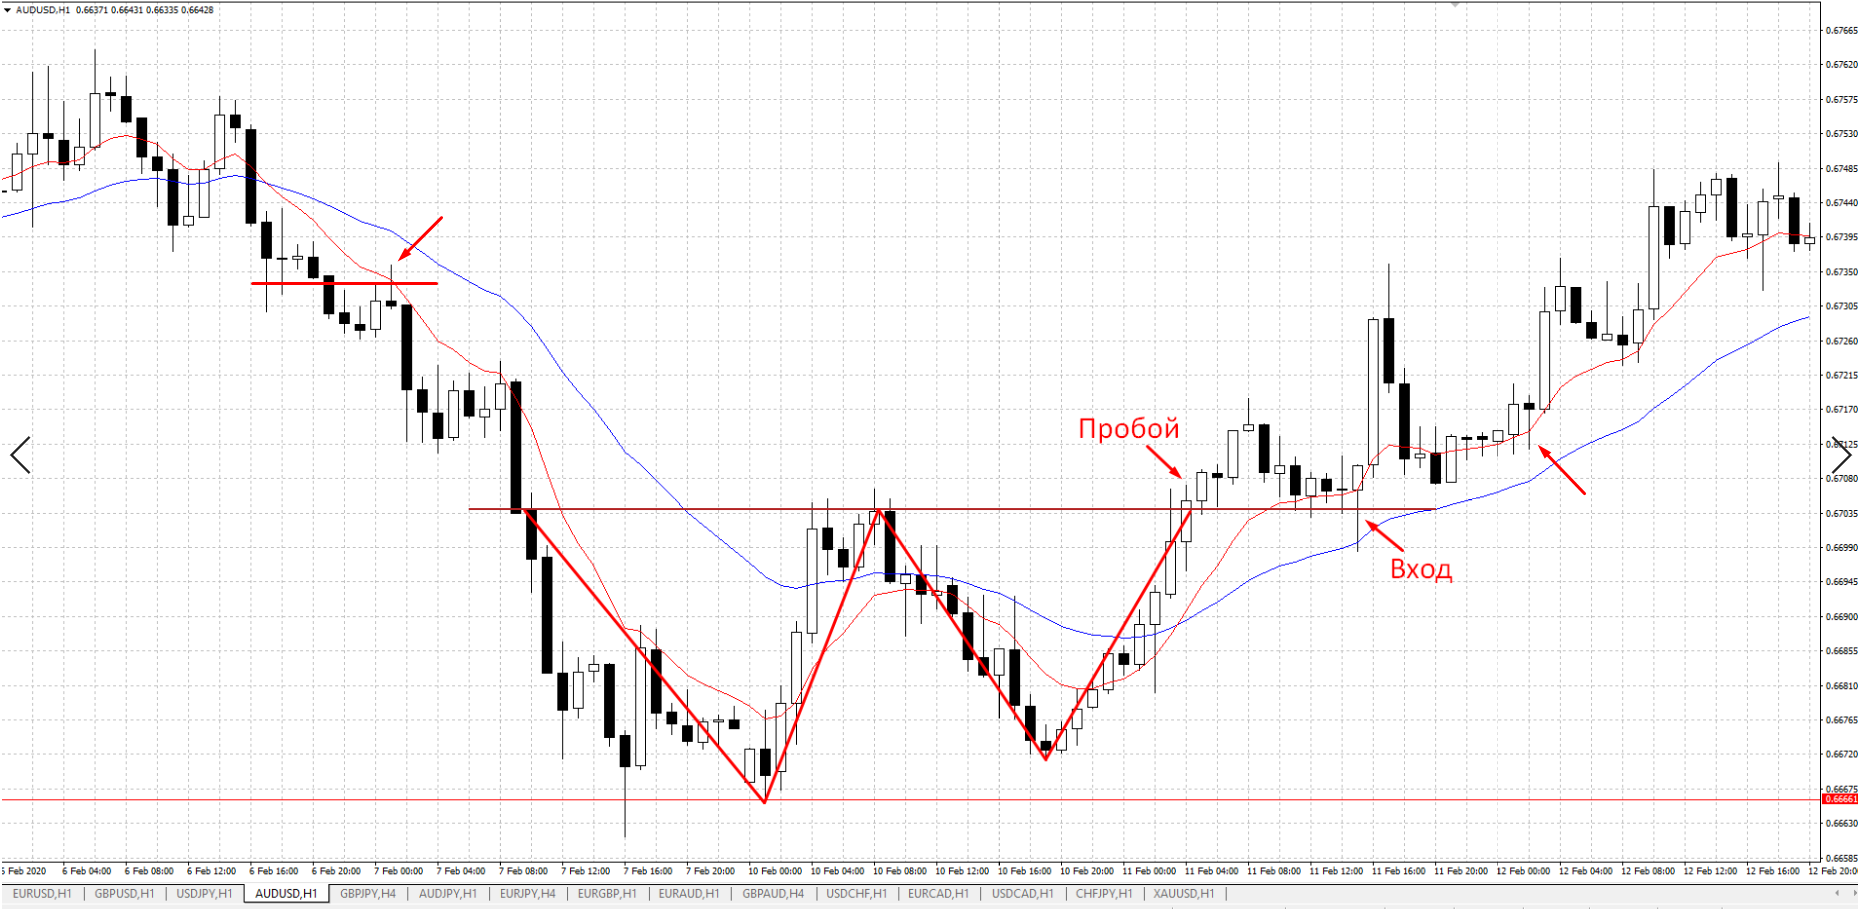
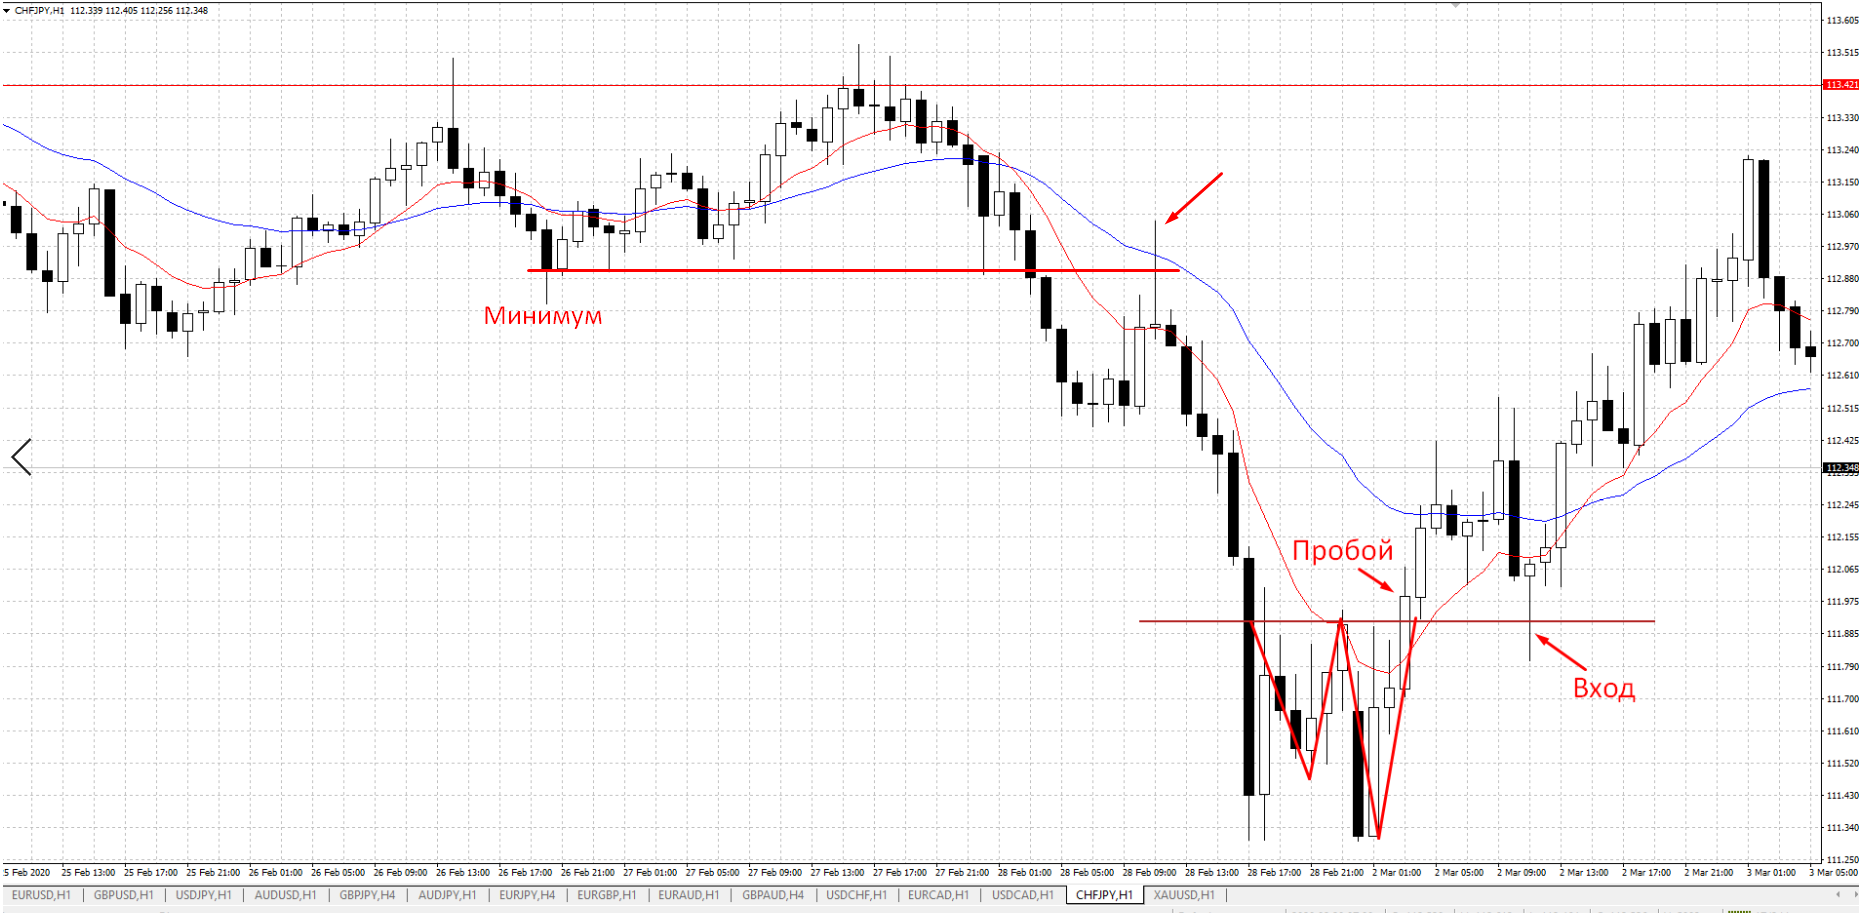
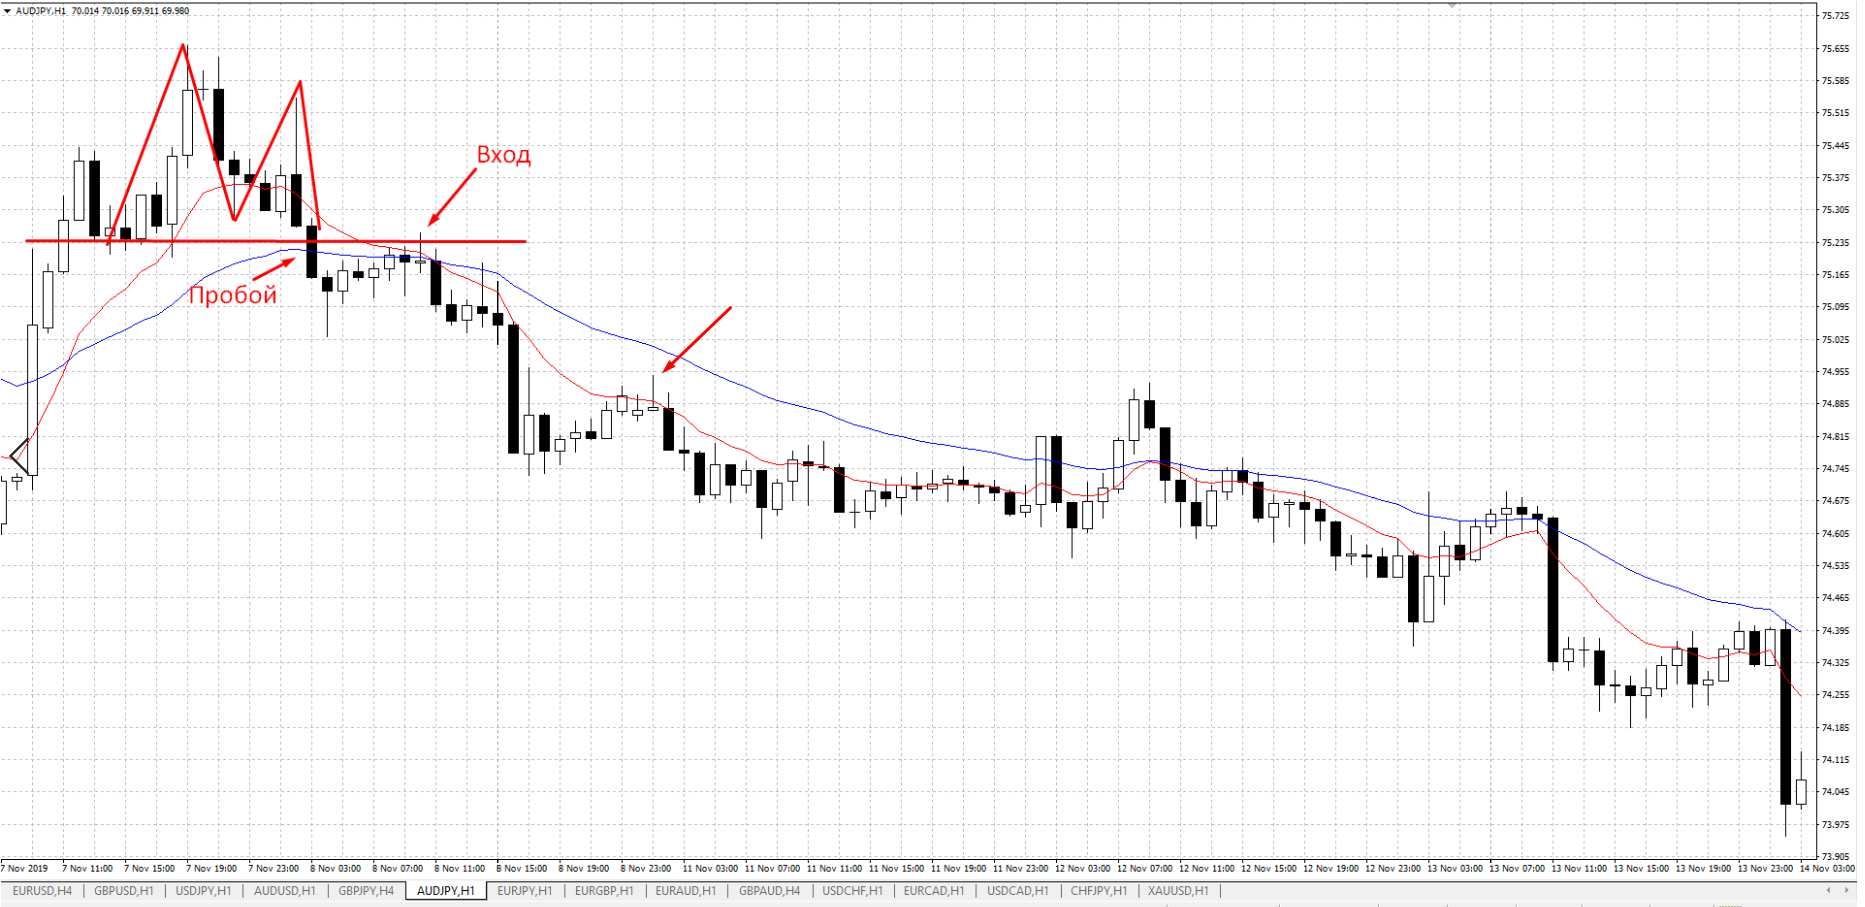
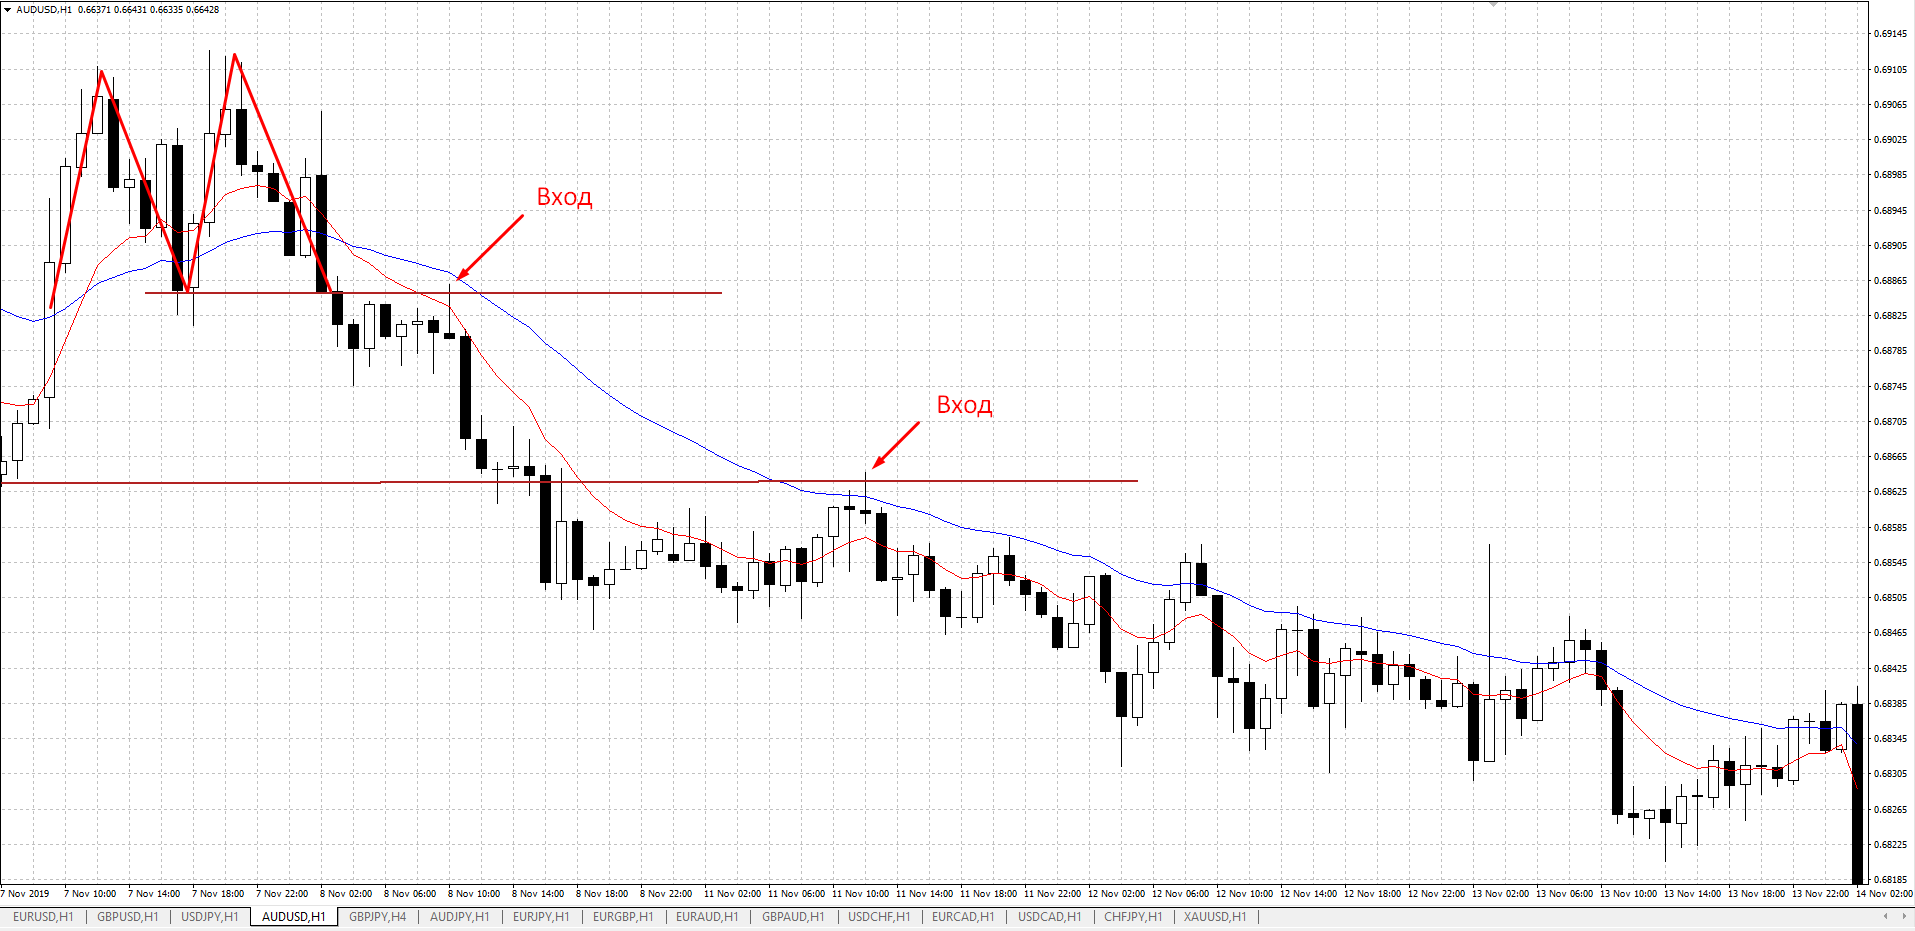
These examples are traded with the trend from a swing zone (one of the simplest and most effective techniques). After the breakout of the previous high/low, we wait for a retest to this area and the formation of a pin bar.
Ideally, it should look like it does in the picture. But we are in the financial markets; such ideal situations almost never happen here, like in a textbook.
This is the standard option for trend trading. But there are nuances here:
1) A pin bar is not always formed;
2) The correction can be deep, or it may be absent altogether;
3) Where should the stop be placed?
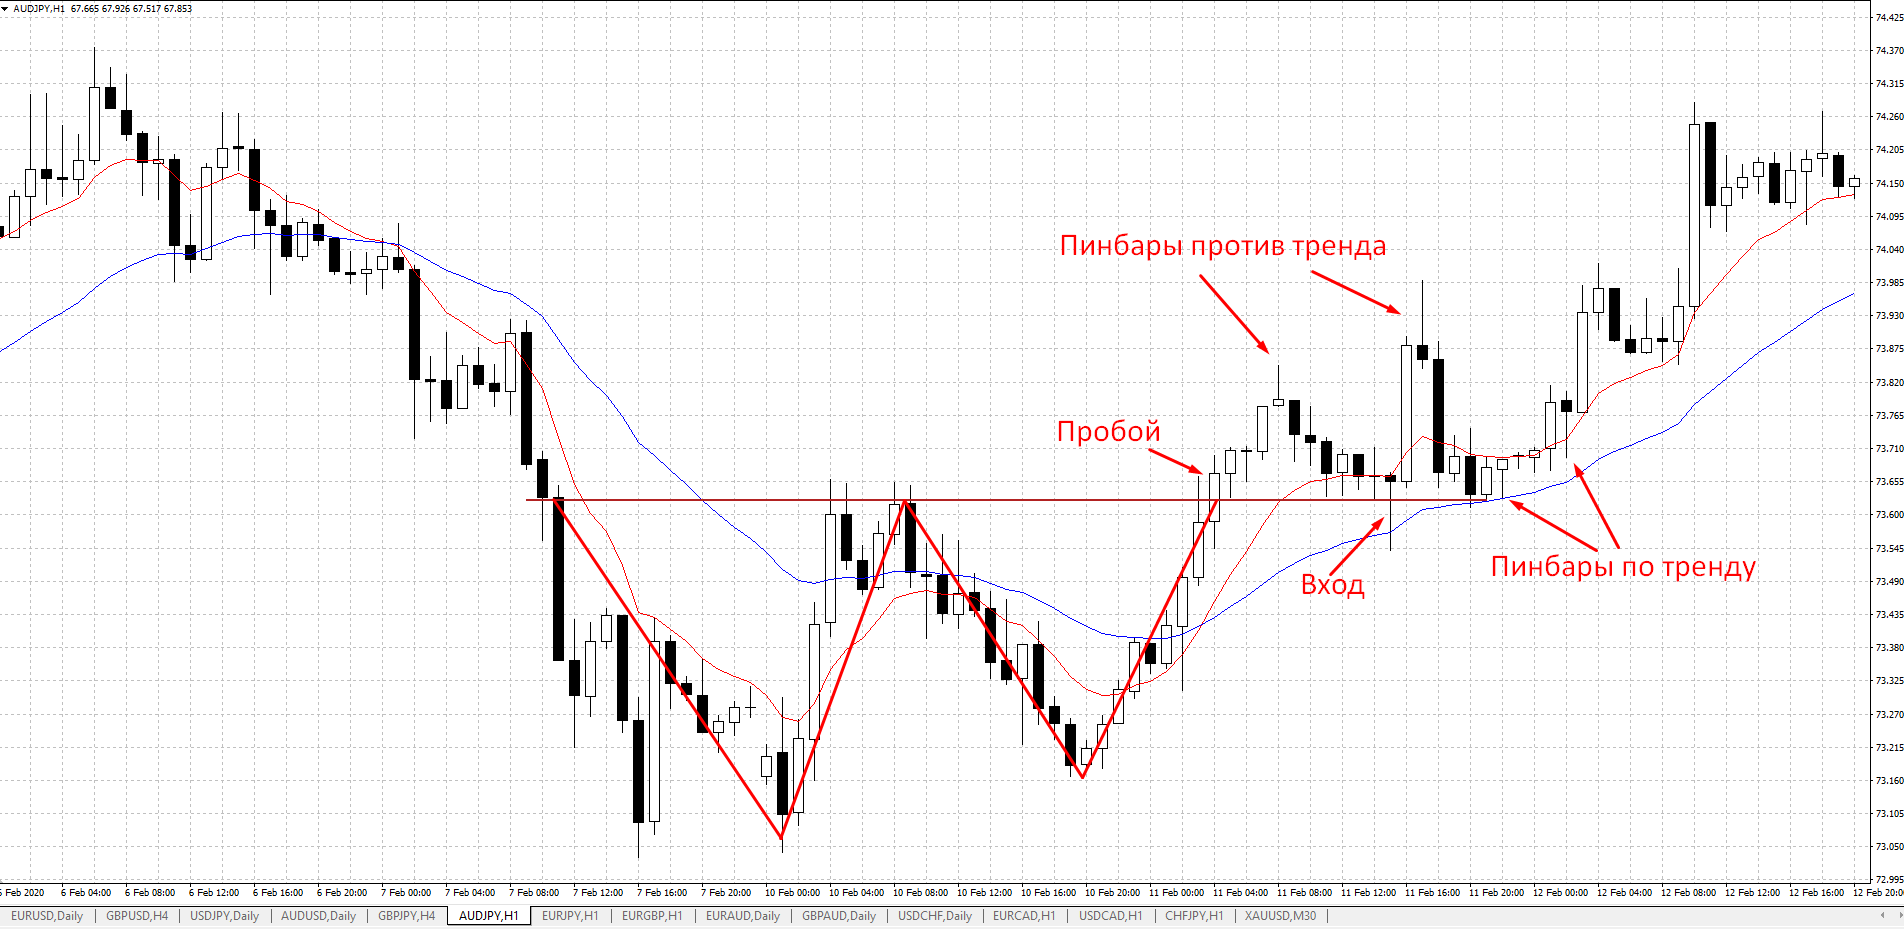
Over years of observation, I have identified a pattern that the most effective pin bars are formed after the breakout of the very first high/low.
Why do you need to look for an entry exactly in this place? Because we enter at the very beginning of the movement after the trend is confirmed. In this way, you can catch good moves while adding to the position, trailing the stop, closing in parts, etc.
Trading is an art, not an exact science. Here everything depends on your skill and accumulated experience.
Examples on the chart

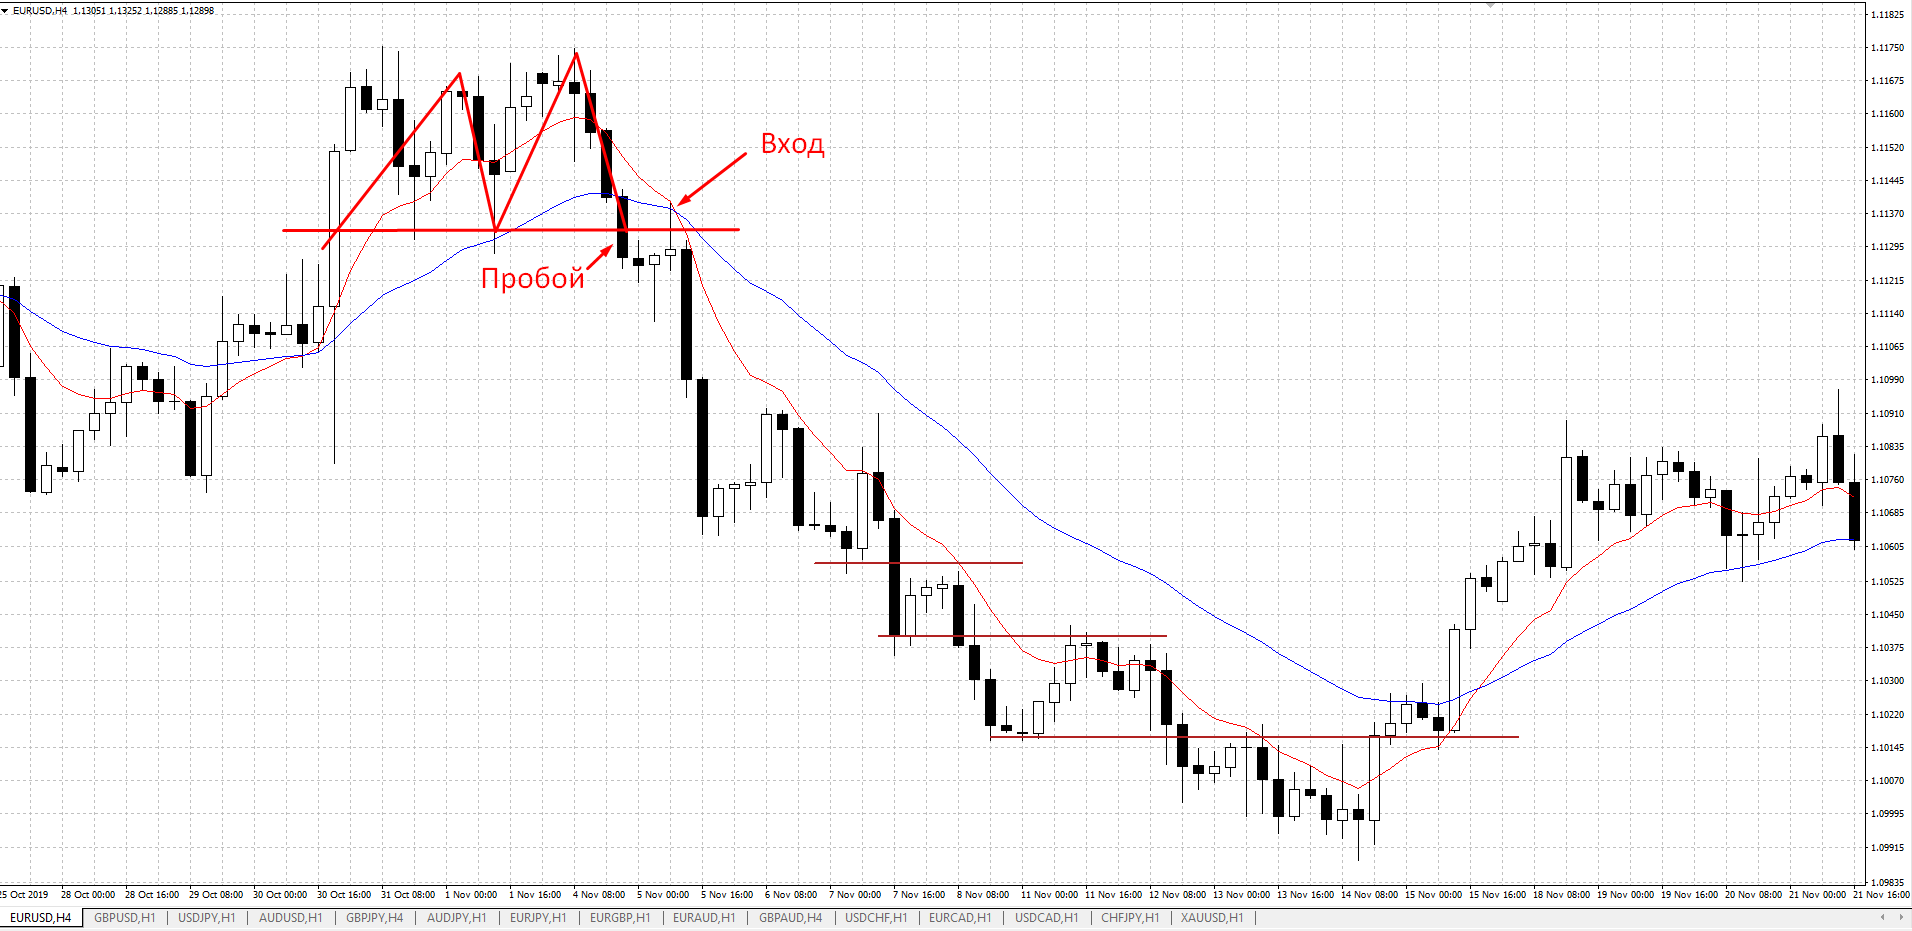
Where should the stop loss be placed?
The stop is placed behind the candle that breaks the level. Or behind the tail of the pin bar. There is no need to place the stop behind the pattern itself; this is excessive caution. With this approach, we destroy the possible potential profit.
Where should the take profit be placed?
1) The first target is the distance of the pattern itself. It is desirable to lock in part here, since the stop is placed behind the tail, not behind the pattern itself. Here you will already get a good ratio, and if desired the trade can be held further, adding to the position;
2) The second option is to multiply the pattern distance by 2 and take all the profit there;
3) The third option is to trail the stop through safe places as the price moves;
4) The fourth option is to take the R ratio.
Here, by and large, only the profit-taking techniques are simply varied.
The entry option uses the D1-H1 combination. The essence is that after assessing the situation and receiving a signal on the D1 chart, we move to the H1 chart to look for an entry point. The stop is used on the H1 chart, and we take targets on the D1 chart. This way we get a really good risk-to-reward ratio.
Examples of D1 Signals

1) Engulfing;
2) Pin bar;
3) SFP (a false breakout of the level).
D1 Engulfing
I watched this situation for quite a long time. The opportunity appeared only on January 3.
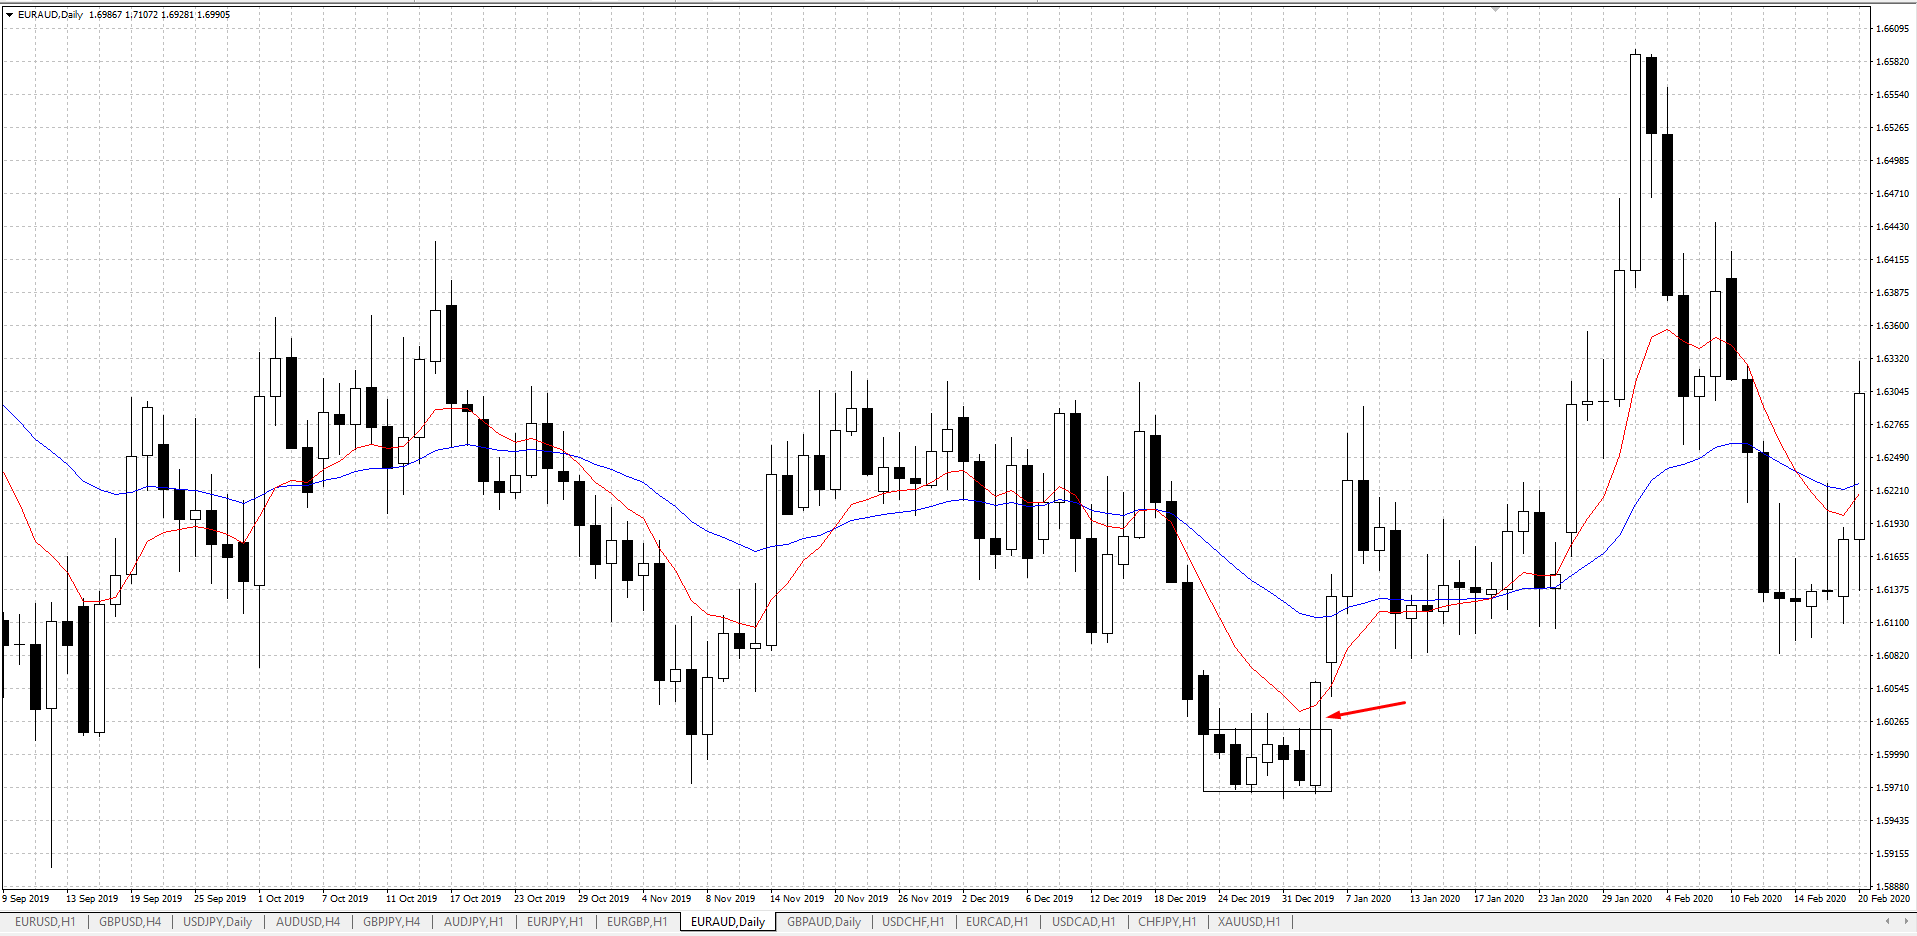
The price is moving in a downtrend, then enters a consolidation phase, forming a zone. Now we need to wait for the situation to develop and for one of the sides to be broken. The price comes out with an impulse, forming a bullish engulfing.
On the H1 chart it looks like this:
D1 Pin Bar
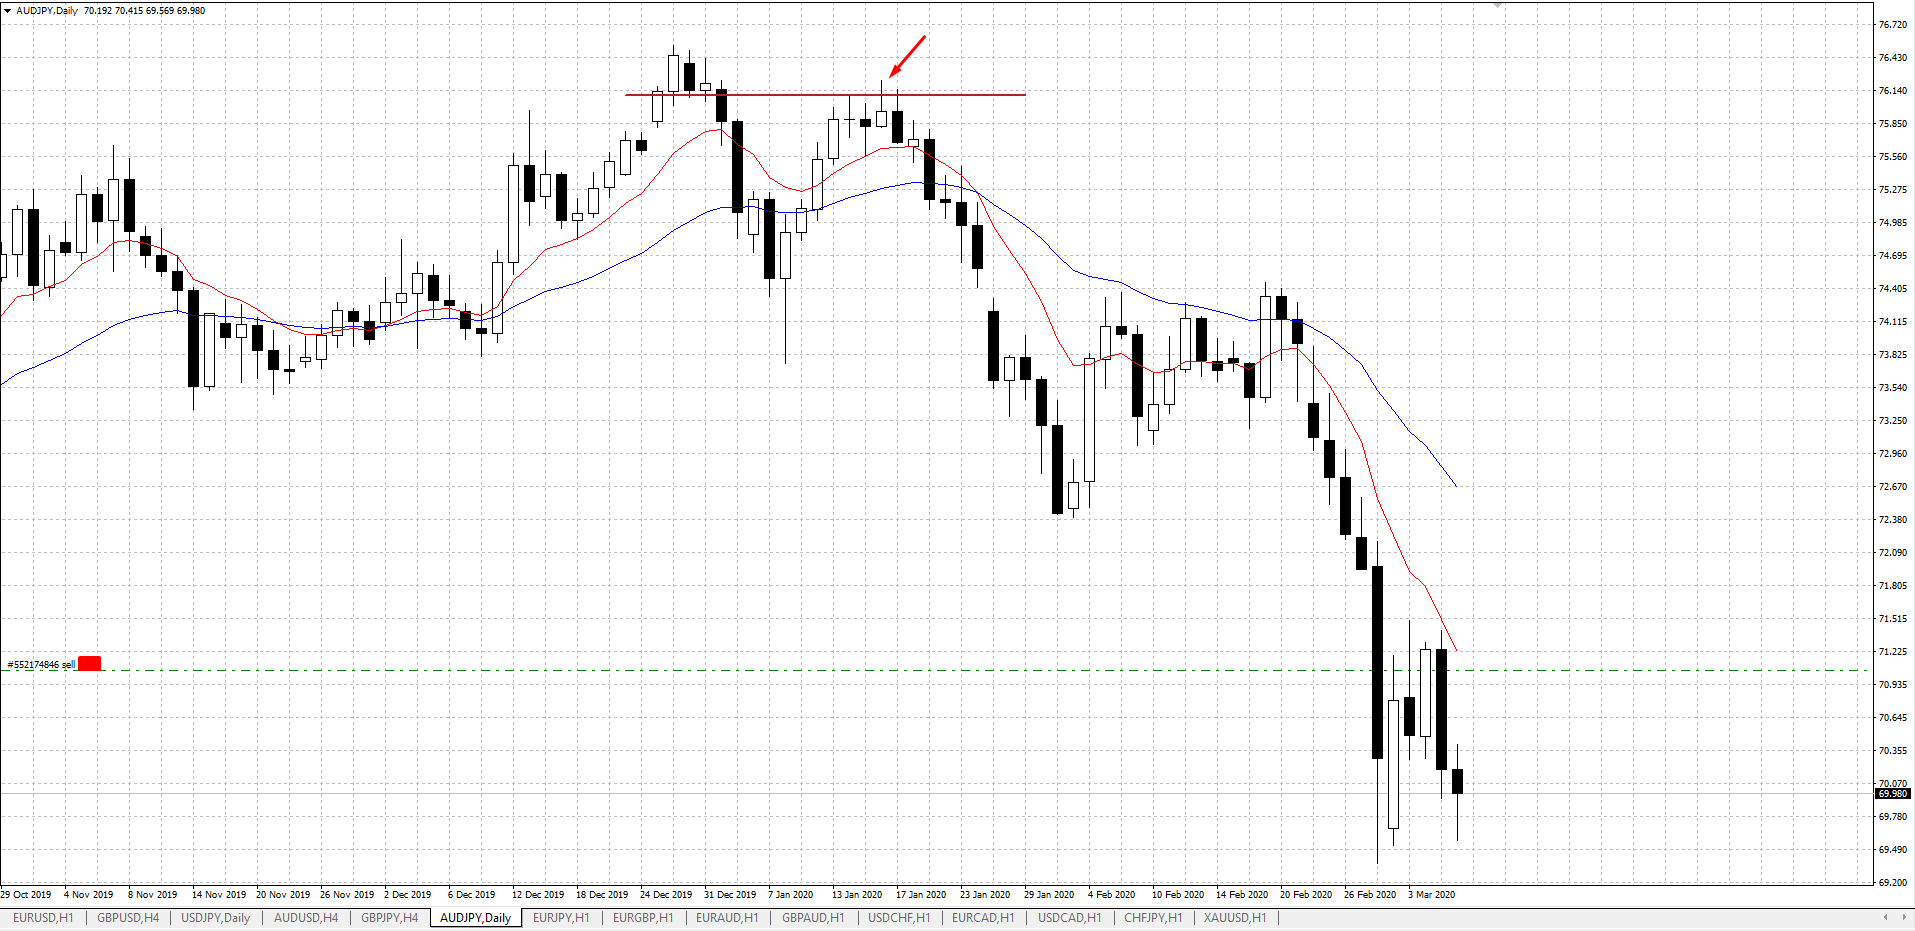
The arrow marks the pin bar that caught my attention. This pattern has support in the form of a zone.
On top of that, it was the frenzy caused by coronavirus, and it was clear that JPY would strengthen soon. After the next candle appears, it becomes clear that you need to pack your things and get ready to depart, the train is starting to move.
We move to the H1 chart:
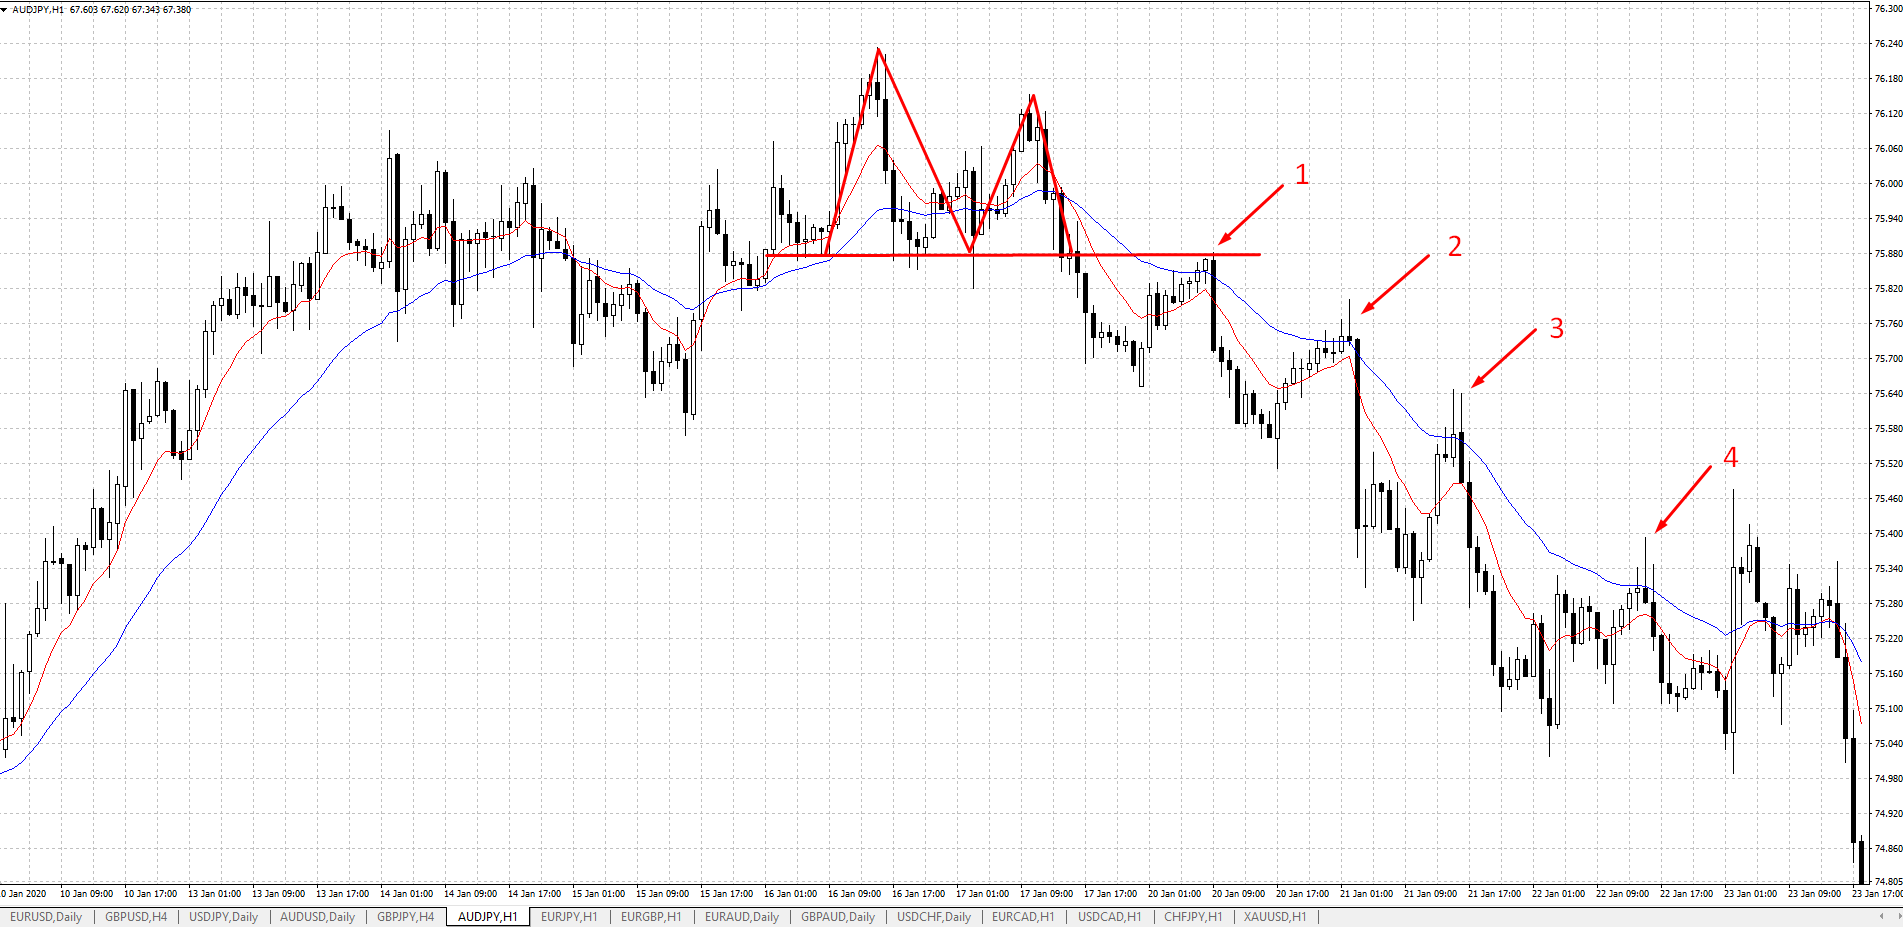
The first three trades worked out perfectly. The fourth, marked with an arrow, was closed by stop loss by the impulse of a bullish candle.
SFP (False Breakout of the Level) D1
Most often this is the price going beyond the level, coming back, and forming a spike (a classic trap for those who trade pending orders on a breakout).
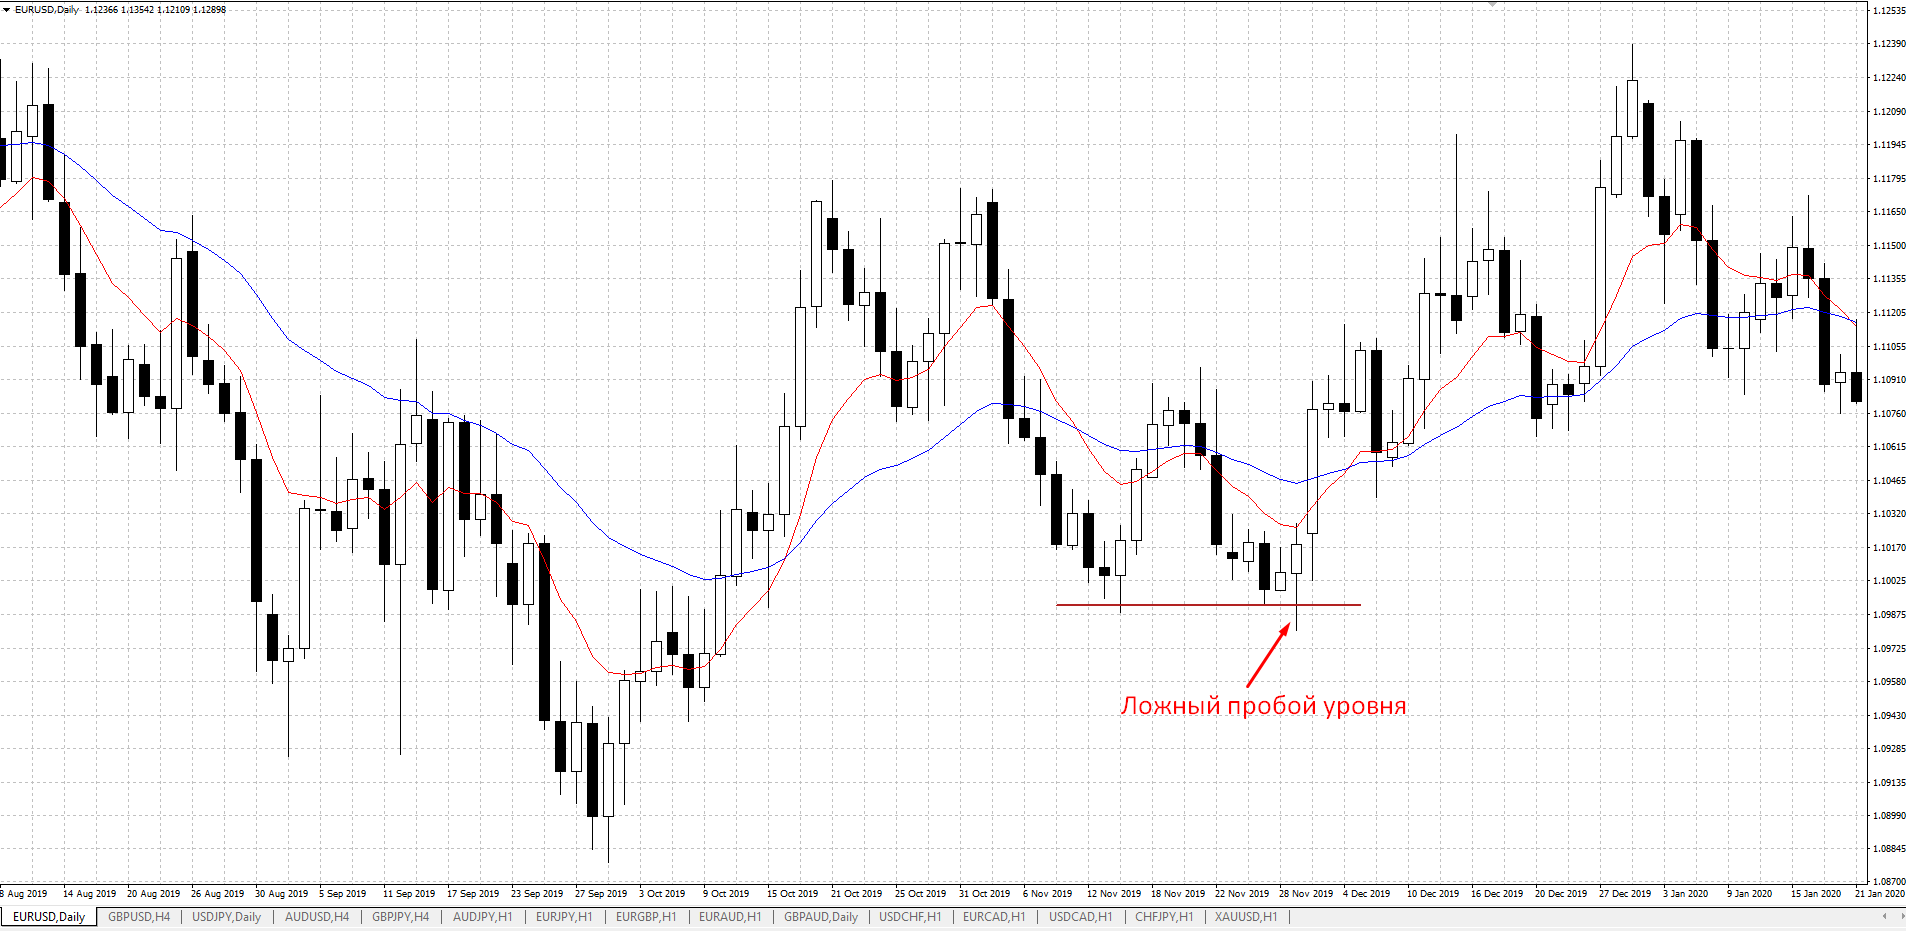
H1 chart:
A version of reversal pin bars from a level.
This is a classic described in all textbooks on technical analysis. It is often used by beginners, trading from a level that has no strength at all (put simply, it is not there).
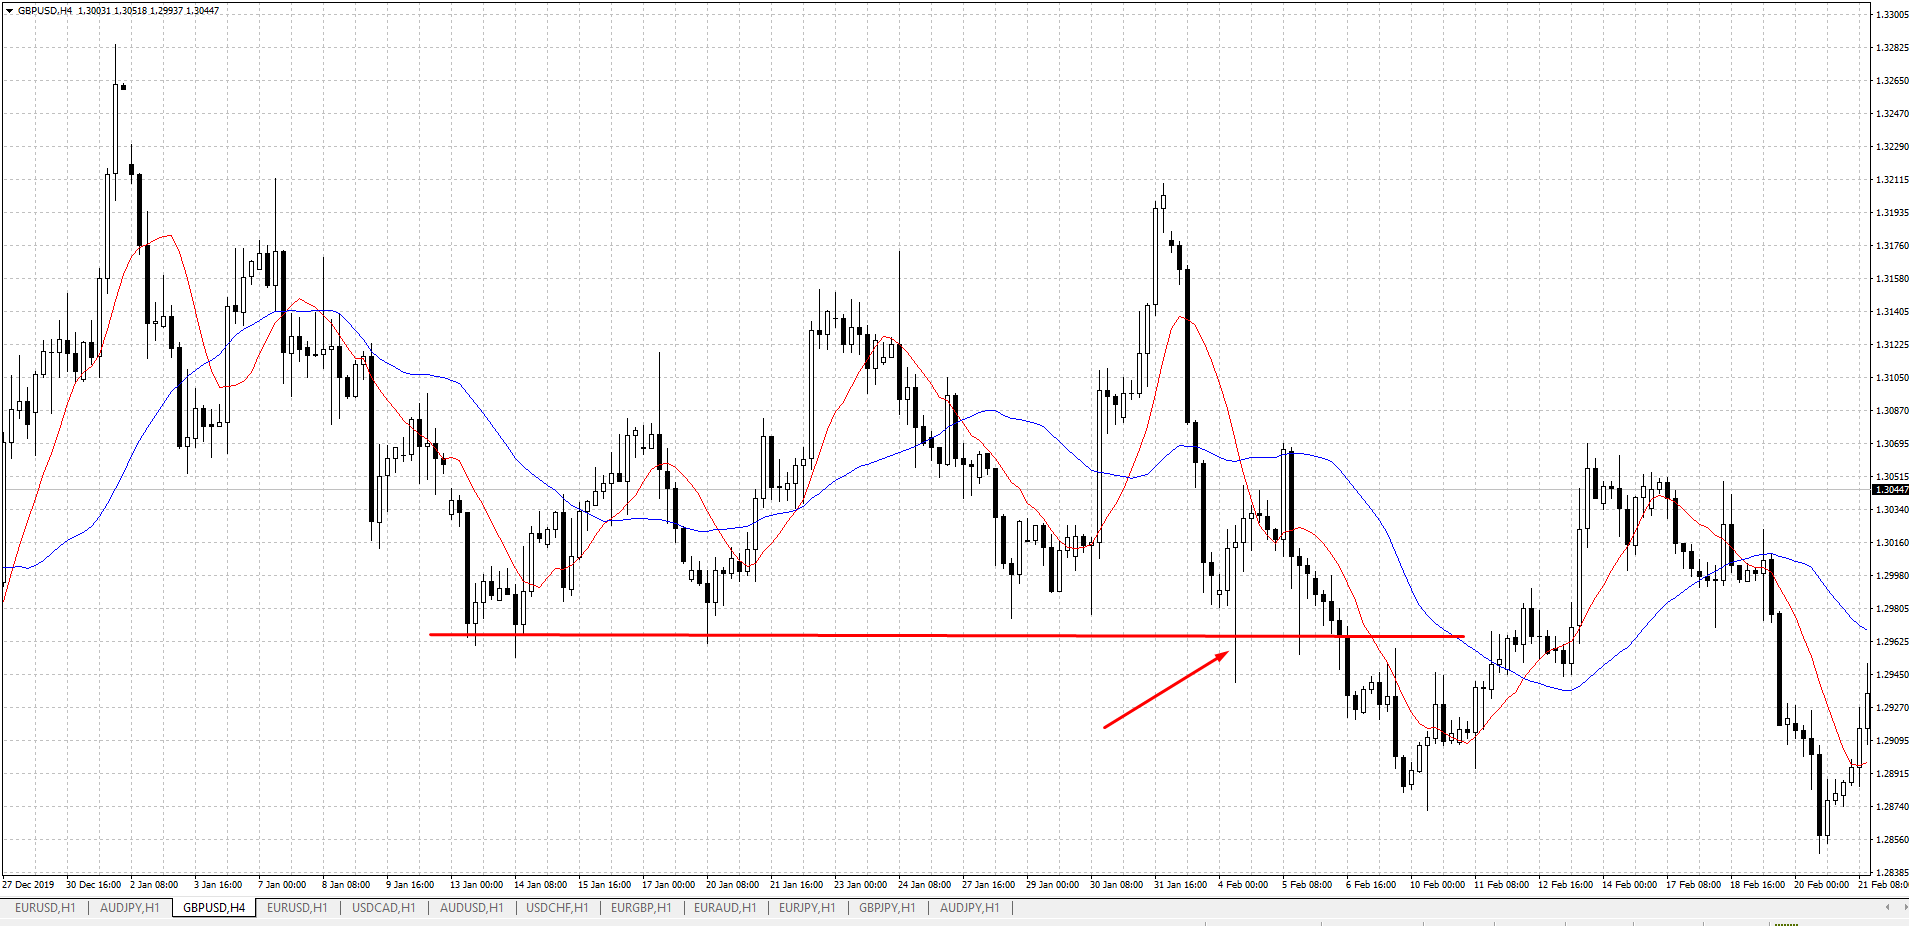
This is the most dangerous type of pin-bar trading, because we are entering against the trend and without confirmation. There is no need to think that if you drew some level, the market must magically reverse from it. But, of course, strong levels do work.
D1 chart:
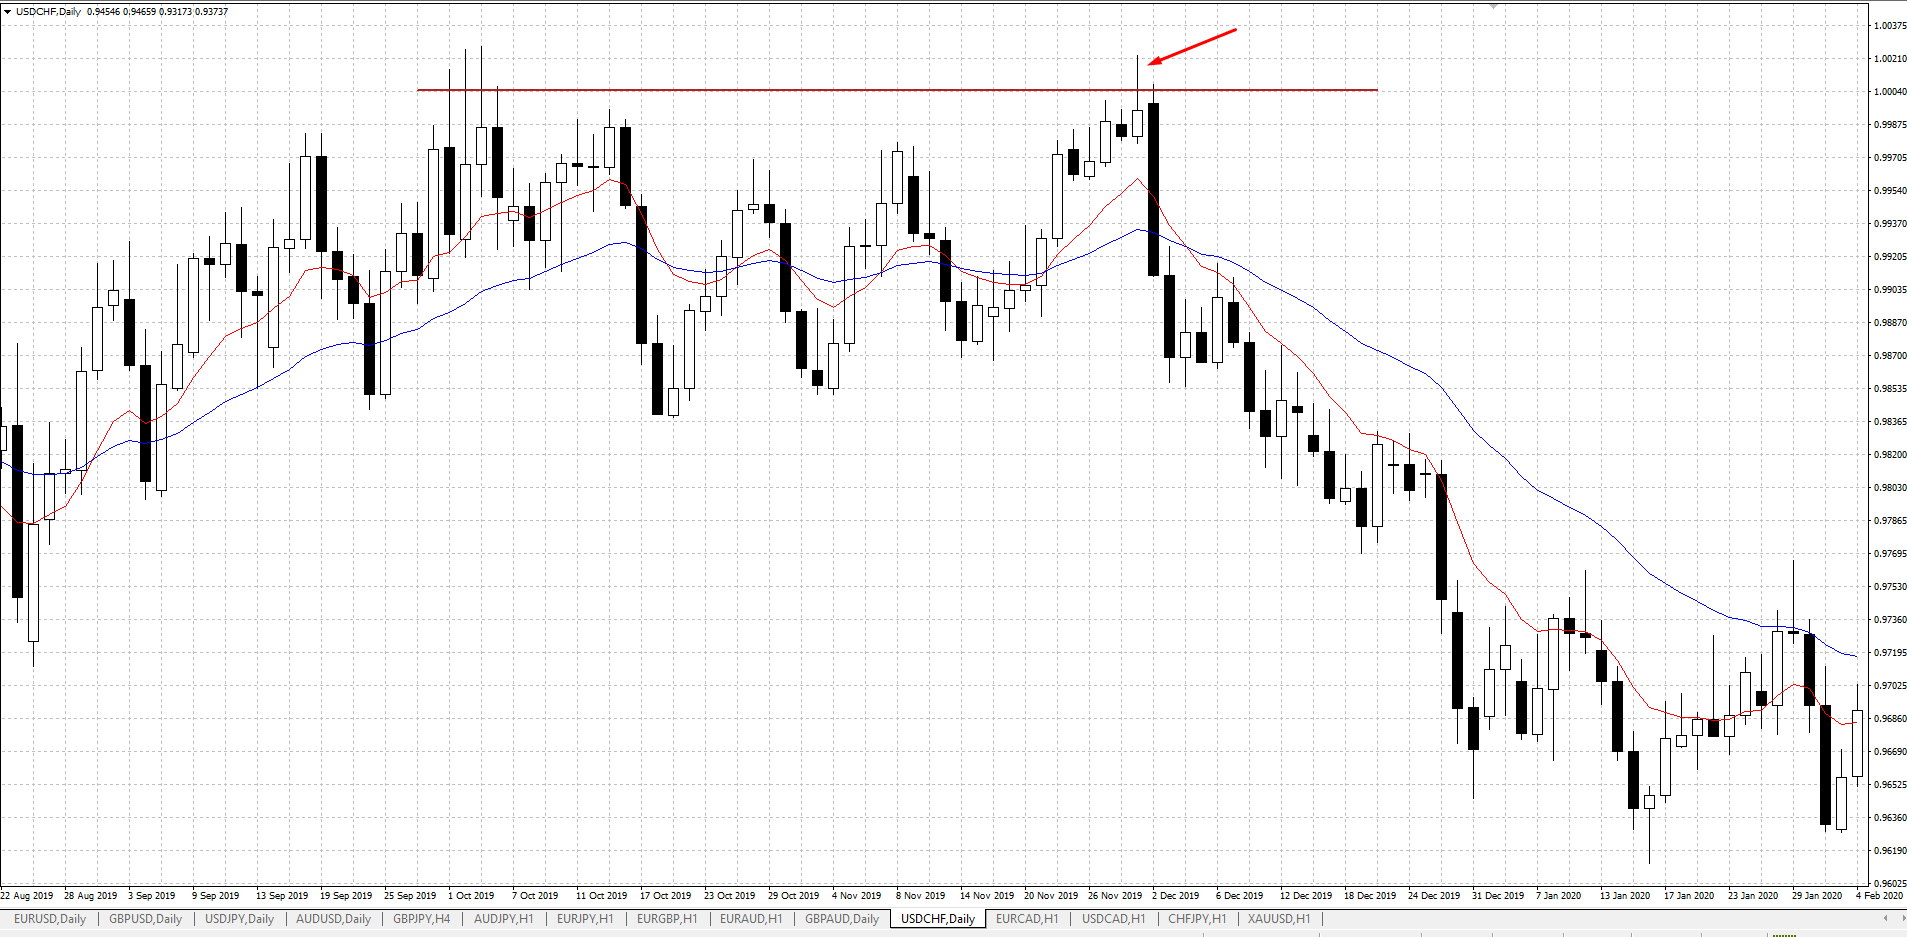
And here is an example of a pin bar that did not work, D1 chart:
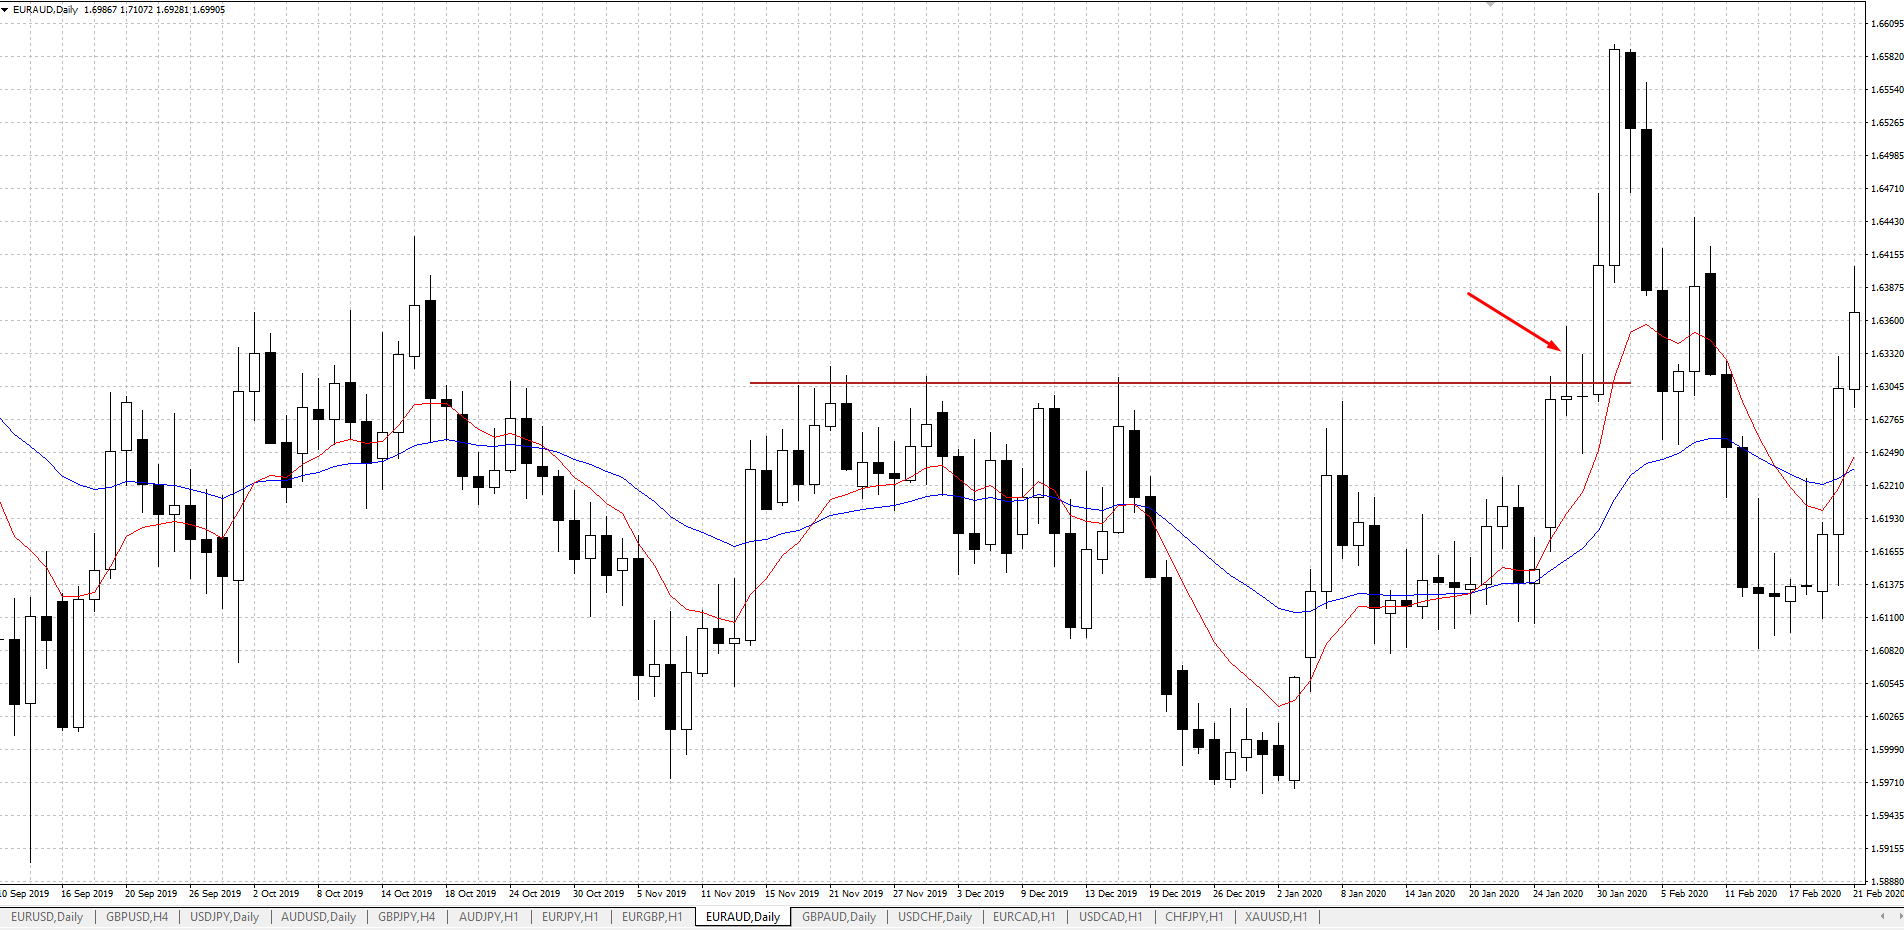
You should not pay attention to reversal pin bars at all except on D1 charts.
H4 chart:
H1 chart:
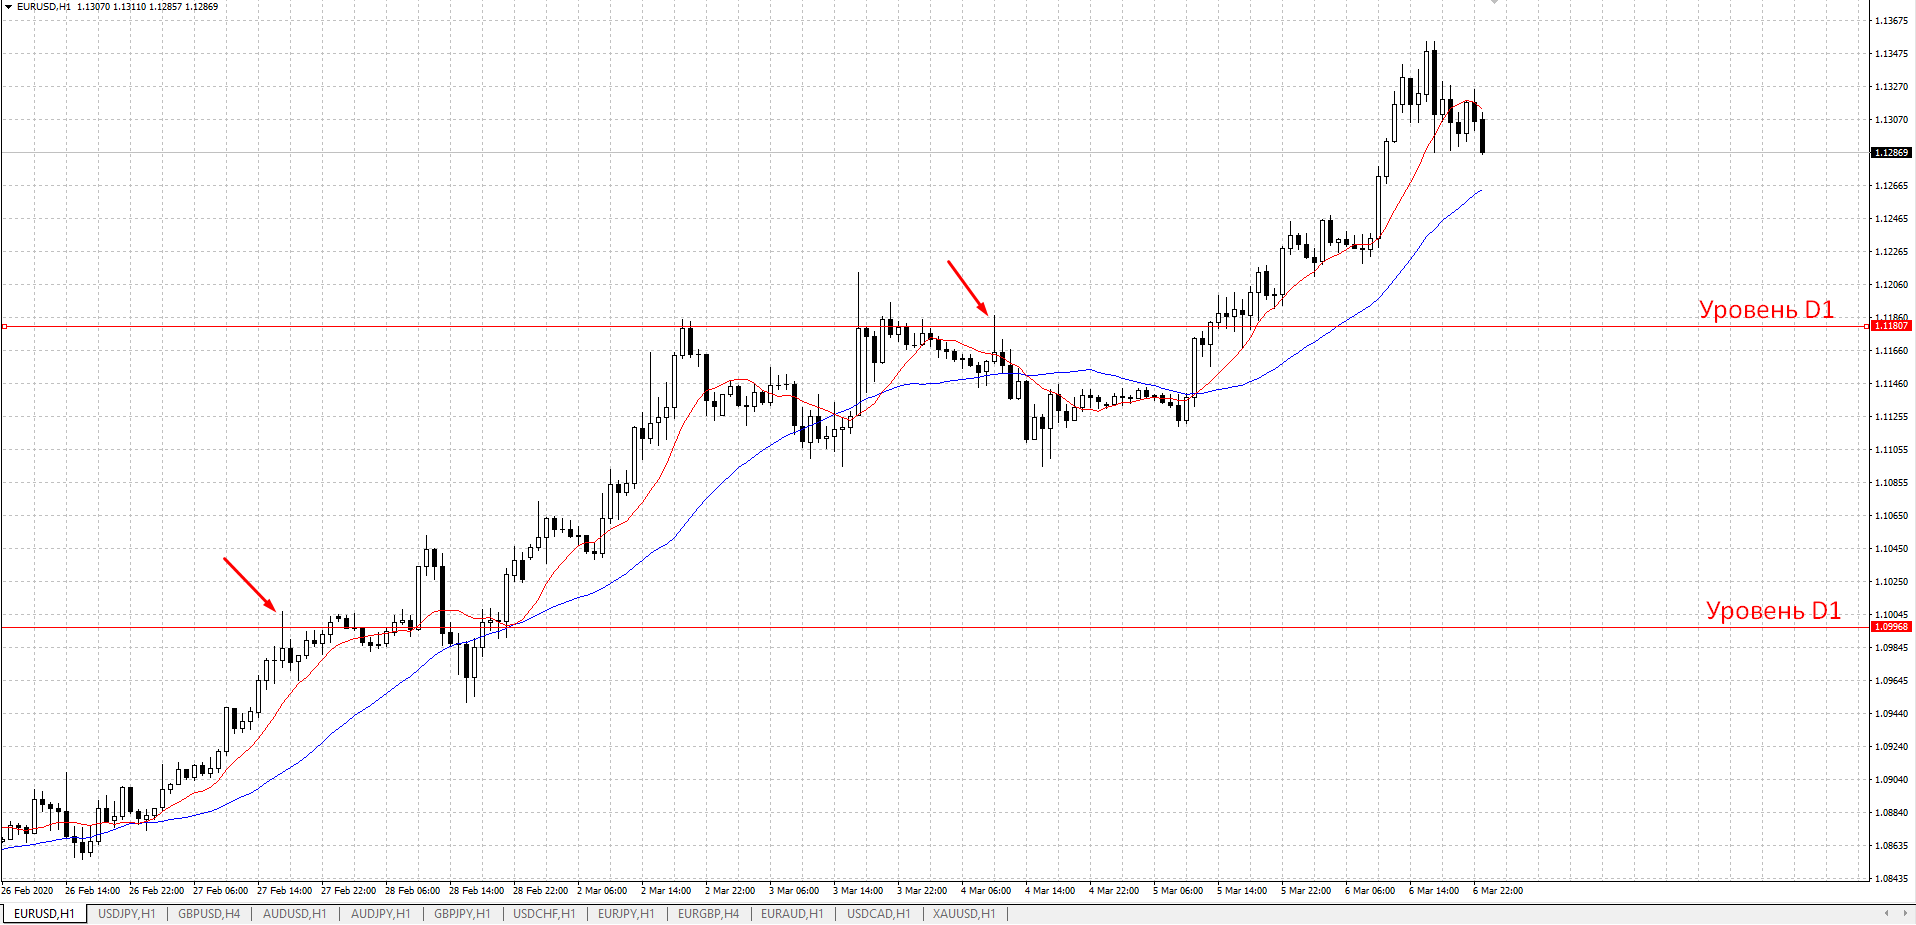
It is preferable and safer to use the reversal technique with confirmation and enter the newly formed movement. Especially this year, against the backdrop of increased volatility, levels are being broken left and right. And there is no guarantee of a reversal without confirmation.
You saw a strong level, drew a horizontal line. A pin bar appeared, excellent, but do not enter. Now you need to wait for the confirmations described above and enter the new trend that has formed. Otherwise you will keep getting burned many more times.
Conclusion

Pin bars are certainly a powerful tool that should be used in the context of market movement.
There are only two ways to practice this skill in the forex market:
1) Trade everything on 1-2 currency pairs - patterns/shapes/breakouts/impulses/levels, etc., etc.;
2) Trade 1-2 situations on a small number of currency pairs.
A specialist is a person who understands one area. It is impossible to be a professional in all fields. Find an appealing pattern for yourself and practice it in different market situations. After the sample you obtain, it will become clear where the pattern shows maximum efficiency and where it is better to refrain from trading it.
Being out of the market is also a trade that allows you not to lose funds as a result of an impulsive entry.
Sincerely, Vitaly Sokolov
Tlap.io
