
BTC and Pi: The Magic of the Pi Cycle Top Indicator

Bitcoin loves a good story. Halvings, cycles, Fibonacci, the golden ratio, logarithmic models—a whole culture of searching for mathematical patterns has long surrounded its price.
But the Pi Cycle Top indicator has a special story worthy of its own movie.
The indicator is based on just two moving averages—the 111-day and the 350-day. The ratio of these numbers turns out to be very close to π: 350/111=3.153, while π=3.141592.
Coincidence? Carefully selected parameters? A genuine pattern? Or do we simply love finding hidden meaning in beautiful numbers?
To understand it, we should first forget the mysticism and examine what the Pi Cycle Top indicator actually is.
What the Pi Cycle Top Indicator Is and How Traders Use It
A Brief, Plain-Language Explanation of the Indicator
Pi Cycle Top is a long-term indicator that helps identify an overheated Bitcoin zone and a potential bull-cycle top.
The indicator was created by analyst Philip Swift (Philip Swift) (his photo appears in the images below), who became known through the LookIntoBitcoin project. The indicator concept was published in 2019 in The Golden Ratio Multiplier.

The indicator later gained recognition in its own right and became one of the most widely discussed tools for identifying BTC tops.
The indicator is remarkably simple.
It uses two lines:
<p><strong>111DMA</strong>—Bitcoin's simple moving average over 111 days;</p>
<p><strong>350DMA × 2</strong>—the 350-day moving average multiplied by two.</p>
A signal occurs when the faster 111-day average rises above the doubled 350-day average.
Why might this indicate overheating, according to Philip Swift? Here is his explanation.
350 days is almost a year. The $350DMA therefore responds slowly enough to price changes to reflect the long-term trend, whereas the $111DMA is considerably faster. Under normal market conditions, there is a noticeable gap between the two lines. During a powerful bullish move, however, the price begins rising so quickly that the $111-day average accelerates and catches up with the doubled 350-day average. This creates a distinctive picture: the long-term trend is still far behind, while the current medium-term momentum has already become so strong that it exceeds the long-term trend twofold.
Thus, Pi Cycle Top effectively attempts to capture extreme market acceleration. The historical coincidence between such acceleration and major tops, in turn, made the indicator famous.
Calculation Details
Calculating Pi Cycle Top is fairly simple.
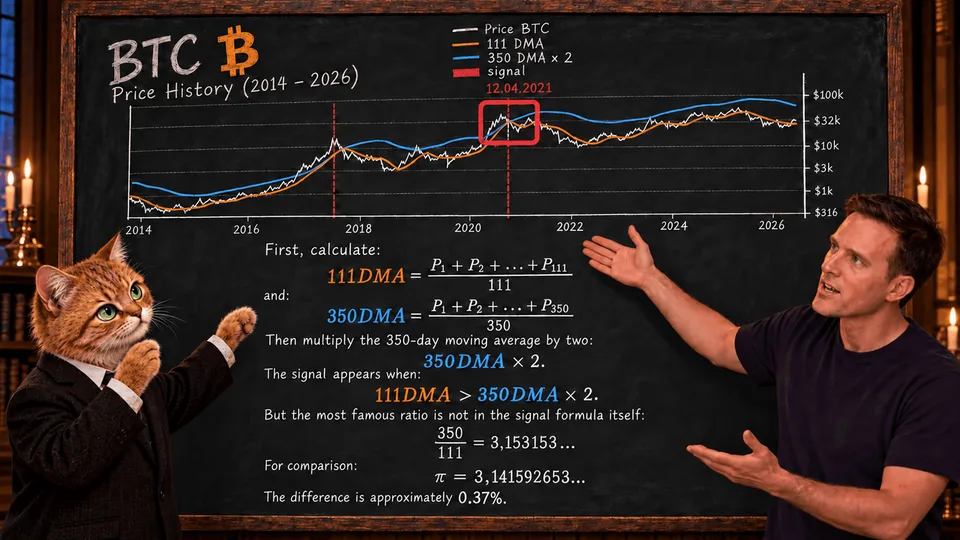
A trader should understand that multiplying the 350 DMA by two does not mean multiplying the number 350 by two. The value of the moving average itself is doubled. The periods remain 111 and 350 days.
Using the Pi Cycle Top Indicator
For a long-term investor, Pi Cycle Top is particularly interesting as a tool for managing profits already earned.
Using the Pi Cycle Top indicator is fairly simple. If:
<p><strong>the lines are far apart</strong>—there are no signs of such historically extreme overheating;</p>
<p><strong>the lines are rapidly converging</strong>—the market should be watched closely;</p>
<p><strong>the 111DMA touches, and especially crosses, the 350DMA × 2</strong>—a historically rare signal of extreme overheating appears;</p>
After the signal appears, a trader should look for confirmation of a reversal and decide whether to take profits partially or in full.
In any case, the final decision is best made with consideration for readings from classical indicators, MVRV, NUPL, and so on. Analyzing volume growth and the volume distribution profile is important. Monitoring the behavior of long-term holders, the Fear and Greed Index, and so on is essential.
Thus, Pi Cycle Top fits well as one element of a long-term decision-making system, but using it as the main element, let alone the only one, is clearly unwise.
Why the Pi Cycle Top Indicator Is Popular
Historically, during the early stages of Bitcoin's development, the crossovers really did occur very close to major highs. Swift himself wrote that in the previous three cycles (before 2019), contact between the 111DMA and the 350DMA × 2 coincided with Bitcoin's peaks within a few days.
This is precisely why Pi Cycle Top generated genuine excitement in 2020–2021.

From January to April 2021, traders literally tracked the distance between the two lines and tried to calculate when the crossover would occur. On Reddit, the discussion was no longer theoretical: some viewed the indicator as a way to reduce risk in advance, while others pointed to the small historical sample and the danger of fitting the model to past tops.
After the 111DMA touched the 350DMA*2 in April 2021, Pi Cycle's reputation grew even stronger, as Bitcoin did indeed correct sharply after the first top. However, the April 2021 top was only the first one: Bitcoin set a new high in November. The Pi Cycle Top indicator, meanwhile, gave no signal.
This is a good example of why Pi Cycle is better viewed as an indicator of extreme overheating, rather than as a mathematical oracle that reports the exact day of the final ATH.
Moreover, in the 2024–2025 cycle, the indicator again failed to generate a signal near the new all-time highs. Therefore, when analyzing Pi Cycle Top readings, one should not rely on its past reputation.
Today, Pi Cycle Top signals are best regarded as a warning of potential overheating and the likely formation of a late stage in the BTC cycle.
But let us return to the indicator's popularity. It has not gone anywhere. And one reason is its connection to the number π.
The Magic of π
Let us return once again to the story of how the indicator was created.
On June 17, 2019, Swift published the work The Golden Ratio Multiplier—Unlocking the mathematically organic nature of Bitcoin adoption.
In this work, he viewed Bitcoin not merely as an ordinary financial asset but as a network undergoing mass adoption. He therefore tried to relate its price dynamics to mathematical structures—the golden ratio and Fibonacci numbers.
It should be noted that Swift did not derive the indicator from any fundamental formula involving π. But in his work, he did draw attention to π himself.
Philip Swift wrote, almost verbatim: “350/111 equals approximately 3.153, which is very close to π = 3.142. [...] This is the closest approximation of π that can be obtained by dividing 350 by another integer.”
Swift goes on to say that the effective parameter combination turned out to be very close to π, and this coincidence gave the indicator its name. Thus, the connection to π is not a later invention of the cryptocurrency community.
And this is exactly where a technical indicator turns into an interesting story about the human love of beautiful numbers.
Then Came the Most Interesting Part—The Forum Discussions
After the idea was published, the trading community immediately began discussing the “magical” indicator.
In January 2021, Reddit user digitalmoneyguru published a post about Pi Cycle Top in r/Bitcoin and quoted the indicator's description along with the observation that 350/111 is close to π.
What followed was an almost textbook discussion.
User Blu3Biscuit questioned the indicator's statistical significance: a few matching tops constitute too small a sample to consider the model proven. He separately criticized the attempt to assign special meaning to 3.153 merely because it is close to π.
Another participant, auto_headshot, asked a perfectly natural question: “Why exactly 111 days?”
This very question proved awkward for the model's supporters. Participants noted that Swift himself gave no separate fundamental explanation for why 111 and 350 were chosen.
User nycastle offered the now-familiar interpretation: 111 is used because dividing 350 by 111 produces a number close to 3.14.
In other words, the forum virtually formulated on its own the part of the story that later became one of the most popular interpretations of Pi Cycle: 111 → because 350/111 ≈ π.
Meanwhile, skeptics pointed to another problem: if the parameters were selected after observing previous tops, the model might describe the past well precisely because it had been fitted to it.
This is the classic problem of overfitting—fitting a model to historical data.
When the Pi Cycle lines approached a crossover in spring 2021, the discussion became especially lively.
On Reddit, some users viewed the indicator as a way to reduce risk systematically. Others directly called it a model fitted to three historical data points.
In one discussion, DisastrousEntrance64 described Pi Cycle more as a “posthumous indicator,” meaning a model that explains what has already happened well but does not necessarily predict the future. User digitalmoneyguru, by contrast, noted that it was not about prediction but about methodical risk reduction.
Another participant, rayjensen, asked an extremely intriguing question: if π really matters, why not slightly change the moving-average periods to obtain an even more accurate approximation of π?
At that moment, the community moved from purely technical analysis to market numerology, which led to the creation of a new indicator, Pi Cycle Bottom.
Pi Cycle Bottom: When π Is Used to Construct an Indicator
Trader Dončić attempted to create an indicator for identifying Bitcoin bottoms.
He first tried using the same 350/111 pair. But it proved too slow for historical lows.
Dončić then changed the short average to 150 days and multiplied it by π. This produced a new slow average with a value of 471.

This is how the Pi Cycle Bottom indicator emerged: its parameters were not merely coincidentally close to π; π itself became part of the method used to construct the new model.
Pi Cycle Bottom used a 471-day SMA and a 150-day EMA with an additional coefficient of 0.745. This coefficient was empirical—that is, it was selected to match historical lows.
And this is where an entirely new chapter of the story begins.
From Pi Cycle Bottom to True “Number Magic”
An even more revealing experiment appeared in 2022.
Author Matthew Monkan openly wrote that he had experimented with Pi Cycle Bottom's parameters and was effectively trying to fit numbers to historical lows.
He proposed an alternative construction: 409/130≈3.146. Then another: 550/175=3.142857. The latter value is already extremely close to π.
The author himself wrote with complete candor that he had “toyed with numbers to backfit” (“played with numbers for backfitting”). In other words, he simply experimented with numbers, fitting them to historical data.
The Infinity of π
The conclusion of this entire story is fairly commonplace, yet expressed in the finest Kabbalistic spirit: there is no longer any need to wonder whether the “magic of Pi” exists; one need only search for and find this number.
If you allow yourself to change:
<p>the fast average's period;</p>
<p>the slow average's period;</p>
<p>the type of average;</p>
<p>the multiplier;</p>
<p>the crossover condition;</p>
then an enormous number of combinations can be tested, and among them there will inevitably be some where A*B≈π. One can then select a combination that matches historical tops or bottoms well.

This produces a closed loop: market → parameter search → beautiful number → new theory → new model → search for confirmation.
This does not mean that all such indicators are useless. But it does mean that their predictive power is inherently weaker because it is based on “number magic,” not regressions of market parameters.
Conclusions
People love searching for magic in numbers. That was true long before Bitcoin. And it will most likely always be true. But there remains an enormous difference between a mathematical construct and magic.
Mathematics truly describes an enormous number of phenomena in the world around us.
The number π is one of the best examples. It appears wherever we deal with a circle: c=2πr (π relates a circle's circumference to its radius). From this comes the area of a circle: S=πr2. The radius can be determined from the circumference, and so on.
The number π appears in geometry, trigonometry, physics, engineering, statistics, and many other fields.
It is therefore unsurprising that someone seeing 350/111≈3.153350 and
π≈3.142 would wonder: could there be some meaning here?
In the case of Pi Cycle Top, this question is especially interesting because behind the beautiful number stood an indicator that did work on historical data.
But the past pattern described by Pi Cycle Top does not prove that Bitcoin obeys π. Nor does the proximity of 350/111 to π prove that π itself causes Bitcoin's behavior.
The Pi Cycle story does, however, show something else.
Mathematical constants really can be used to create market models. You can take 350/111≈3.153 and build an indicator. You can take 150×π≈471 and build another. You can experiment with other ratios, multipliers, and combinations. And some of them may indeed prove useful.
It is interesting to watch how two moving averages gave rise to a story about π, followed by an entire family of Pi indicators and a genuine market mythology surrounding them.
Is there magic here? Everyone can decide for themselves. But the chart, formulas, and numbers are right here before us—and perhaps that is precisely why the magic of numbers remains so compelling.
Disclaimer
The Pi Cycle Top indicator is a technical analysis tool and does not guarantee accurate identification of a BTC top or the future direction of its price.
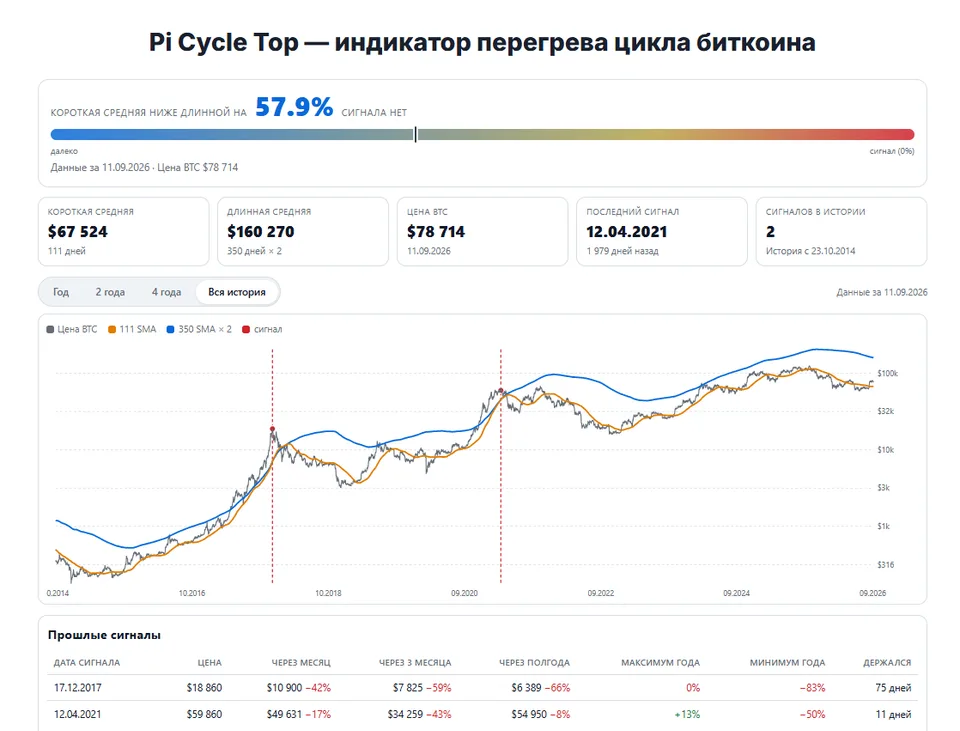
The indicator's historical matches with BTC highs do not mean that a similar signal will work in future market cycles. Moreover, Bitcoin's subsequent history has already shown that the indicator may not coincide with the cycle's final top.
Pi Cycle Top should not be used as the sole basis for buying, selling, or opening short positions. When analyzing Bitcoin, it is advisable to consider it alongside other technical, on-chain, and market indicators.
This material is exclusively educational and journalistic in nature and does not constitute individualized investment, financial, or trading advice.
Decisions concerning cryptocurrency transactions must be made independently, taking into account one's own objectives, financial circumstances, and acceptable level of risk.