
Pair Trading in Forex
 Good afternoon, friends!
Today we will touch on such a topic as pair trading.
Do you know what strategies hedge funds use? How can you earn regardless of market direction with minimal risk to your deposit? The answer lies in the use of so-called market-neutral strategies. A special case of such a strategy is arbitrage. But unlike classic arbitrage, the use of which is available only to a limited number of people, statistical arbitrage, of which pair trading is a variety, is available to absolutely all traders.
In this article, we will discuss how to find statistical relationships, what tools need to be used for this, and what potential this method has against more traditional single-currency trading.
Market-Neutral Strategies

The neutrality of a strategy in relation to the market means that the profitability of the strategy does not directly depend on the direction of price movement of an individual instrument. This is achieved by creating a hedging position between two or more instruments whose profits and losses compensate for each other.
One of the main characteristics of such a strategy is minimal risk, since we exploit low-level market relationships. Such strategies include, for example, market making and arbitrage. However, unlike classical arbitrage, statistical arbitrage does not imply obtaining risk-free profit.
In terms of statistical arbitrage, the main task is to create a market-neutral portfolio. To achieve the effect of neutrality, the portfolio should consist of highly dependent instruments, roughly speaking, so that the growth of one compensates for the fall of the other. That is, we must create a kind of closed system where funds are redistributed between the instruments of the portfolio. Pair trading is a special case of statistical arbitrage and the most popular strategy of this type.
Pair Trading

Pair trading means the simultaneous opening of positions on two interrelated instruments. The relationship is usually determined by their correlation coefficient. The most popular way to assess the relationship between two time series is to calculate Pearson correlation. The stronger the correlation of the instruments, the greater the probability of their movement in the same direction.
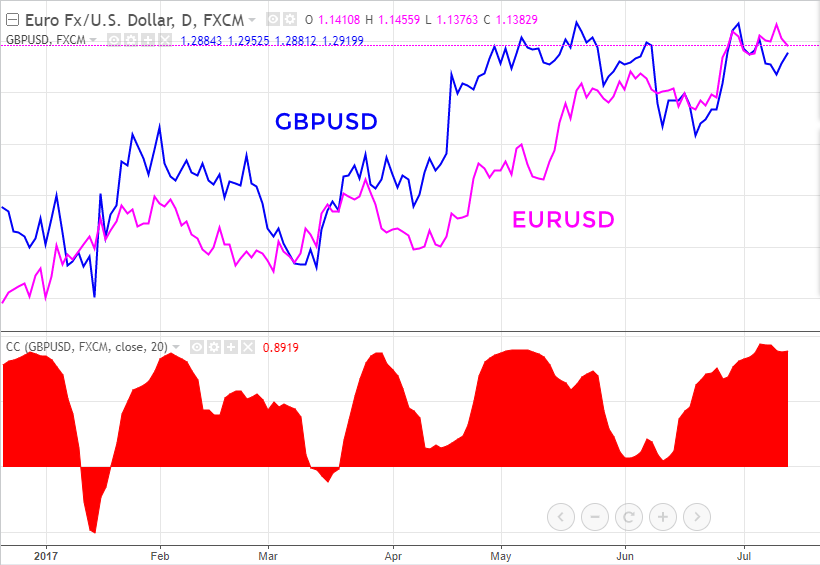
At the same time, there is both positive and negative correlation. In the first case, the instruments move in the same direction. Example: GBPUSD and EURUSD.
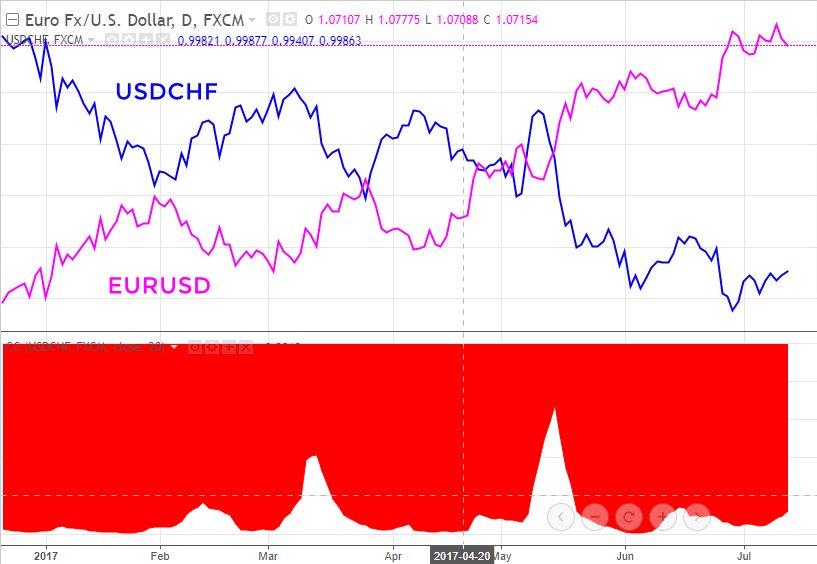
 With negative correlation, the instruments move in opposite directions. Example: EURUSD and USDCHF. Both cases are examples of a strong dependence.
 In pair trading, the pair's spread is traded, that is, the difference between two instruments. Since we know that the instruments move in the same direction, it means that after the next divergence they are highly likely to converge again.
The easiest way to illustrate trading by the pair trading strategy is on the basis of the EURUSD and GBPUSD pair. Thus, when the spread (difference) between the two instruments expands to a certain threshold, we buy the lagging instrument and sell the leading one. When the instruments converge again, we take profit.
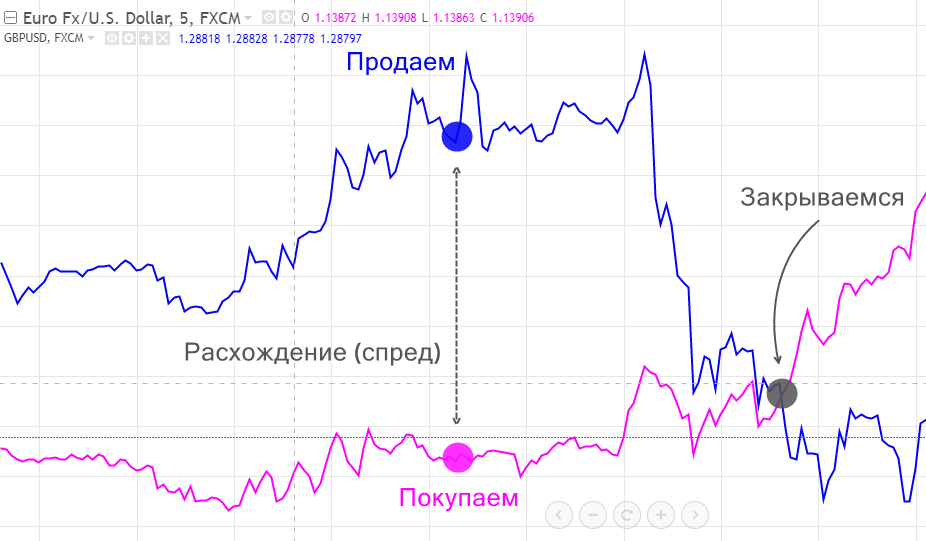 The size of the threshold divergence is determined by a statistical method, by analyzing the history of past divergences. For example, it may be the average divergence over the last year.
As a result, it is absolutely unimportant for us in which direction an individual instrument goes. What matters to us is that they converge, that is, their spread returns to zero. At this moment we take profit equal to the size of the divergence.
For such a strategy to be profitable, there must be a constant relationship between the instruments. EURUSD and GBPUSD have a fairly strong positive correlation. However, this dependence is not constant, which is why the pair can diverge by a very large distance and not converge back.
In essence, trading the EURUSD and GBPUSD spread is analogous to trading their cross, EURGBP.
If the pair had a constant strong correlation, EURGBP would always be in a flat state. However, the dependence periodically breaks down, which is why trends are formed.
Building a Spread Chart

Now let us move on to the practical part: building the spread of two instruments. To calculate the spread between two instruments, we will use the TradingView service.
There are different ways of calculating the spread, slightly differing in the final result. Which one exactly should be chosen is a matter of individual preference. The easiest way is to calculate the spread by the difference. That is, the spread formula for EURUSD and GBPUSD will look like EURUSD - GBPUSD.
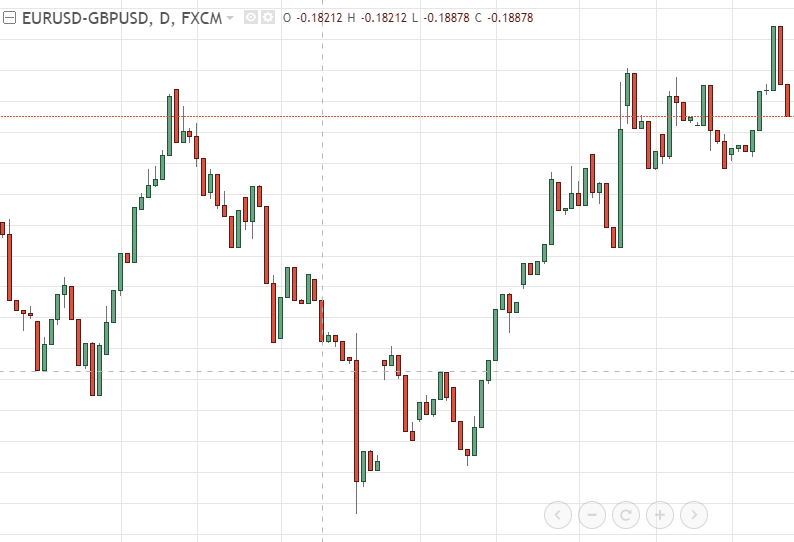 You can also build the spread by ratio, for example, EURUSD / GBPUSD. It should be kept in mind that the resulting signals may differ depending on the chosen method, but they do not carry any fundamental difference.
Next, it is necessary to decide at what moment to enter the position. The task is to enter the market when the spread expands strongly, that is, when the relationship between the instruments is temporarily lost. A strong spread expansion is an expansion greater than average. Therefore, a good indicator for entry can be the difference between the spread chart and the moving average.
Thus, we get a spread oscillator. Trading such a spread is extremely simple. When the line enters the overbought zone, that is, the spread has deviated strongly from the average, we sell the spread; when it enters the oversold zone, we reverse the position.
In this case, to buy the spread, you need to buy EURUSD and sell GBPUSD. To sell the spread, everything is the other way around: we sell euros and buy pounds.
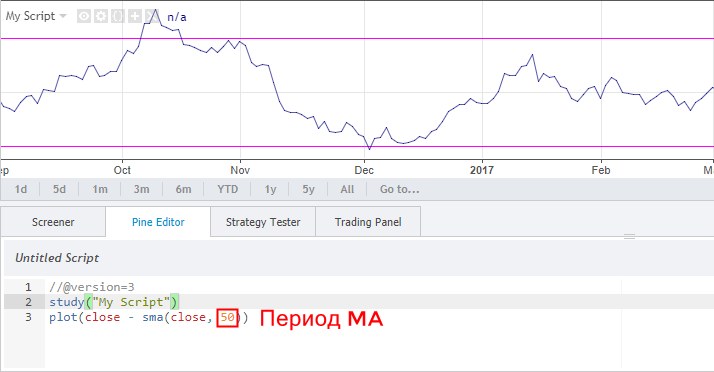
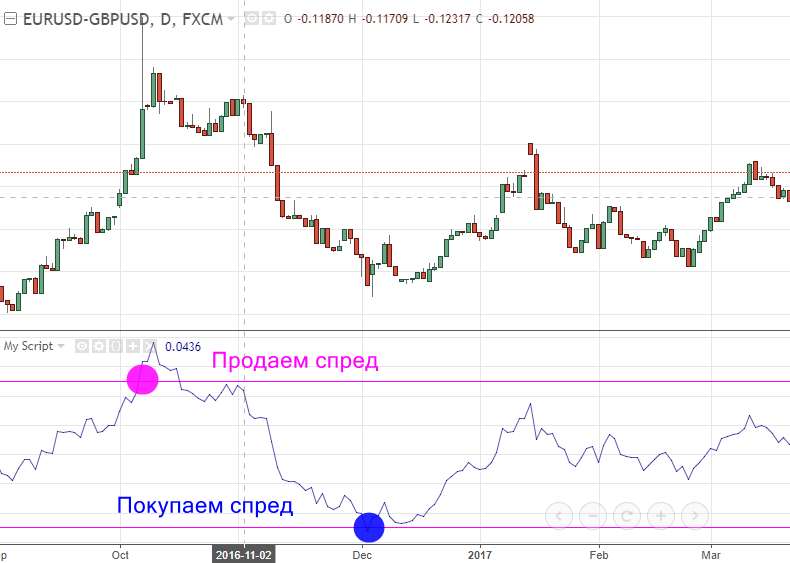 To build such a chart, you need to go to the "Pine Editor" and add the line "plot(close - sma(close, 50))". That is, we subtract the moving average with a period of 50 from the current closing price. To add the oscillator to the chart, click "Add to Chart".
 Another method is trading the spread from the boundaries of the Bollinger channel. To do this, it is enough to add the Bollinger Bands indicator to the chart of the built spread. In this case, crossing the boundaries of the channel will also indicate a significant deviation of the spread from the average.
Calculating Order Size
 Another important point is the correct calculation of the size of orders for a paired position. It is logical to assume that the two orders should be of equal volume, which means it is enough to open two positions with the same number of lots. But it is not that simple. If we calculate the divergence of instruments in points, then we assume that points are equal for both instruments.
In fact, to balance the positions, we need to take into account the different pip value of the two instruments relative to the dollar. You can find out the pip value of a currency pair through the pip value calculator.
Suppose you want to open a paired position on EURUSD and USDJPY. The pip value for EURUSD is 1$. The pip value for USDJPY at the moment is 0.87788$. Thus, to equalize the position sizes, the volume of the USDJPY position should be 1.14 times greater than the volume of the EURUSD position (1 / 0.87788).
Conclusion

The most important part of the pair trading strategy is the correct selection of instruments for trading. You need to understand that the strategy itself is not a holy grail, but with the right selection of correlated assets it is capable of giving stable profit with minimal risk. If you want to begin studying statistical arbitrage, you should definitely start with pair trading.
Respectfully, Alexey Vergunov TradeLikeaPro.ru
