
Liquidity positioning: how to find an entry into a price impulse

Catching a price impulse is every trader's cherished dream. Who would enjoy waiting for profit while stuck in balance, or a long wait for take profit after a correct entry?
The answer is obvious: no one. We all want to get profit as quickly as possible and preferably as much as possible. And for most of us, "quicker" comes first.
In this article I will show a simple but very reliable way to identify an entry into an impulse from balance. In my opinion it works always (by "always" I mean statistical significance at the 0.05 level).
Let us go!
What a price impulse is in simple terms
An impulse is a rapid price change with flat and short-lived pauses at the extremes. A directional shift of the value area takes place, in which the first thrust is not traded through.
In fact, a transition into an impulse implies a strong predominance of demand during northward expansion or supply during southward expansion.
In other words, the market orders responsible for the move do not encounter a sufficient number of limit orders. At the same time, the volume of market orders in the direction opposite to the impulse is insufficient to absorb the limit orders aligned with the impulse.
Key signs of an impulse within classical technical analysis
- Large bars/candles: one candle or a series of candles is noticeably larger than the timeframe average (wide range).
- Sharp change in volatility: ATR and other metrics are rising.
- Change in market structure: a breakout of support/resistance levels, key trend lines, the formation of new highs/lows.
- Oscillators: RSI/MACD/stochastic show strong acceleration (though overbought/oversold conditions may also appear).
- Clear directionality: impulse waves usually have few "extra" pullbacks, the move is clean and fast.
Impulse from the point of view of volume structure
A good impulse wave, as a rule, consists of three expansions (it has at least 2 flat loading areas). In very strong moves there may be more expansions of this kind, but usually after the third or fourth expansion a transition into balance begins, which may lead either to a reversal or to a volatile continuation of the main dynamic.
From the point of view of technical analysis, in an impulse the pullback is limited to 23.65% or no more than 38.2% by Fibo. At the same time, during clear positioning when exiting balance, momentum indicators are often in the overbought / oversold zone, that is, they give false signals.
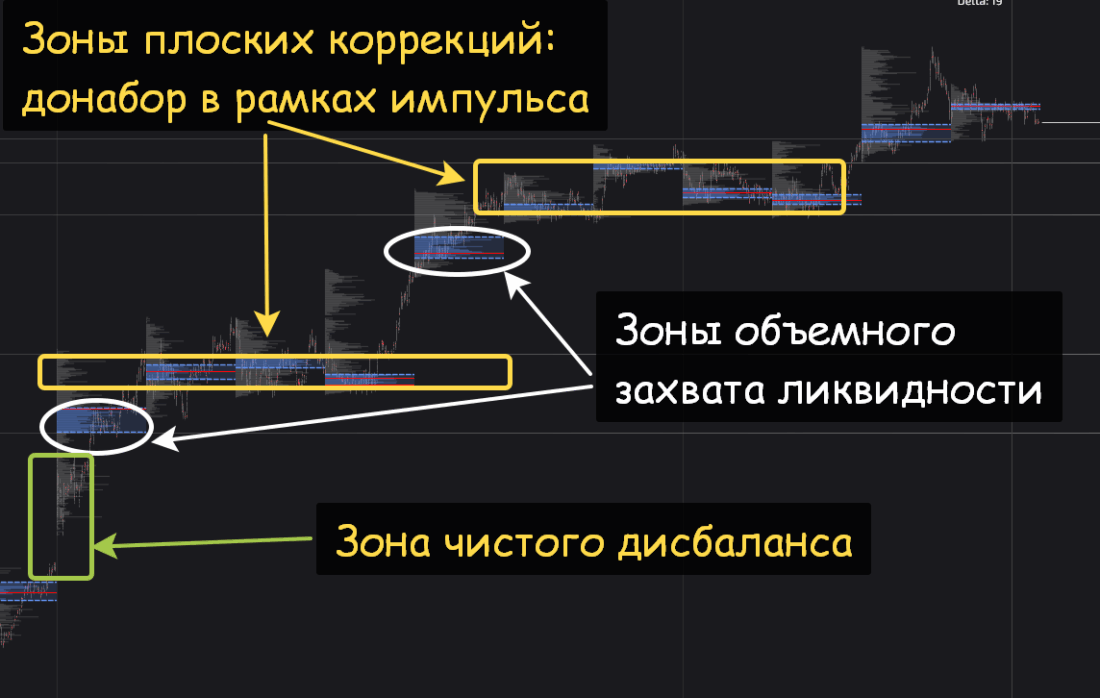
The picture above shows such an impulse. After the first expansion there is a liquidity-capture zone, above which volume accumulation in the flat began. The second expansion has the same appearance. And only the third expansion is clearly weaker: one may assume a return to accumulation slightly below through a local double top with trading down to the second liquidity-capture zone.
If already after the second, and even more so the first, expansion there is trading of the imbalance zone on the corresponding timeframe, then there may be some questions about the strength of the players in the impulse. In such cases it is necessary to additionally check what is happening on the higher timeframe: is there an exit into an impulse there, or is the game still taking place inside balance.
Detailed breakdown of a classical impulse
Balance phase
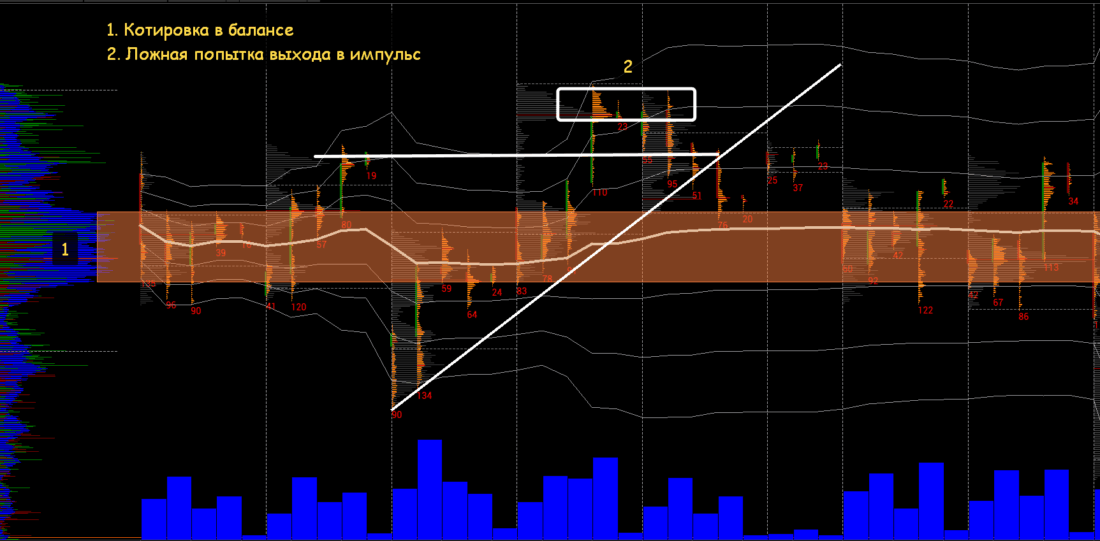
- The quote is in a medium-term balance.
- We see an attempt to exit balance in the northward direction: a) opening below balance, an impulse expansion into balance, b) flat accumulation inside balance, an impulse expansion above the boundary.
- Return to balance = a failed attempt before the real northward exit / a manipulative stop run before the start of southward dynamics.
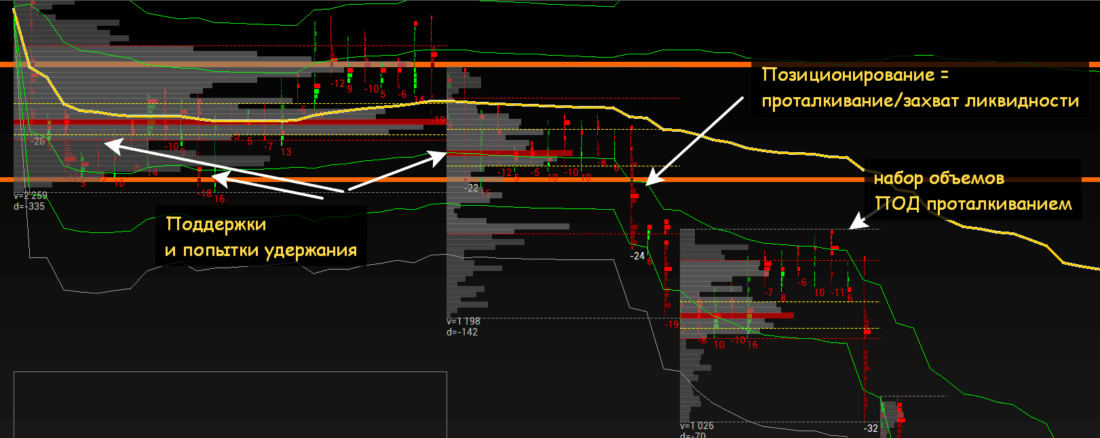
Let me remind you that the signal of an exit into an impulse looks like this: after breaking the upper boundary of balance and beginning to work in the flat, it is necessary to see further expansion in the breakout direction with a transition into volume accumulation ABOVE the recent push liquidity (captured liquidity).
If there is no holding above the push volumes, but there is activity below these volumes, then in this case a return to balance is possible, which is what we saw in our example.
In such a setup there are two solutions:
- there may be one more touch of the opposite boundary in the balance and an exit in the direction in which the initial thrust occurred;
- a transition to the opposite impulse dynamic.
Transition into an Impulse from Balance
Let us look at how our scenario develops further.
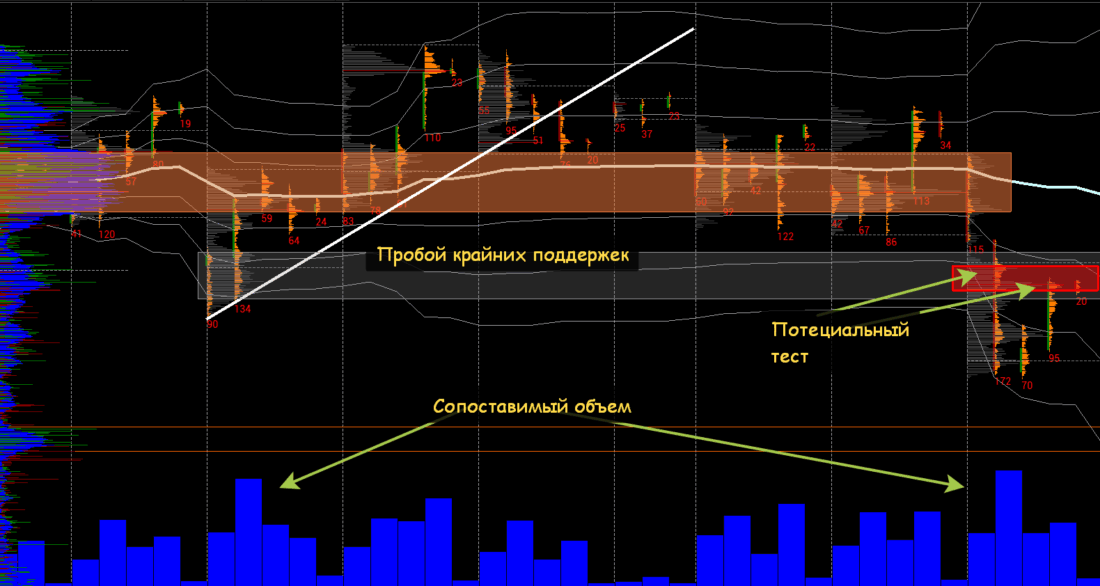
We observe a move below the impulse supports, specifically below those where there was a strong volume push, which initially could have been interpreted as the start of a buy impulse.
Then volume accumulation follows in the zone of the most aggressive (first) purchases. In a very good case, accumulation happens lower, using horizontal volumes as resistance.
In other words, we should see the story that we examined in the previous subsection. And we do see such a picture: an impulsive move below the local volume load (that is, a micro-balance) gives a southward expansion on the same timeframe and acts as resistance.
At this point in such a scenario two options are possible, taking into account the comparable volumes passing now and earlier at the lows:
- A sharp return into the balance (a reversal impulse to continue accumulation or a true start of northward dynamics).
- A transition into a full-fledged short impulse.
It is exactly option 2 that we will see: three normal impulsive expansions with a transition into a new balance, which I will discuss in the next subsection.
Signs of a Transition into an Impulse
- A move away from VWAP immediately to the -2 deviation with a test of the -1 deviation right in the pushing zone.
- A sharp continuation of the dynamics at the -2 deviation. In an impulse, the dynamics move between the 1 and 2 deviations from VWAP from the start of the balance.
- I would note separately that on the anchored VWAP built from the start of the move into the impulse, the protection of the -1 deviation is clearly visible. This is a strong signal.
- The first expansion beyond the balance boundaries has a length of 2.5 ranges of the entire balance. One of the characteristics of an impulse is a sharp move by the size of two balance ranges.
- Protection of all pushing volumes.
- Growth of vertical volumes.
- The presence of a gap (price gap) that is not traded through is a very strong signal.
This is how the impulse from the previous section develops on the lower TF: the structure is seen better.
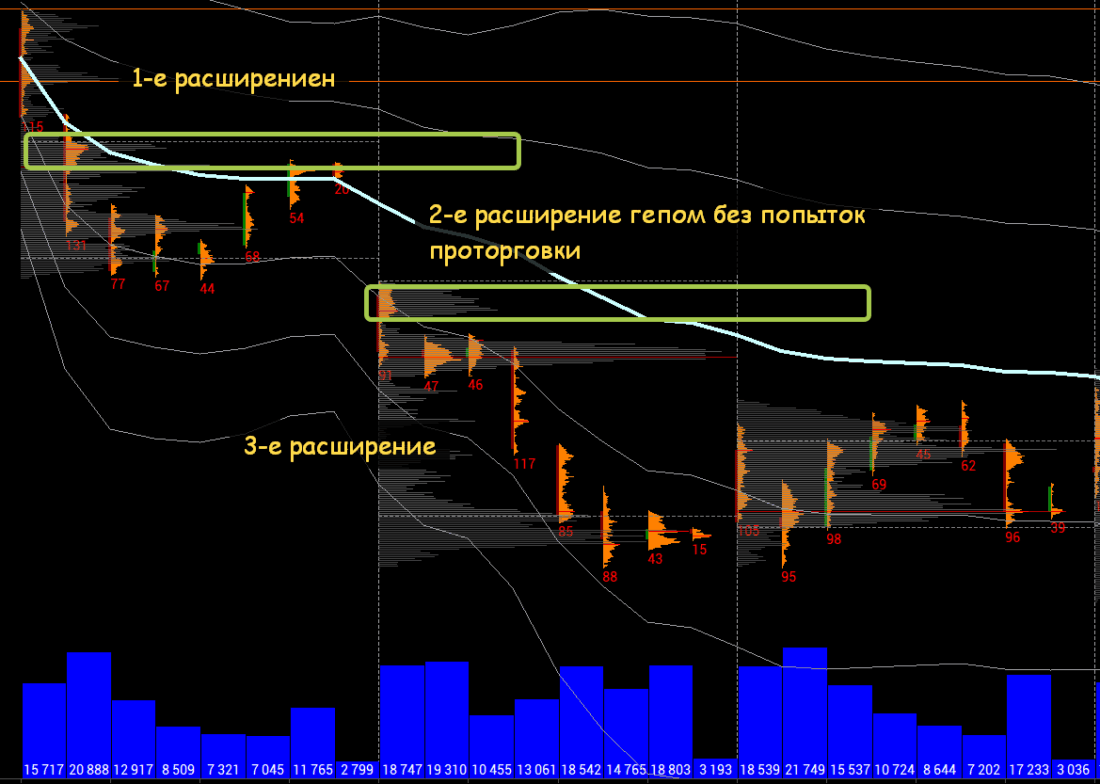
We see the classic three expansions with flat and fast reloads. The transition into balance is a test of the mean after the impulse. The further development of the situation occurs on a different timeframe.
Complex Situations: Impulse or Not
The picture below shows a situation where, it would seem, there is a transition into an impulse, but the structure of the southward expansion suggests that the movement on the current timeframe is limited.
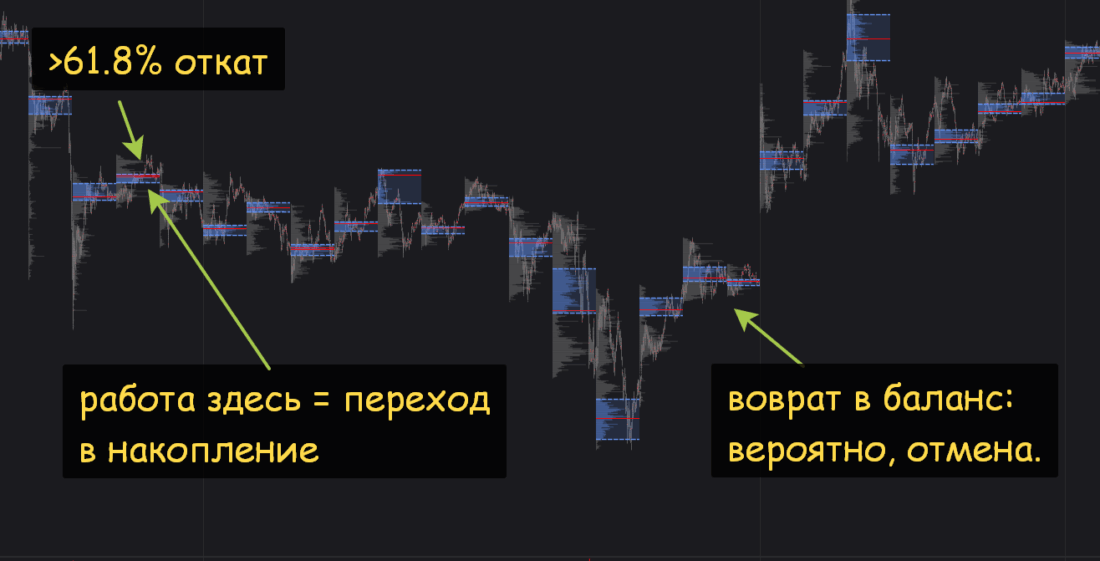
What tells us that playing the impulse at the moment is dangerous?
First, the second expansion, which can also be considered the first after leaving the balance, has an "incorrect" appearance. It is very strong, and the pullback is a little more than 61.8% by Fibonacci.
In a proper expansion, liquidity capture occurs at the price extreme (pushing volumes), after which the expansion continues, and this liquidity becomes protective.
Here, however, we have a price extreme with a return above the volumes that in a local impulse should be protected by sellers. After that, a normal balance forms on the timeframe that is higher relative to the impulse under consideration.
After a long time, a small expansion to the south occurs, which ultimately turned out to be a stop hunt and a V-reversal.
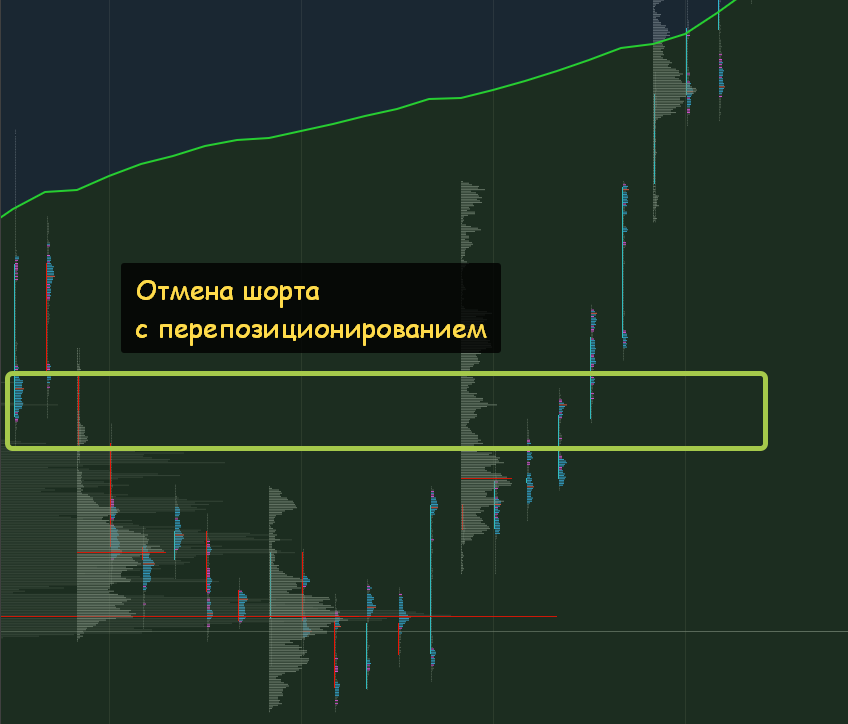
Here is another example. When testing the short pushing zone, the price seemed to show bounces on the lower TF, but the result was a transition into a real impulse in the opposite direction. The "seemed" is important here: the movements in the opposite direction are weak, and then volume work gradually goes higher and higher, as it should in an impulse.
Below is an example where relatively long accumulation after the first expansion gave a continuation of the dynamics. Yes, here there is a test of not very aggressive pushing liquidity with the gathering of sufficient volume right in the local pushing zone, but the structure at the moment is dangerous: there may be either a strong reversal like in the previous example or a strong continuation.
In any case, this is a higher-timeframe game.
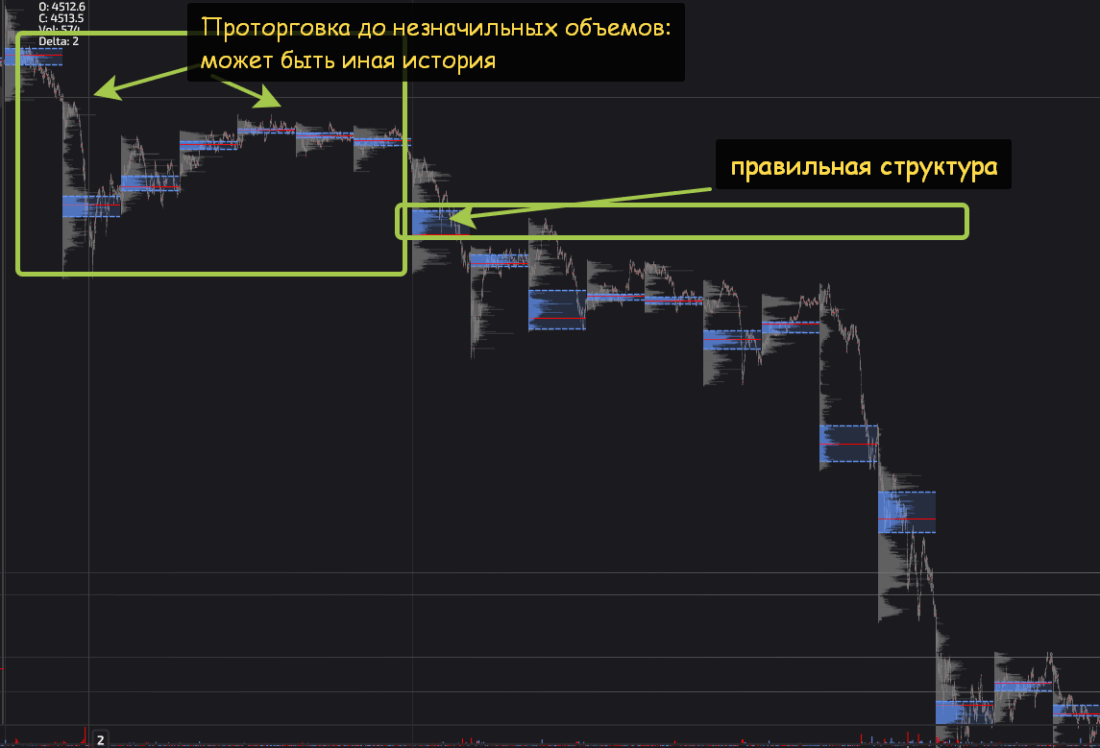
The second expansion is relatively short. There is liquidity protection for push-through here, but the balance again takes a long time. The balance itself has a downward appearance, and this is a fairly strong signal for the development of impulse continuation, which is what we ultimately saw.
By the way, in the context of accumulating volumes for a strong impulse move, you can look at the reverse in the previous example, where in the breakout zone of volumes that were previously positioned short, purchases are going higher and higher.
How to Look for Entry Points into an Impulse
An entry into an impulse can be aggressive or conservative.
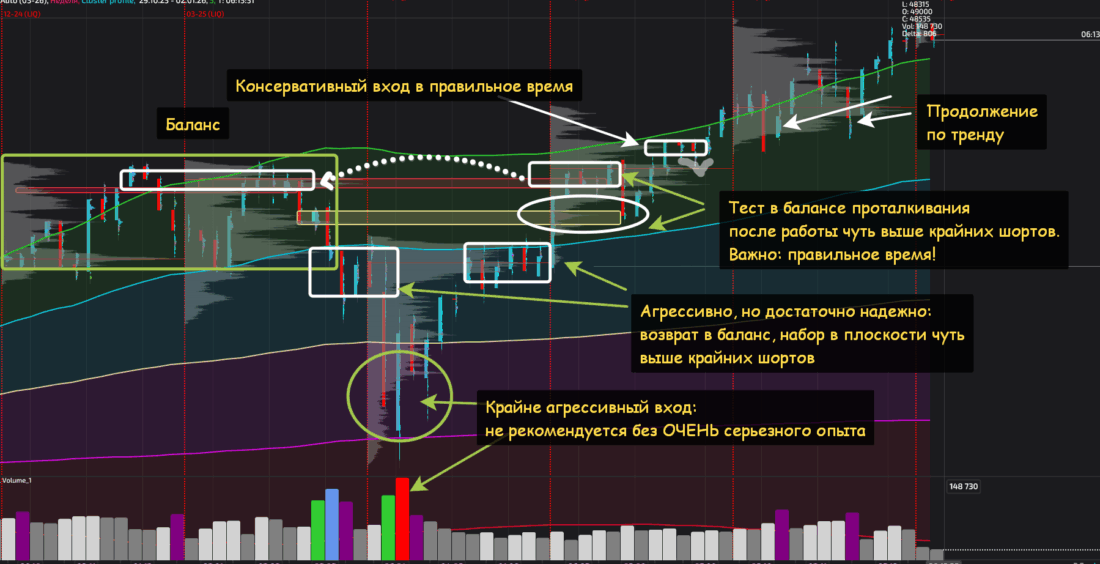
- An aggressive entry is possible when there is a reversal pattern (V-reversal, head and shoulders, etc.). An entry from the reversal point is the most aggressive. Very often such entries are erroneous, because this zone is a flat loading area after the first and/or second expansion in an impulse that has begun. I am sure that many readers have found themselves in such situations more than once, relying on oscillator readings showing oversold/overbought conditions.
- A less aggressive entry can be sought on a reversal (fast and high-volume) return into balance. In the example below there are signals that we are seeing exactly a reversal: a flatness in the main balance, and at the same time slightly above the extreme shorts. If they have experience, traders can open trades in such places with an understanding of the degree of risk.
- The first conservative entry is possible on a test of liquidity for pushing through the second expansion, but still inside the balance. This entry implies reaching the upper boundary of the balance and accumulating volumes for a breakout. And experience is needed here to open a trade, because a sharp return from the boundary into the balance is also likely (see the very beginning of the impulse breakdown). And the most important thing is the right time, or rather, the right timing. Within the American session, such an entry most often appears after 9:30-10:15. A volume test is possible at this time and approximately until 10:40-10:50 CT. Within the week, it is usually the second Wednesday-Thursday. Within the month, often from the 10th to the 15th.
- A fairly conservative classic breakout entry is possible when volumes are accumulated above the former resistance zone with a possible test of the previous zone. Enter on the test, but preferably after the test (that is, in the microstructure on a lower TF you need to see the beginning of a new impulse).
- The most conservative entry is a test of the last liquidity for push-through. On the third and subsequent expansions, such a test is usually a test of the previous volume accumulation zone. This entry will come after liquidity positioning: there is a very short stop here, despite the entry at the price extreme.
- Then we move along the trend until the trade is closed.
Conclusion
An impulse is an aggressive distribution of liquidity accumulated in the balance, large in length and short in time.
Usually an impulse has three expansions with two fast liquidity reloads. A short-term liquidity reload in an impulse looks like a flat (or almost flat) at the extreme and occurs above the captured liquidity of sellers or below the captured liquidity of buyers after leaving the balance.
The best entry into an impulse is after liquidity positioning.
Additional signs of an impulse:
- Accumulation of horizontal volumes above/below the medium-term balance relative to the timeframe being considered.
- The first significant expansion beyond the balance boundaries after liquidity accumulation for push-through has a length of 2-2.5 of the range of the balance itself. The rule works well on a lower TF, works worse on a higher TF, and a confident realization can take weeks.
- A move away from VWAP immediately to the -2 deviation with a test of the -1 deviation right in the push-through zone. After building the anchored VWAP, we also see impulse dynamics.
- Protection of all volumes for push-through or price gaps.
- Growth of vertical volumes, especially on the Weis Wave indicator, and the speed of passage.
The fewer the signs, the greater the chances that this is not an impulse, but something else. You can make money on that something else, but whether the game is worth the candle, let everyone decide for themselves.
Respectfully,
Ivan Rusin