
The Linear Regression Method in Forex: All the Secrets of Its Application

In the most widespread Forex trading platform on the market, Metatrader, as well as in other terminals, you can encounter linear regression. It is included in the standard set of graphic tools, representing a channel of equidistant parallel segments automatically built by the program.
In today's material, we will try to figure out what linear regression is and how it can be applied in trading. It will be difficult and interesting)
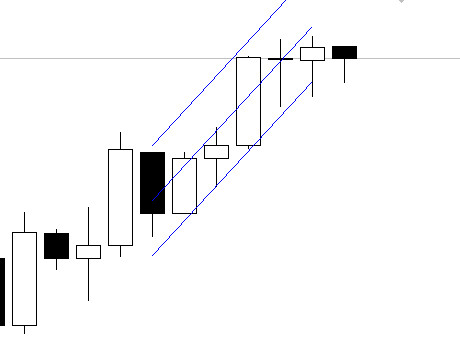
The indicator "breaks off" at the last formed candle. The absence of any trading signals after plotting and future projections made linear regression not the most popular and mentioned tool of trading. It is hard to believe that with the help of three drawn lines one can:
- Forecast the closing level of the next day;
- Determine the probability of a trend reversal or continuation;
- Obtain a full-fledged trading strategy.
What is linear regression and why is it suitable for trading?

The idea of linear regression (LRI) was discovered in the 19th century by the famous English anthropologist and psychologist Sir Francis Galton thanks to observations of people. A statistics enthusiast and relative of Charles Darwin noticed the pattern of tall children often being born to short fathers and, conversely, short children being born to tall men.

Francis Galton called this regression to the mean: the natural tendency to preserve the size of a population at the level of average values, which made it possible to predict a sharp "genetic response" to any abnormal deviations.
Fluctuations in currency rates are the best demonstration of such a law. Trends do not exist without corrections, the probability of which rises when volatility grows beyond the average trading range. To identify and assess such deviations and corrections, traders often use moving average lines or the Bollinger indicator, which includes the formula for the standard deviation of the indicator's upper and lower boundaries.
Unlike the indicators listed above, linear regression makes it possible to determine more accurately the middle line toward which prices gravitate. This is clearly shown in the figure below: the Bollinger Bands envelope significantly loses to the linear regression mean in the number of returns and crossings by quotes.
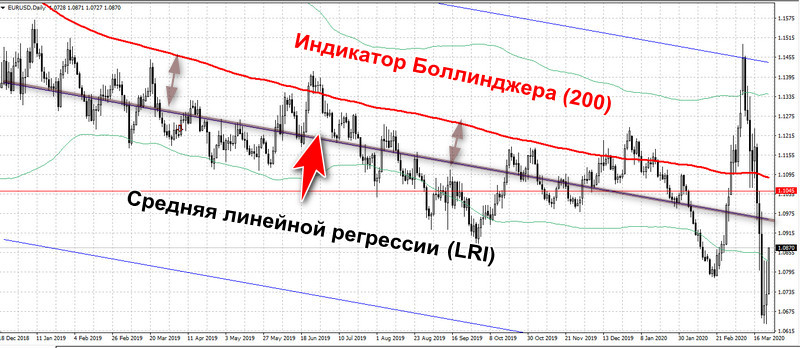
Such accuracy is achieved thanks to a more complex formula and statistical methods of calculating LRI. The middle line is built as the most optimal straight line that linearly describes all the "scattered" points in a two-dimensional coordinate system. In trading, these are closing prices (the Y-axis) and the time of sessions (along the X-axis).
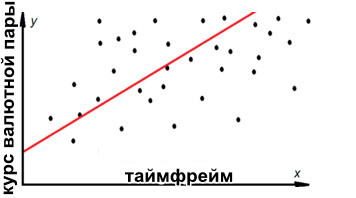
The method of losses helps determine the optimality of linear regression construction by calculating the smallest error of the distances between each closing price and the point on the regression mean line using the least squares method.
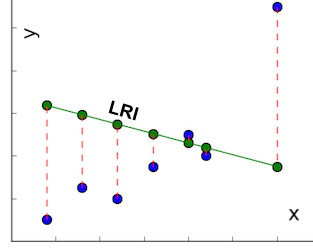
The solution of the equation will be a line described by a function of the form f(x)= m*x + b, where b sets the shift of the straight line along the Y-axis (the currency rate), and the multiplier m determines the slope or strength of the trend (the greater the angle, the higher it is).
The described method is used in econometrics and in the construction of neural networks to forecast future values of the rates of currency pairs, stocks, commodities, etc. Using Excel or other specialized programs, they find the parameters of the linear equation of multiple regression, making it possible to calculate the closing levels of the next day or week.
If you carry out, according to all the rules of econometrics, the calculations to obtain future daily closing prices and plot them on the chart, then you can verify empirically that on small segments LRI over five to ten sessions produces approximately the same forecast results.
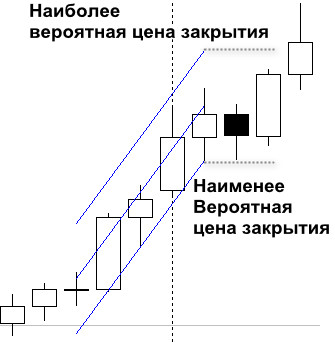
To obtain the assumed closing price of the next session based on linear regression drawn through five candles, it is necessary to draw horizontal lines from the upper and lower LRI channel, parallel to the time axis of the previous candles.
If the trend is rising, then the upper level will be considered the most probable closing price, while the lower level provides for a trend change as the least possible option. This is not graphical analysis; the data are obtained mathematically, so they work in a trading strategy more reliably than other indicators.
Forex pair trading strategy based on linear regression data
A strategy for trading Forex currency pairs by linear regression will be conditionally divided into two parts. The first is based on graphical analysis and simple rules. The second part provides for the use of the Excel program to obtain r2, the coefficient of correlation, which determines the strength and possible reversals of the trend.
Strategy characteristics
Platform: Metatrader 4 or any other terminal with the function of building linear regression
Currency pairs: any
Timeframe: D1
Trading time: around the clock
Recommended brokers: Alpari, RoboForex, AMarkets
Rules for building the channel and the next day's candle closing levels

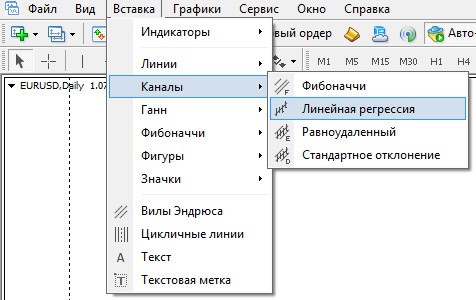
Linear regression is located in the Metatrader 4 program in the "Channels" section, in the "Insert" menu.
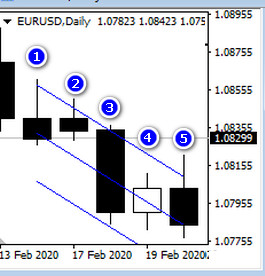
After selecting the tool, draw a segment, counting 4 bars to the left from the last candle. In total, there should be a segment of five bars in the channel.
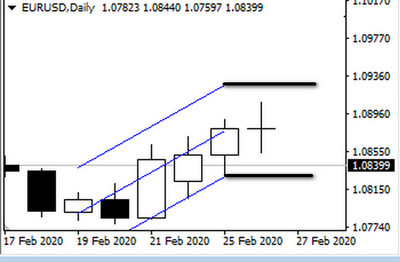
A trader will have to rebuild the channel independently every day after the close of trading. The sample should not include the candle of the current day, which is in the process of formation. Along with the channel, horizontal levels built from the upper and lower boundaries of the channel should also be updated.
Strategy rules

- Buy stop - 5 (old) points above the horizontal level built from the upper channel;
- Sell stop - 5 points below the horizontal level of the lower regression channel.
After one of the orders is triggered, the second is canceled and a stop-loss is placed:
- At the low of the candle of the previous session, if the trader entered the market via Buy Stop;
- At the high of the previous candle, if Sell Stop was triggered.
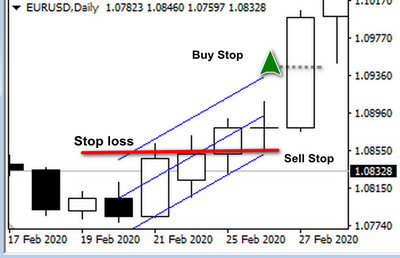
Later, the stop-loss, depending on the direction of the open trade, is moved to the Sell Stop or Buy Stop level of the next day. The trader independently determines the possibility of building a pyramid of orders, proceeding from money management considerations so as not to go beyond risk 1-2% of the deposit when the stop-loss is triggered.
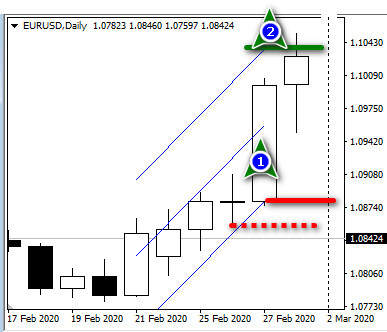
All long positions are closed if the angle of inclination of the LRI becomes negative; short orders are closed when it becomes positive.
Determining trend strength by the linear regression correlation coefficient

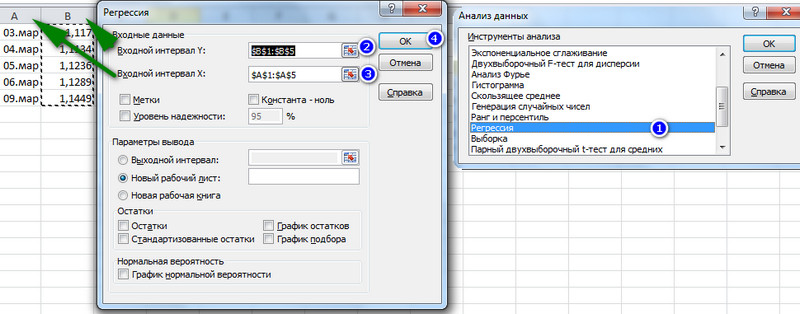
Linear regression can be calculated in an Excel file: it is enough to enter five closing prices of daily sessions and select regression in the "Data Analysis" block through the Excel "Data" menu.
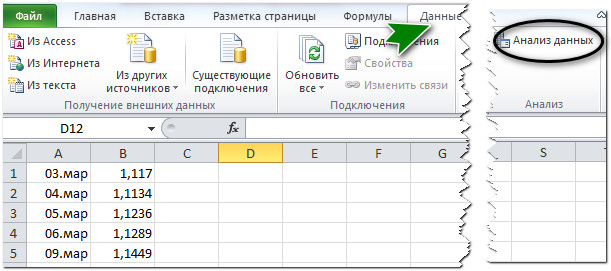
The data analysis block is enabled after activating the "Analysis ToolPak" add-in. Access to Excel add-ins can be obtained through the "File" menu and the "Options" option.
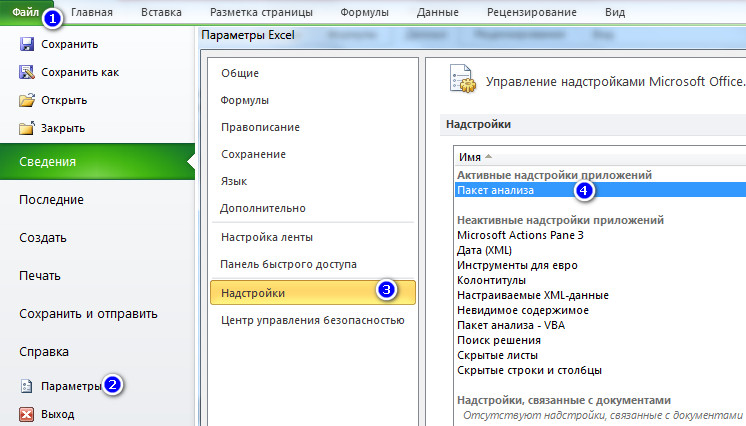
The correlation coefficient r2 is calculated automatically; the trader selects the "Regression" item and in the window that appears specifies the area of the input parameters: currency rates on the Y-axis and session days on the X-axis.
Regression calculations appear on a separate sheet, where the r2 data are located.
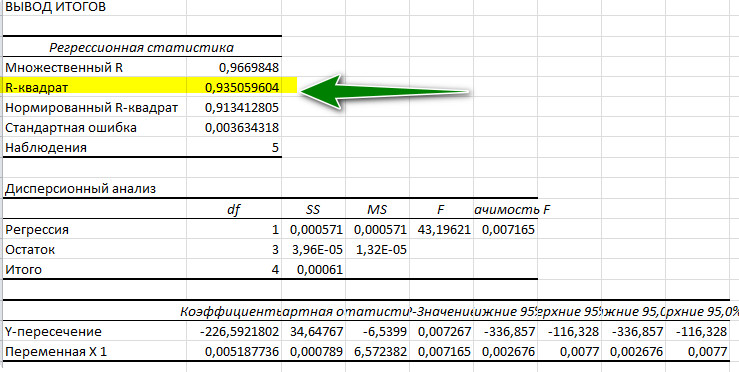
The values of the correlation coefficient are interpreted as follows:
- 0,1 and below - a nearby trend change, a ban on opening trades;
- 0,6 and above - the market is in a trend.
Another option for determining a trend reversal is the measure of the divergence between forecast session closing values in the form of horizontal levels and real closing prices. The smaller the error, the closer the trend reversal.
Naturally, a significant excess over the indicators of the horizontal lines (breakout) points to a very near change in the direction of the rate of the currency pair.
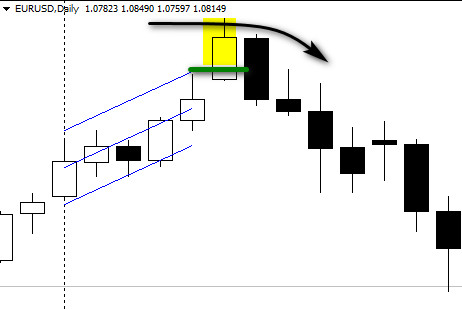
Therefore, the best trade is the first entry on a trend reversal, when:
- Sell Stop is triggered in an upward trend or
- A Buy Stop order is activated in a downward trend.
If a trader uses a pyramiding tactic, then additional trades are better made short-term or the stop-loss on these positions should be shortened significantly, striving, if possible, to move the protective order to breakeven.
Conclusion

Econometrics is considered a promising direction for forecasting market trends, but complex calculations sometimes do not differ in efficiency from simple linear regression computations on a fairly short section of the market.
Comparing the projections of forecast closing prices based on LRI channels with real candle closes, it is possible to determine in advance with a high degree of reliability the moments of market reversal. The linear regression indicator and pending orders allow the trader to enter the market at the initial point of reversal and accompany the trend almost until the complete end of the movement.
Sincerely, Ivan Petrov
Tlap.io