Impulse Session Models
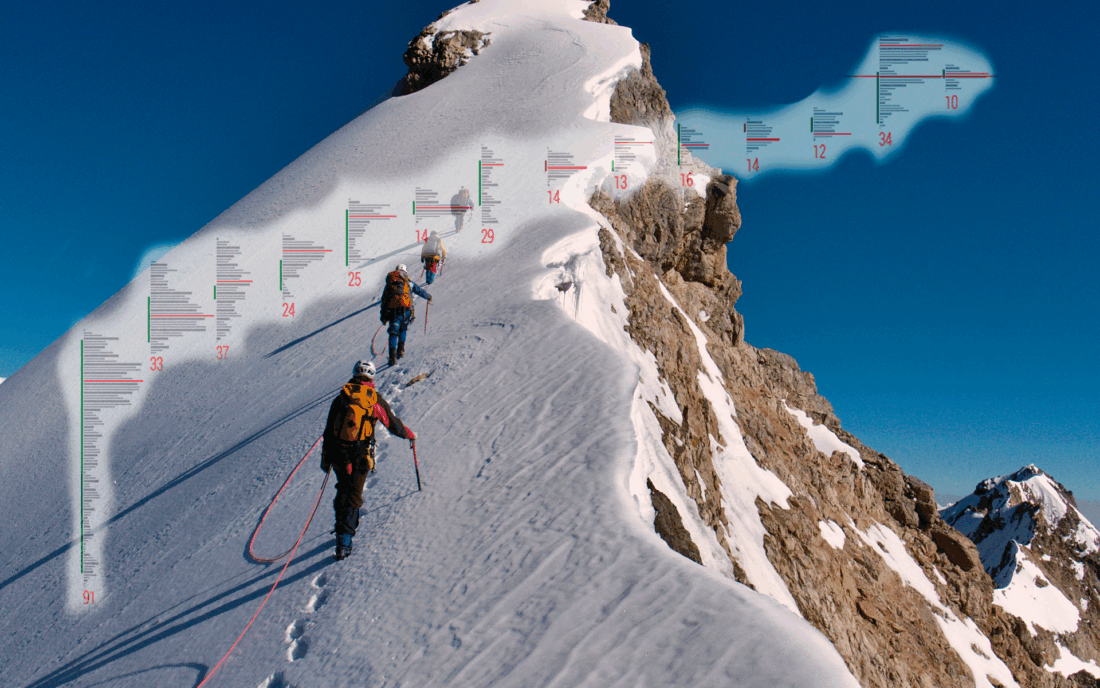
Impulse session models can be divided into three major types. If desired, of course, many more can be distinguished, but for simplicity let us focus on three pure models of impulse sessions.
The first type implies the start of dynamics directly from the initial balance without the accumulation of significant volumes in it, with the continuation of the dynamics until noon or the end of the session, when the quote moves into balance.
The second type of impulse session implies an imbalance in the first half hour to hour, after which volume accumulation occurs in a flat plane until 10:30-11:30 CT with the continuation of the dynamics until the end of the day.
The third type of session is characterized by aggressive volume accumulation in a wide range during the first 30-45 minutes of the session with subsequent one-directional dynamics.
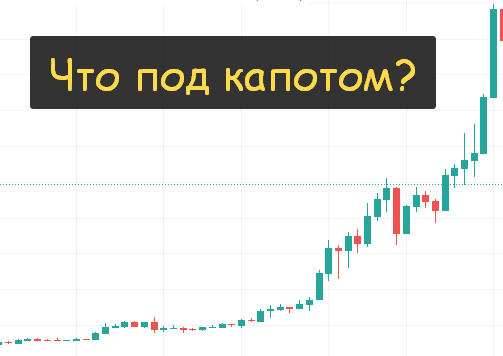
Before analyzing the impulse types of sessions, I will show a candlestick chart of an impulse. On this chart we see the time and the range, but we do not see where and how the volumes were loaded. Without volume data, it is difficult for us to understand the length of the correction (23, 50, 61% by Fibonacci), the real aggression of buyers, etc.
The First Type of Impulse Model
This type is the most difficult from the standpoint of confident trading, since quite often a type 1 session can be confused with a reversal or partially reversal one, when after a sharp strike in one direction in the initial balance and a short and weak (until 9:30) or large (until 11:30-13:00 CT*) volume accumulation, an imbalance occurs in the opposite direction. We will talk about this in an article dedicated to sessions of this type.
*CT - Central Time, time in Chicago
There are also sessions where the dynamics stop already at 9:30-10:00 a.m. CT, and the quote moves into balance. I will analyze such sessions in the section on balance types, because cautious trading after 9:30 a.m. CT in them is in fact uninteresting.
You can expect a type 1 session (however, as with all other types, but there may be options there) in the case when on the higher TF there is a clear volume accumulation in a small range during 1-3 balance sessions in a row.
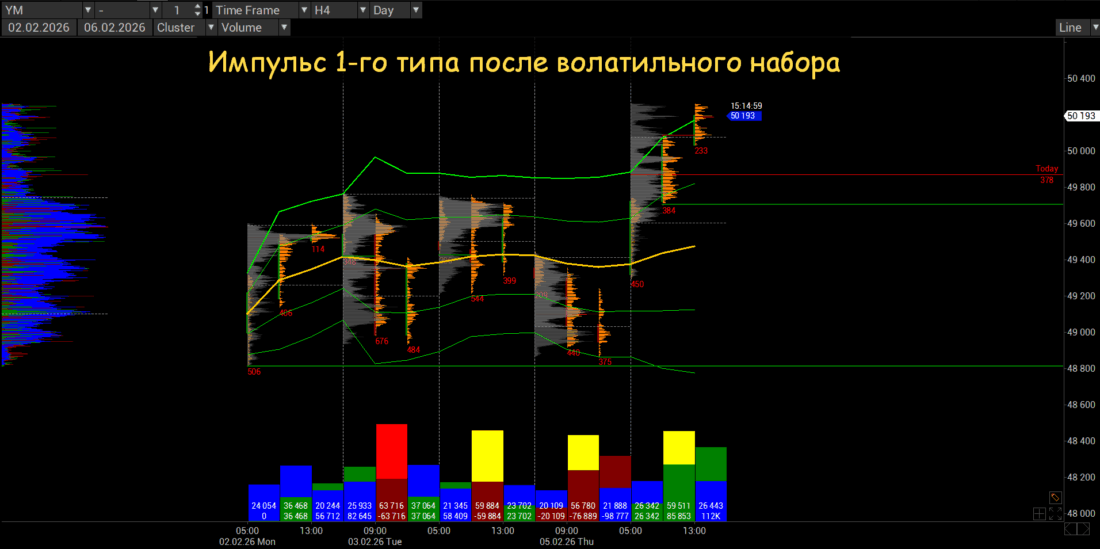
If we talk about preliminary volume accumulation in balance, it is important to monitor the average volume per tick in balance sessions (AvgVol). A high AvgVol is a fairly reliable signal for an upcoming impulse session of this type.
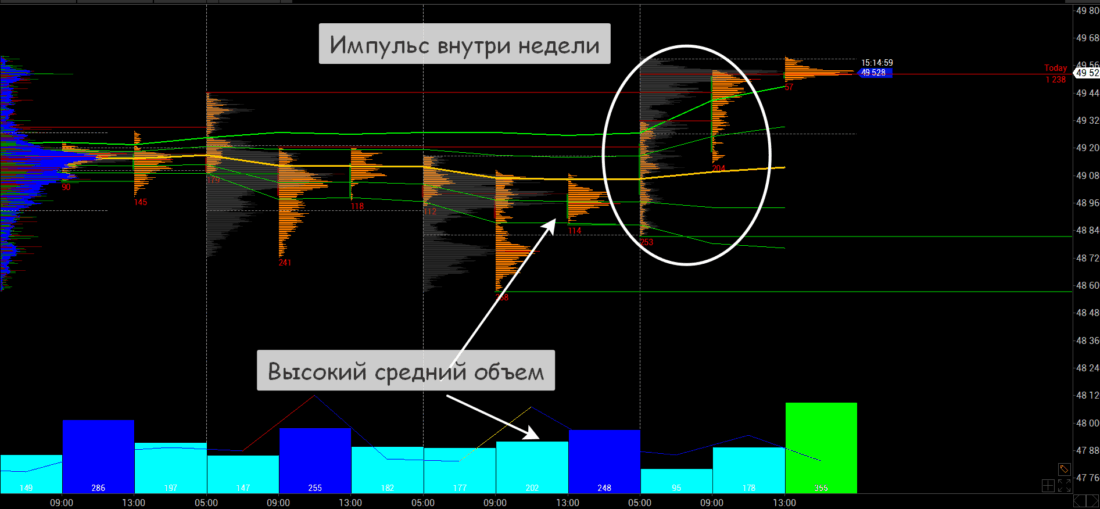
You can read more about average volume per tick in another article on the tlap portal.
Let us move on to the description of the 1st type of impulse session.
Quite often, the trigger for the start of the dynamics is some news or some event (market-moving news), for which smart money loaded up heavily, although this is not necessary at all, since a higher-timeframe player is at work.
By the way, this same model is also played out within, for example, one hour, which is characterized by an extremely large range.
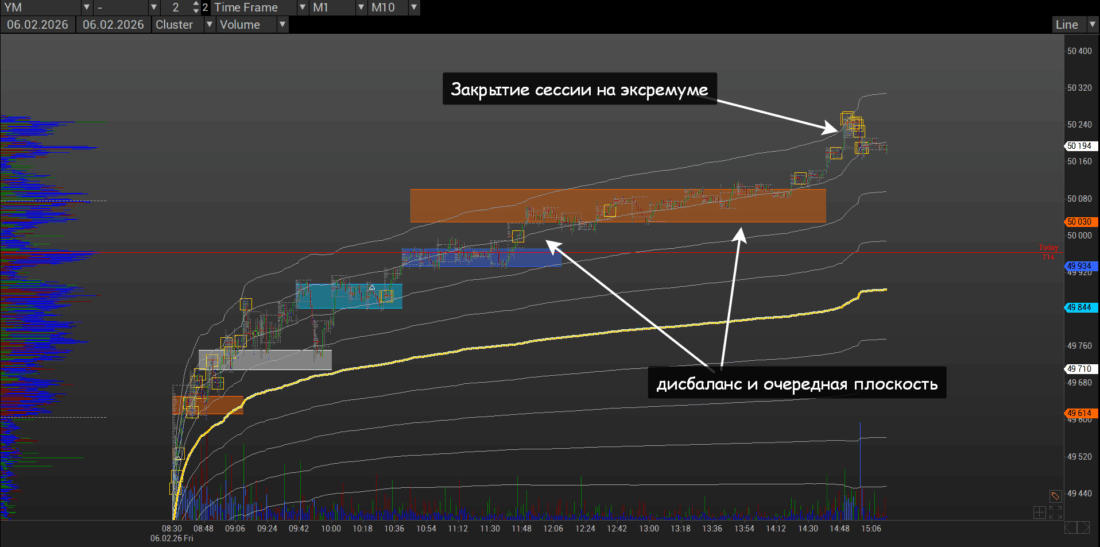
On the chart below is the YM futures contract (CME exchange), the RTH* session of February 6, 2026. This is the Friday after volatile volume accumulation over the previous 4 days (the first image in this section). M15 cluster chart, external cluster M90.
* RTH - regular trading hours (operation of American exchanges), 8:30-15:15 CT.
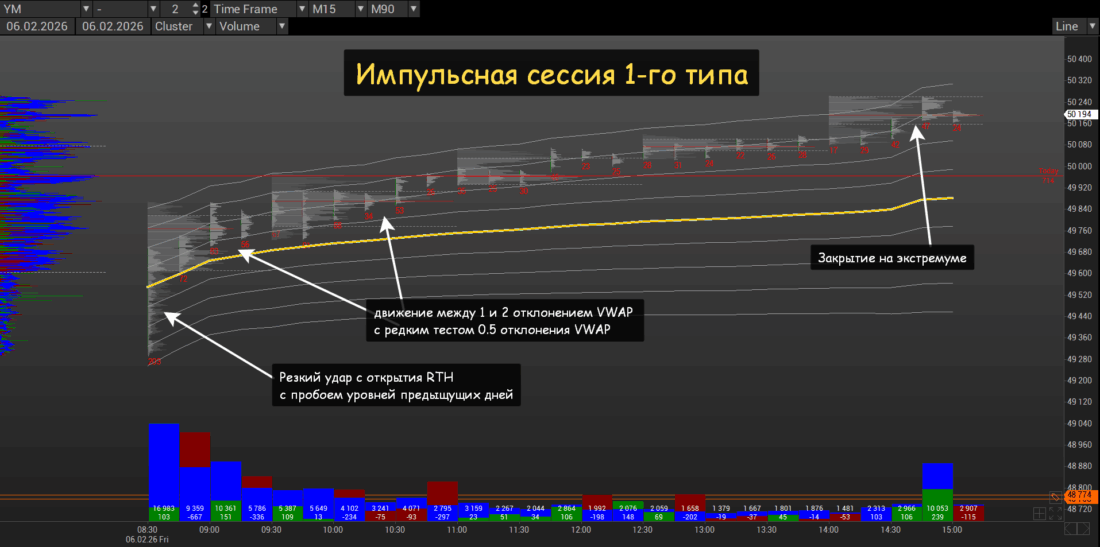
In type 1 sessions, the direction of movement is immediately clear: within 1-5 minutes after the start of RTH - 8:30 CT - a sharp movement begins with further flat volume loadings. The expansion range is very large. In the example above, it is more than 300 ticks, which corresponds to the minimum value of the average range of the entire session for this instrument (300-400 ticks).
In essence, we are talking about the first substantial imbalance, which in this session and, possibly, in subsequent ones will not be traded through.
Within the session, no obvious accumulation of horizontal volumes sufficient for such strong dynamics is visible, since a higher-timeframe player is at work here. Let us examine it on an M1 cluster chart with an external M10 cluster.
The first fast loading most often goes from 8:36 to 8:58 CT. The half-hour range closes at the extreme. From 9:00-9:10 CT, further expansion occurs with the achievement of another extreme by 9:30 CT.
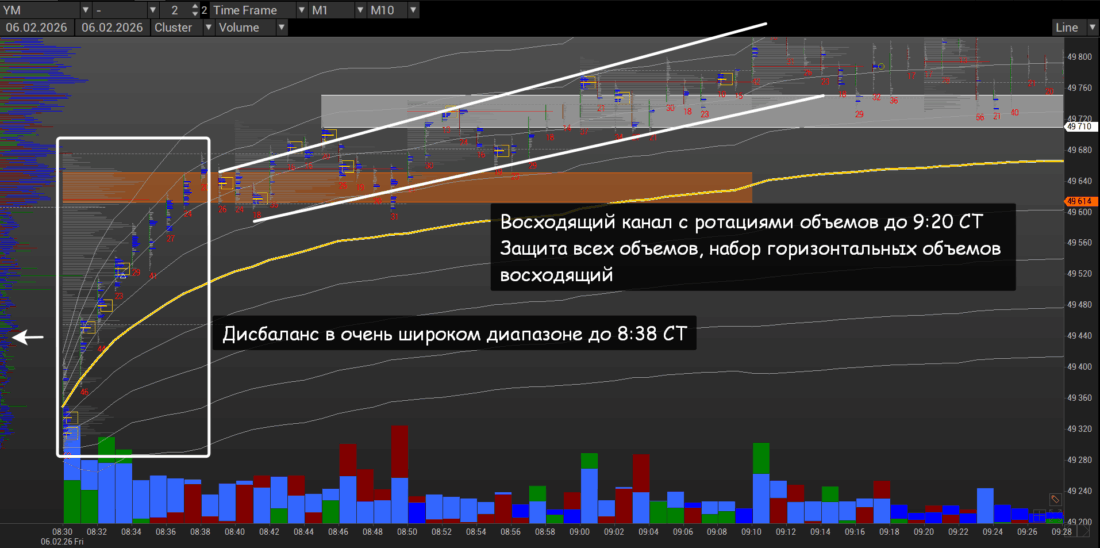
The loading of volumes at this time has an upward appearance (within an ascending channel, if speaking in terms of technical analysis).
The first significant correction (more manipulative in nature) occurs at 9:45 CT with a return to the extreme or closer to the extreme of this hour before it closes. It is worth noting that in other session development scenarios, the first correction may already be possible in the next hour (after 10:00 CT or even 10:30 CT). In any case, corrections form no farther than the main volume planes and VWAP, as well as the timeframe open (H1, as in the example under review, or M30).
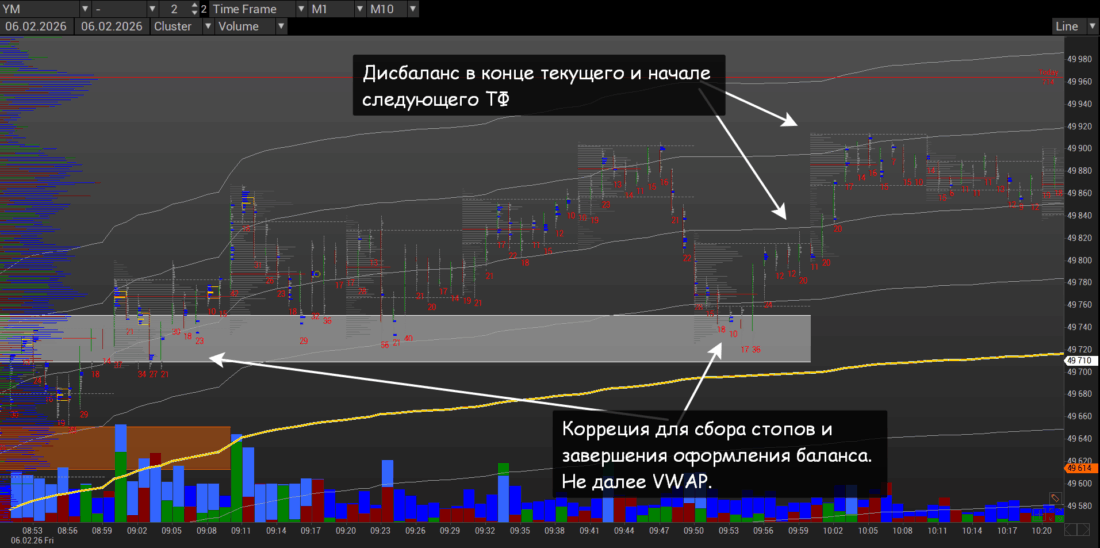
Quite often, volume accumulation takes place either within rotations with the previous manipulative short and partial trading through of the previous imbalance (our example), or above the previous rotational volumes. In fact, this is about repositioning.
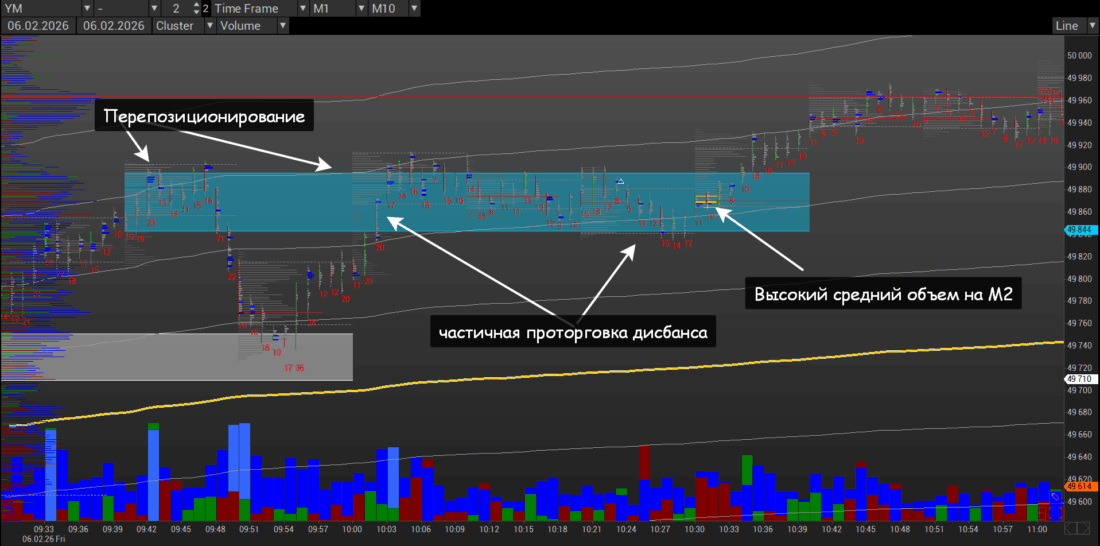
It is also worth noting the appearance of high average volume on the lower working TF (two minutes in our example) in the middle of the range, although it also happens at the range extremes (both at the lows and at the highs). This is a reliable signal of the start of further dynamics, as was mentioned earlier.
Next comes an imbalance that is most often not traded through. This happens after 10:40 CT (our example) or at the beginning of the next hour. Further volume accumulation takes place in a narrower plane, and most often it is here that they form the POC (point of control, the most traded price), as in our example, although this often happens closer to the absolute extreme of the session.
Often this already happens at the +1 deviation of the session VWAP. Usually there is no talk of stop runs.
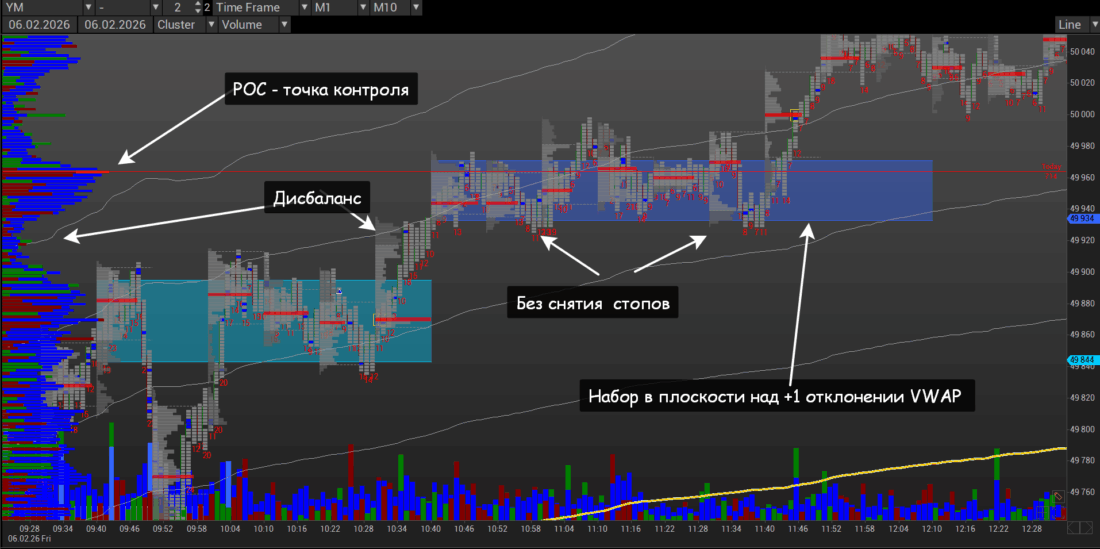
After accumulating volumes in the plane without trading through another imbalance (or with partial trading through) after 13:00 CT or after 14:30 CT (as in our example), we see the final imbalance.
Let us summarize.
The following features are characteristic of first-type impulse sessions:
- The start of the dynamics begins right from the RTH open at 8:30 CT.
- From 9:00 there is a continuation of the dynamics with a small pause at 9:10-9:20 or more often after 9:30.
- Movement in one direction between 1 and 2 VWAP deviations, closer to the second deviation.
- The first correction usually occurs after 9:40, but often after 10:00 or even 10:30 CT, no farther than the volumes accumulated after 9:30 or 10:00 CT.
- Tactical accumulation of horizontal volumes, volume rotations in balance, takes place at the extremes or near the extremes.
- The overall distribution of tactical volumes is in one direction without any corrections or with weak corrections within volume rotations, but no farther than a 0.5-1 VWAP deviation.
- Extensions continue until the end of the session.
- The vertical volumes of the current TF are closer to high ones; this is especially noticeable within the initial balance (8:30-9:30 CT).
How to trade this type of session?
You need to make sure that a certain volume has been accumulated in previous days and that there are signs of the start of an impulse within the week or month. This article describes in detail what signs of a transition into impulse can occur.
This is that rare type of session when you can look for an entry into a trade right from the RTH session open (in the first 10 minutes after the open). A conservative entry is possible at 8:50–9:10 CT. At 9:30 it is still not too late, but usually the price has already moved very far away, and the risks of confusing the session type appear. At the same time, you can also enter after 11:00 CT with a very short stop.
Entries can also be made at the lows of tactical balances or on a breakout of the tactical balance after 3-4 touches of the opposite side.
Second Type of Impulse Model
This type of session is characterized by an imbalance from the RTH open and a transition into a volatile balance from 8:40-8:50 to 9:20-9:40 CT (sometimes a little longer), followed by an extension.
After the extension, the quote returns to balance again, which is traded in the direction of the initial impulse with increased volatility, that is, with deep pullbacks. The movement continues until the end or almost until the end of the session.
On the chart below is the YM futures contract (CME exchange), the RTH session of July 15, 2025. Cluster chart M15, outer cluster M90.
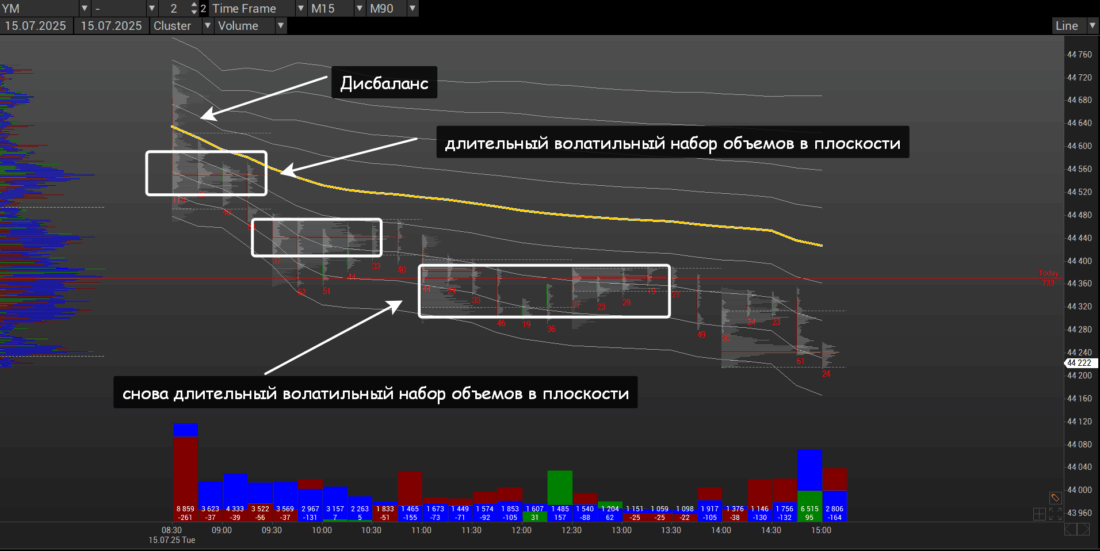
In this type, volume accumulation in the first 5-10 minutes of the session is possible, somewhere "along the way" to the main initial balance, as in our example. But a variant of forming the initial balance without intermediate placement is also possible.
This type of session should be expected when there is relatively low volatility in the first M5, with volume for a reversal gathered at one of the extremes, and within a fairly narrow range (in our example, only 20 ticks). Incidentally, all accumulation ranges in the initial balance are approximately the same.
After that there is a substantial total move over 10 minutes (more than 200 ticks in our example).
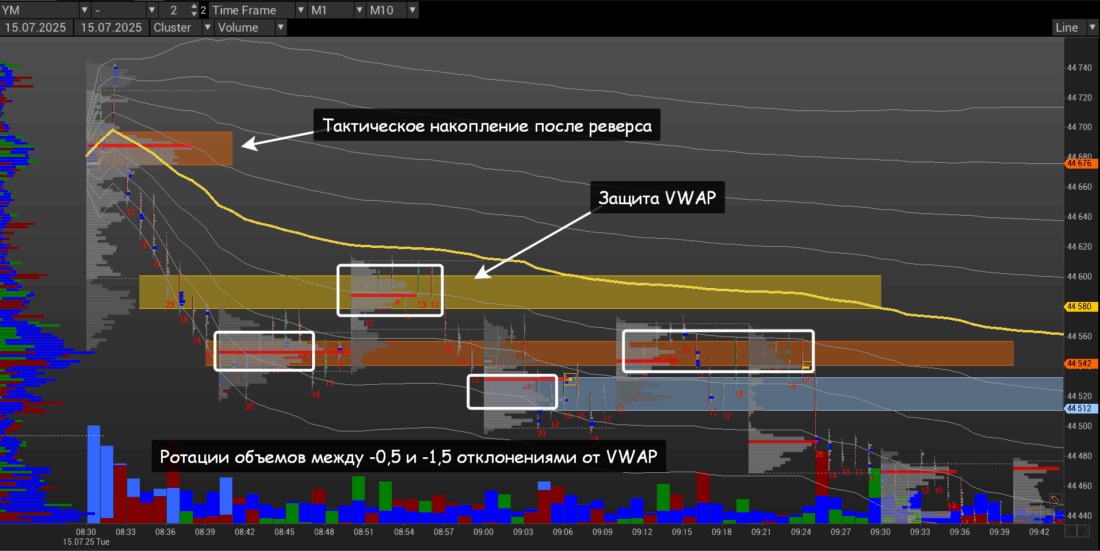
The initial balance takes shape as volume rotations (similar to a chessboard) after 8:40 and up to 9:30 CT. The rotations occur between -0.5 and 1.5 VWAP deviations (in our example).
On the chart, the pullback looks like a flag, but in fact it is the beginning of ordinary volume rotations. After the VWAP test, there is a small quote expansion (the formation of a new extreme) with another flat volume build-up and a return to the previous accumulation, where volumes are accumulated in the zone of the first accumulation.
The move into dynamics begins after 9:25-9:30 CT with the accumulation of tactical volumes (push volumes) at the lows. After the test comes a continuation of the dynamics, which is approximately equal to the initial range of this expansion. Later the quote moves into a volatile balance, and these push volumes serve as reliable resistance.
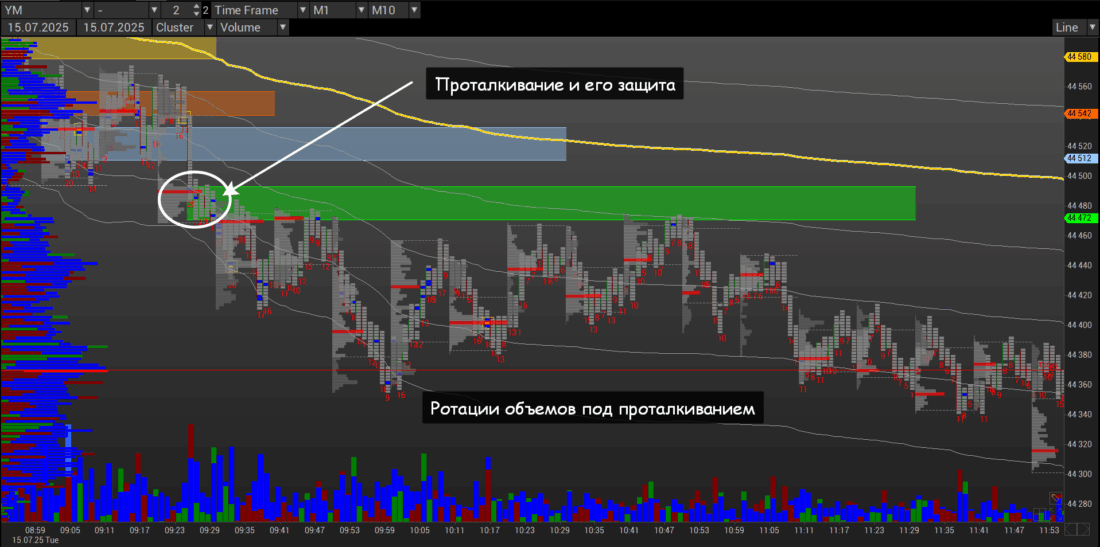
Volume rotations under the pushing action continue for 1-1.5 hours. The volume bottom (support) in this rotational balance will later become resistance. A POC is also often formed here, so these rotations can last up to 2-3 hours.
The session ends at the extreme.
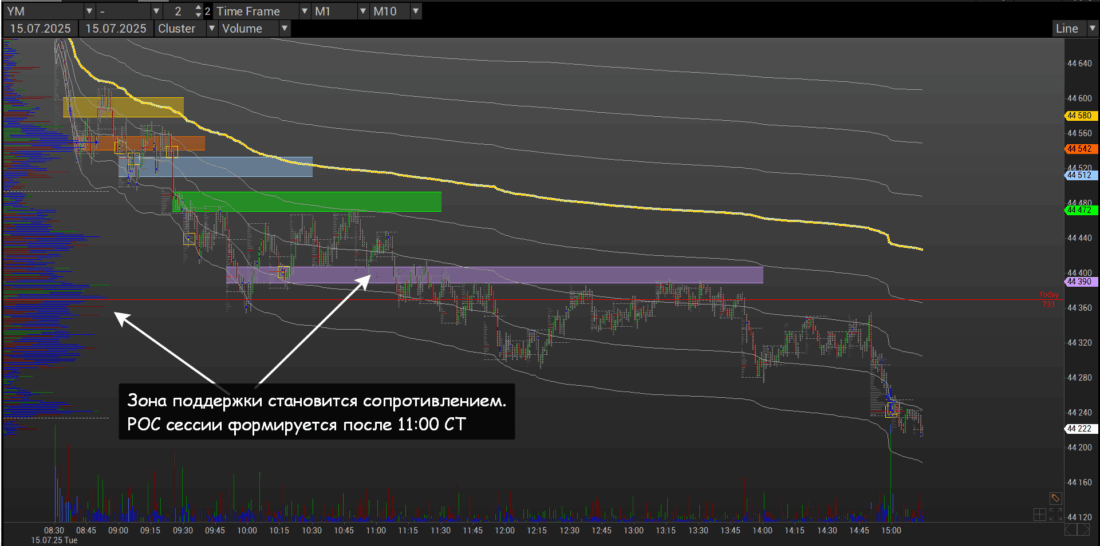
To sum up:
- The start of the dynamics begins right from the RTH open, at 8:30 CT, but at the very beginning it has a reversal appearance, and during the first minutes there is a clearly expressed flat loading.
- A reliable sign is the protection of volumes placed after 9:00-9:10 CT or, in the most extreme case, after 8:50 CT.
- Approximately from 8:35-8:45 CT there is volume buildup in a descending plane with an unfinished VWAP test.
- The start of the dynamics is at 9:25-9:40 CT.
- Movement in one direction between 1 and 2 VWAP deviations in a very large range, reaching the average session range.
- After the second expansion there is a transition into another balance, a longer one, which lasts from 1 to 2.5 hours.
- The movements have the character of a normal distribution, that is, expansions with a deep pullback, ideal for swing trading.
- An overall one-sided distribution of tactical volumes without any corrections or with weak corrections within volume rotations (in the form of a chessboard), but no farther than 0.5-1 VWAP deviation.
- Usually the movement continues until the end of the session; there may be mild and weak pullbacks.
- The vertical volumes of the current TF are closer to average, especially noticeable within the initial balance (8:30-9:30 CT).
How to trade it?
Quite simple. After 9:30 CT, wait for a breakout of the accumulation, or before 9:30 look for an entry point when push volumes are being defended. Place stops behind the push volumes when they are tested, so as not to get caught in a reversal session and not sell the low / buy the high.
Third Type of Impulse Model
This type of session can be divided into 2 subtypes:
- Non-aggressive accumulation from 30 minutes to 2-3 hours in a flat plane with a sharp move into impulse.
- Aggressively volatile volume accumulation in the first 30 minutes to 1.5 hours after the session opens.
The third impulse model is in fact a variant of the first type of sessions. The difference is that here the volume buildup in a balance or a volatile balance takes place within the session, rather than on the previous timeframe.
First Subtype
Such sessions are often encountered as a reversal on the higher TF.
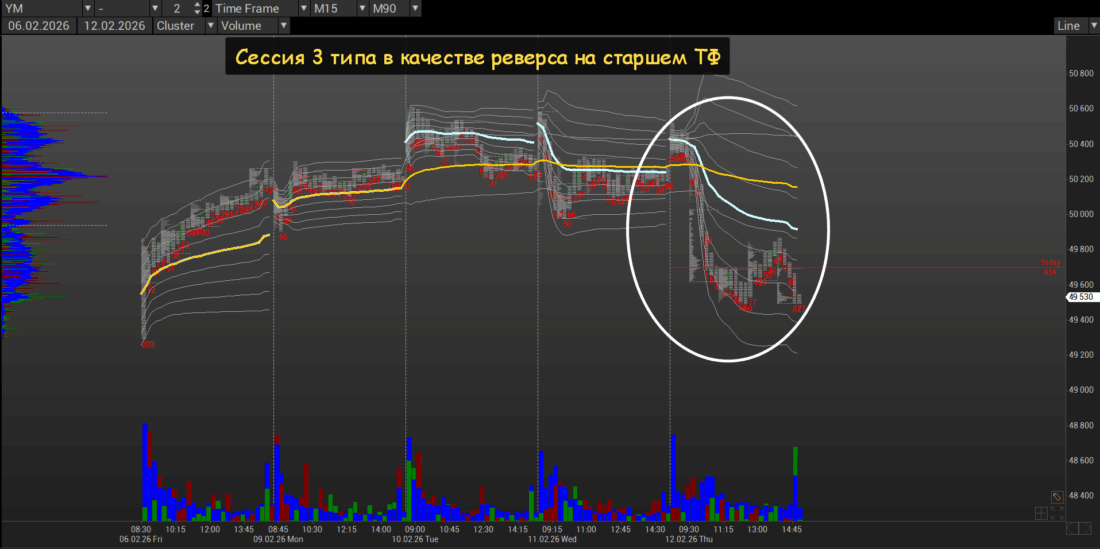
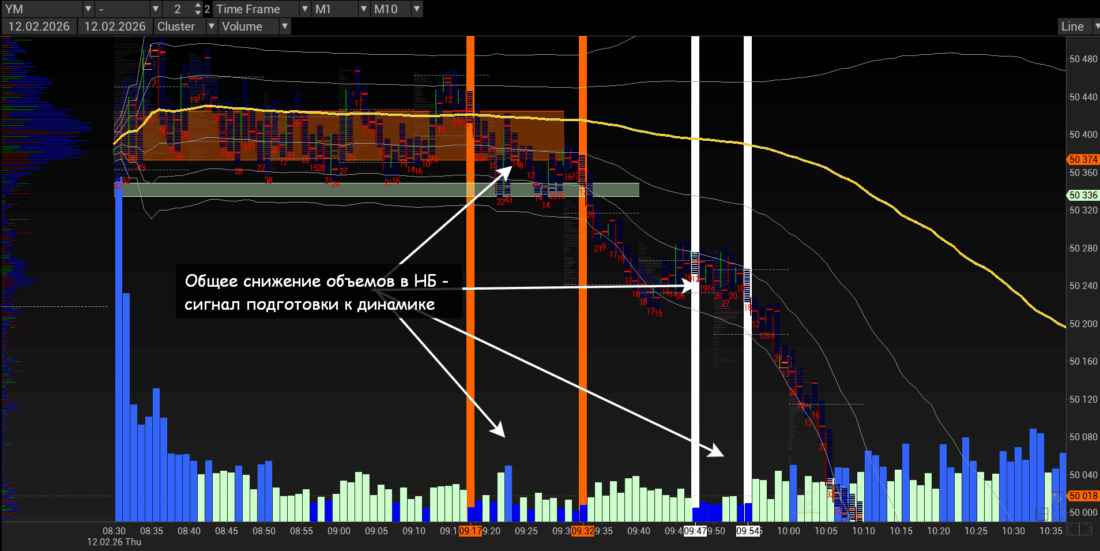
On the chart below is the YM futures contract (CME exchange), the RTH session of February 12, 2026. The cluster chart is M15, the outer cluster is M90.
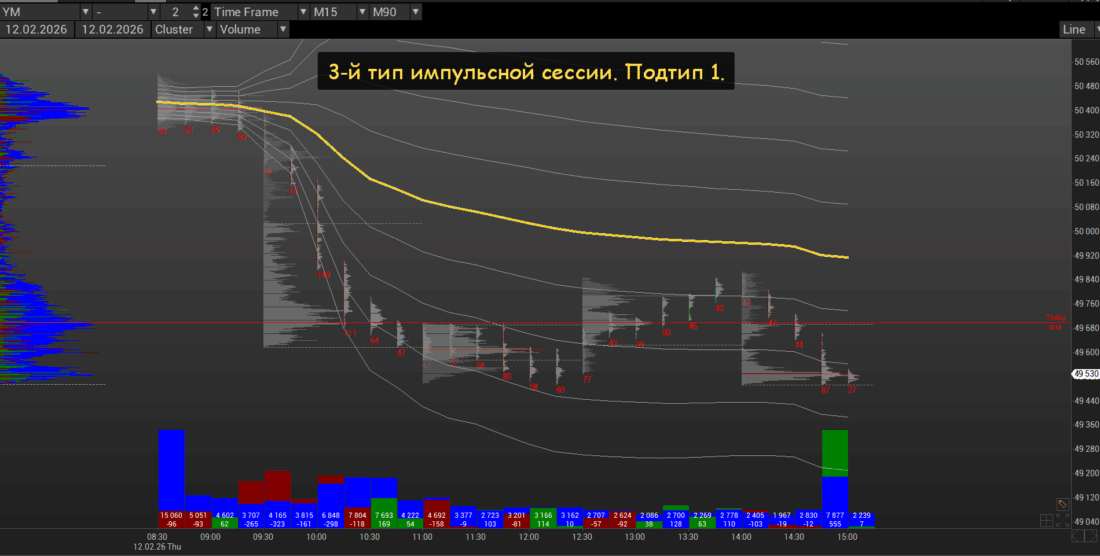
The characteristics of this type of session are as follows:
- In the first half hour to hour, there is a calm flat accumulation of volumes. What matters here is that the average volume per tick is high for this period of time.
- The imbalance is extremely strong: a large range.
- The subsequent movement takes the form of a collapse or a sharp rise.
- The quote is pressed against the 1.5 or 2 VWAP deviation.
- Volume accumulations begin after 11:00 CT, and the final expansion often takes the form of either a double bottom / double top or a not very strong move, although there may be variations, especially in falling markets, when after 14:00 CT there is a sharp further collapse and the total session range approaches extreme values.
- The pullback can be relatively deep in terms of range, but no farther than 0.5 VWAP deviation, in rare cases with a touch of VWAP.
- The session closes near the extreme.
And now let us look at the details.
In our example, the initial balance lasted for almost an hour from the start of RTH. Neither sellers nor buyers updated the high / low formed in the first 10 minutes of the session.
After 9:10-9:20 CT there is a small update of the low with a return to the lower boundary of the balance, after which a sharp collapse occurs, as in our case. By 9:30 there is a clear imbalance, in which all volumes are located below us (or above us, if this is a buy session).
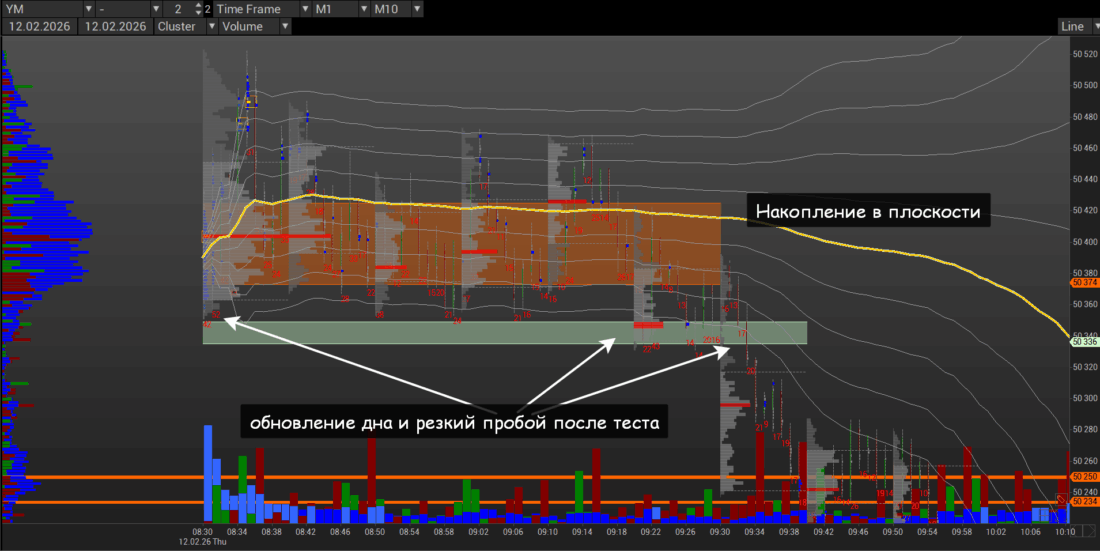
The further move is explosive in nature, with growing volumes at the extremes, but this often does not give a correction or the correction is extremely weak. The move goes beyond the -2 VWAP deviation (our example), although more often the quote is pressed against the 2 (-2) VWAP deviation.
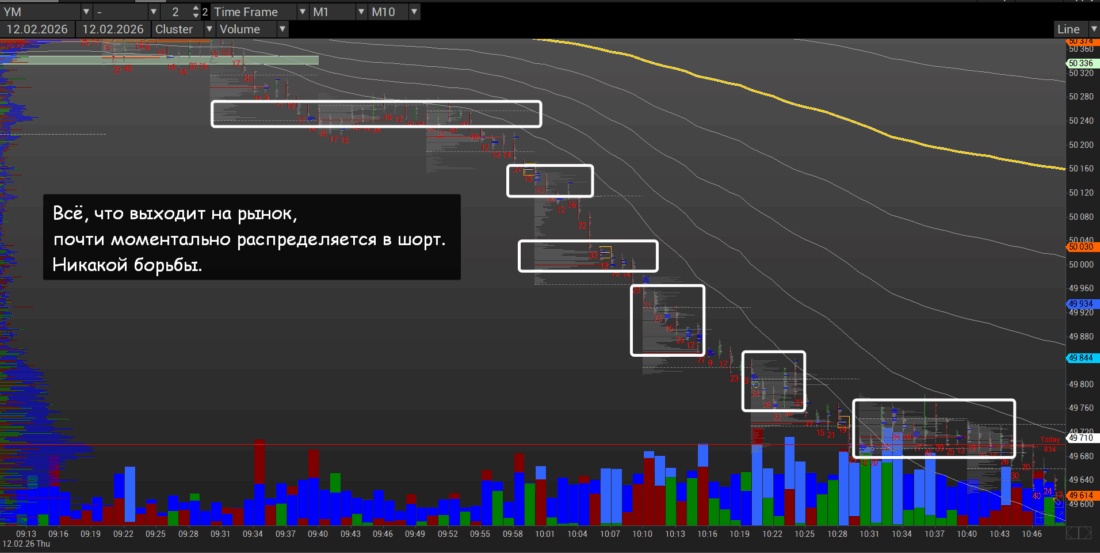
A short-term balance up to 10:00 CT is possible. Here you can look for an entry with a stop behind the first pushing array.
The main decline occurs within 1-1.5 hours. Vertical volumes and Weiss Wave are growing.
Why is there no accumulation along the way? Because it was accumulated earlier for the strike. We remember the average volume per tick, after which aggressive expansion follows.
The dynamics continue until 12:00-13:00 CT, after which a sharp pullback is possible. This is a dangerous story, since serious volumes have already accumulated at the lows with a POC shift, which can lead to a reversal all the way back to the starting point.
Let us look at the higher TF (M15 and the outer M90 cluster).
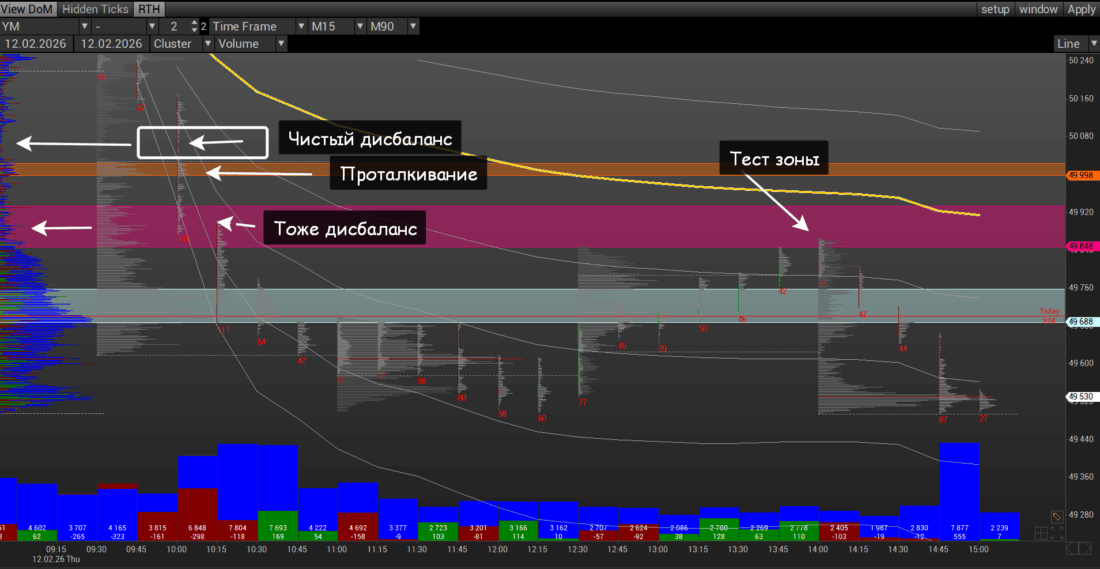
- First, it is necessary to find tactical zones of pure imbalance, that is, places where there was no trading.
- Second, it is desirable that VWAP enter this zone.
- Third, you need to see a reversal formation in the area of this zone.
You can try entering with a stop beyond this zone (in no case from the POC or the upper boundary of the current balance). The targets are either in the area of the double bottom or a little farther.
Second subtype
This subtype is quite complex, since in the first 30 minutes-1.5 hours the RTH session has a volatile or volatile-reversal appearance.
In the chart below is the ES futures contract (CME exchange), RTH session of February 12, 2026. M15 cluster chart, outer M90 cluster.
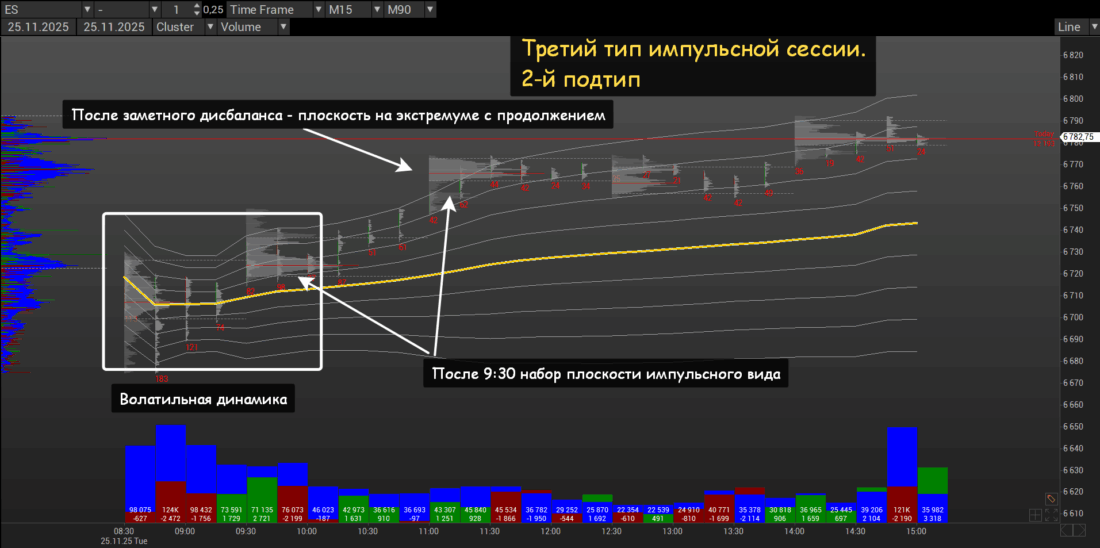
By 9:30 CT, volatility usually fades with volume accumulation in a flat area above/below the broad liquidity accumulation before that. After 10:00-10:30 CT, dynamics begin that take the form of an imbalance on the session cluster.
The dynamics last about an hour, after which the quote moves into a flat balance. After 13:30-14:00 CT, the final expansion occurs.
Let us move to the lower TF.
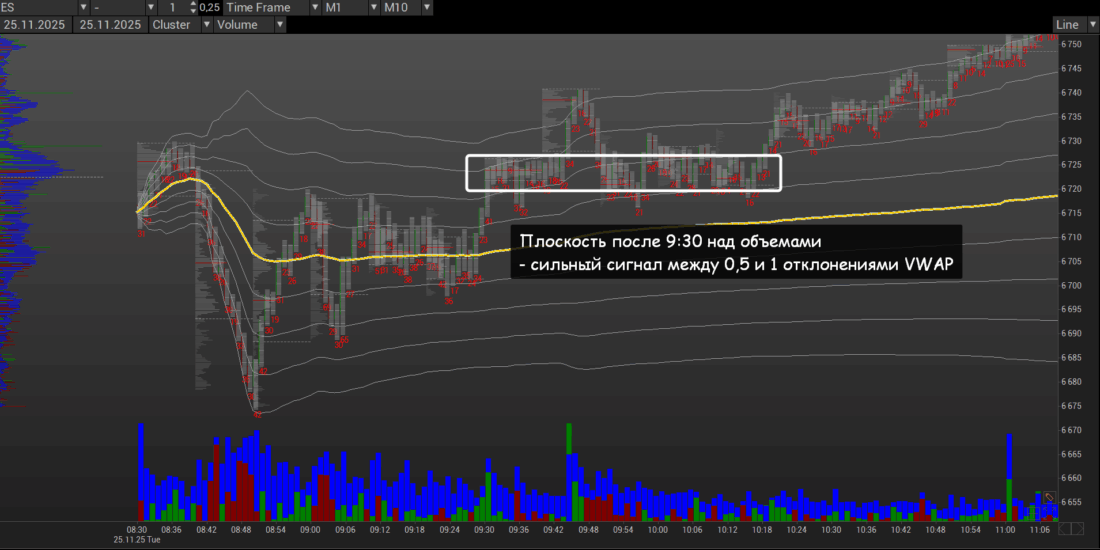
The flat area after 9:30 above the volumes is a strong signal and takes the form of an impulse, especially with accumulation between the 0.5 and 1 VWAP deviation and protection of the previous accumulation.
After 10:00 CT, new dynamics begin, as in the type 1 session. But the imbalance is usually stronger.
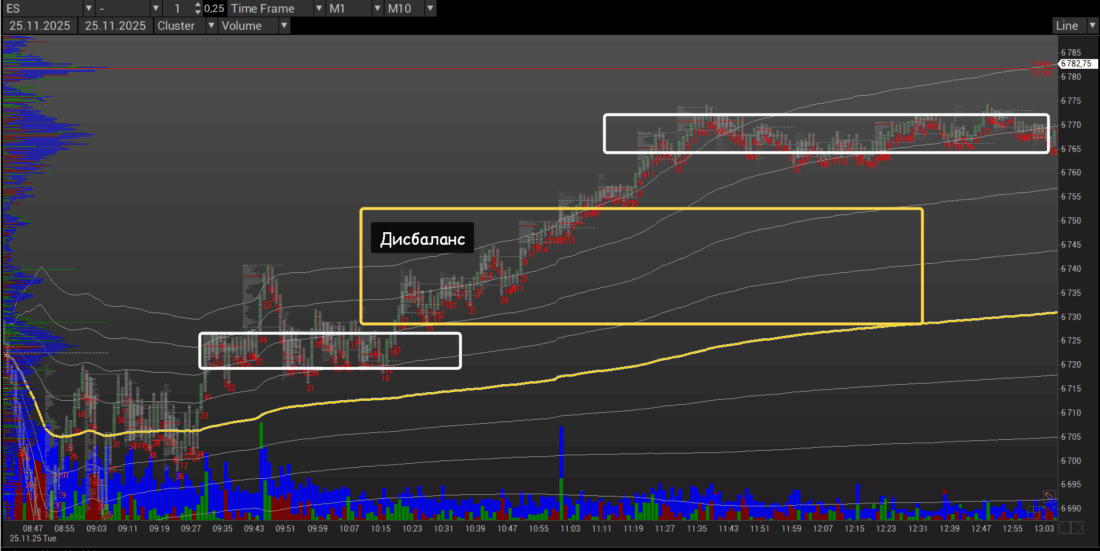
Then everything proceeds as in a session of the 1st or 2nd type with the same timing. Only the imbalance is greater specifically after 10:00 CT, rather than at the session open.
To sum up:
- The RTH session open is volatile, with the swings fading by 9:00-9:30 CT. In this case, a large player takes money from weak players and gathers the liquidity of robots operating in a highly volatile environment.
- The buildup of volatile volume in the initial balance around the average VWAP with sharp moves from -1 to +1 deviation.
- The loading of the main liquidity is from 9:30 to 10:00-10:30 CT. Sometimes one can wait until noon and later. Reloads along the way are flat.
- Movement in one direction after 10:15-10:30 and later between 2 and 3 VWAP deviations. This is the strongest imbalance within the session.
- The travel range is very large. The quote stops closer to the end of the session, where one can see a second accumulation within the main session.
- The vertical volumes of the current TF are high, and this is especially noticeable during the initial balance period (8:30-9:30 CT).
- The session closes at the extreme.
- Such sessions are often the first within an impulse on the higher timeframe.
How to trade it?
It is difficult to trade such situations with pending orders, since at the first stage it is unclear whether this is balance / volatility or preparation for an impulse. Trading is conducted on a sharp expansion into the same plane and a buildup of volume in the plane without any corrections.
Impulse Models: Conclusion
Good impulse session models occur 2-4 times a month on any instrument, not counting the impulse phase on the higher TF.
Such sessions should be expected after some buildup in a relative plane at the beginning of the timeframe (month or week) or closer to the middle of the timeframe (the 10-15th day of the month, Wednesday-Thursday).
If on Friday or Monday a session passes with a high average volume per tick, then on Monday or Tuesday one can expect an impulse or impulse-volatile session.
In addition to everything said, it is worth paying attention to one more small detail: a relative decrease in volumes on the working TF (M1 / M5) in the initial balance is a signal of the beginning of movement both in the impulse session model and in other models.