
How to Tell That an Expert Advisor Is Outdated?

Good afternoon, ladies and gentlemen, forex traders!
I often hear beginners ask questions about why a forward test is needed at all during optimization, how to evaluate the results obtained in testing and optimization, and how to compare test results with the real-time performance of expert advisors.
And the most important question: "How can you tell that an expert advisor is outdated, has stopped working as it should, and it is time to remove it from the account?"
Those are exactly the questions I will try to answer today.
Backtests and Real Trading
In practice, it often happens that a system that showed good results in backtesting is unable to generate profit in real trading. This is due to the specifics of backtesting conducted on historical data, to which the system adapts as a result of optimization.
Backtesting programs do not take into account some factors that affect trading success, for example the degree of an instrument's liquidity or competition from other market participants. A test does not allow for possible technical difficulties, which, leaving aside the issue of order execution speed, are most important for high-frequency trading and boil down to connection flaws, failures in the operation of brokers and the exchange itself. It is useful to keep the shortcomings of backtesting in mind in order to evaluate your system's capabilities soberly.

One of the stages of testing a system is its optimization, during which the robot adapts to historical data in order to achieve the best result. By changing the values of various algorithm parameters, almost any trading system can be made to show a profit on a known segment of price history. At the same time, the number of parameters used matters: a simple system using a small number of variables is harder to optimize, while each additional condition and parameter can improve the trading result. However, growing theoretical profitability does not mean that the system is getting better. The robot is simply being fitted more closely to historical data. By making the system more complex, you can achieve the result that it earns on every opportunity in open history, but in the market it will bring only losses.
The pinnacle of making trading systems more complex is neural networks, which have a very large number of parameters. A robot based on a neural network, having memorized a large amount of information, can adapt so strongly to historical data that it will simply use them in the future. Therefore, especially when it comes to complex systems with a large number of coefficients, the optimization process should be treated with caution.
A good system should show at least some positive result even without optimization, and if all profitability is achieved only through it, then the robot developer has reason to think. In the optimization process, in my opinion, it is not always worth stopping at the system coefficients at which the best profitability is achieved during backtesting. If a parameter value is very close to the edge of the positive range (for example, 7 with positive results from 5 to 20), then it makes sense to shift the parameter value closer to the middle.
Forward Tests

What is a forward test? It is a test of the system parameters obtained during optimization on another historical data sample, different from the optimization one. To put it simply, first we fit our settings to a piece of history, finding several of the best sets of parameters (this is called optimization), and then we check on a later piece of history whether those settings are still suitable or whether they are no longer relevant and the expert advisor has started to lose money with them. Many beginners neglect forward testing. I hope I have explained why it should not be neglected.
The best parameter set on a certain segment of history does not necessarily have to be the best on a later segment; everything may change a hundred times over. And I think it does not hurt to play it safe once again before installing an expert advisor on a live account and check whether the parameters still work, even if you are the son of an Arab sheikh and use dollars instead of napkins.
Contrary to established ideas, a forward test is not necessarily a check performed in the strategy tester. A forward test can also be carried out online on a demo or small live account. This approach has both pros and cons. The main drawback is that such testing takes a great deal of time. The advantage is that in this case the test readings are as close as possible to real indicators (in fact, these are the real indicators). That is, you will see exactly how the strategy behaves with this broker on this type of account.
In general, a forward test has as many as three main goals, not just one. The first two are important for following the testing procedure. The last one provides important and unique information about expected profit and risk for future trading on live accounts.
So, the main goal of the test is to understand whether the results obtained during optimization are real. The point is that a trading system developed correctly should make a profit not only on the optimization segment, but also afterward (during the forward period and in real time). But this does not always happen; some trading systems simply cannot pass a forward test and start losing immediately after the optimization period. Such systems are simply unworkable from the start, no matter how hard you try to optimize their parameters. Hence the rule: if you are going to use a system in real trading, it absolutely must pass forward testing.

The second goal of the test is to avoid over-optimization of the system's parameters. Quite often, if the optimization procedure is not followed, even a good system can be over-optimized. This can happen because of too many rules and filters, an excessive number of parameters being optimized, or too small an optimization step.
A forward test provides a measure of effectiveness called the forward efficiency ratio, which compares the annual rate of return during the forward period with the rate of return obtained during optimization. It is easy to identify parameter over-optimization precisely by comparing annual rates of return: if they differ greatly, you are dealing with over-optimization.
And here we come to the third goal of forward testing: measuring the system's profitability and risk in order to determine investment expectations. An ideally designed and optimized system will have profit and risk figures on the forward period and in subsequent trading similar to those during the optimization period. If the rate of return on the forward test differs significantly from the profit on the forward period or in real time, such settings are not suitable. I hope you now have no questions left about the value of forward testing.
Tests on Demo Accounts and Tests on Real Accounts

Many people try to test expert advisors on demo accounts. Quite often you can hear: "I'll run this expert advisor on a demo." If you really intend to use a given expert advisor on real accounts, you should not do that.
First, there are no execution problems on demo accounts. Most brokers configure their demo servers so that a trader does not experience problems with slippage and requotes. As a result, it often happens that a robot works perfectly on demo, but when installed on a real account it starts losing money.
Second, quite often the broker provides a "better spread" on demo accounts. When opening a demo account, you will most likely receive quotes with the minimum possible spread for that broker. Thus, the impact of this factor can strongly affect your view of the expert advisor's overall profitability.
And third, when working with demo accounts, you do not experience psychological pressure. This factor also has a positive effect on account profitability.
Therefore, it is best to test expert advisors on small real accounts; in most cases 100-200 dollars is enough. Moreover, many brokers now offer cent accounts. Still, ideally, you should try to test expert advisors on the very servers on which you intend to trade later.
Main Indicators of Trading Systems

Now we will look at the main indicators of trading systems, consider whether it is worth paying attention to certain indicators, and how important they are.
Maximum Drawdown

Running any business requires costs. Forex is the same kind of business as all the others, and the costs of trading profit here are determined by risk and margin.
Maximum drawdown is the magnitude of the deepest decline in the trading account's equity curve before it reaches a new maximum. Psychologically, it is very hard to endure large drawdowns in real trading. When selecting sets, I usually do not consider results with a drawdown of more than 15-20%. When calculating money management, I try to achieve a maximum drawdown on one pair of no more than 10-15%. When working with large sums, the recommended maximum permissible drawdown on the account is no more than 5%. Judge for yourself how pleasant it is to lose 20% on a ten-million account over a couple of months. Not everyone's nerves are that strong, and at times doubts arise about the trading system being used. The higher the maximum drawdown, the greater the psychological pressure experienced by the trader.
Trading is needed in order to make money. A series of losing trades hits the trader's ego, throwing them off balance and forcing them to make rash decisions. This, of course, applies more to manual trading, but even when trading with robots, algo traders monitor the state of their accounts, so it is still impossible to completely get rid of the psychological factor in algotrading (although the influence of this factor is greatly mitigated by removing the need for the trader to make trading decisions). Still, if the trader is not psychologically ready to accept such drawdowns, it is better to define acceptable limits in advance, before setting out, by properly adjusting the EA's lot size.
Required capital

Required capital is the minimum amount of money for trading an expert advisor. Knowing the maximum drawdown and properly setting money management, we can determine the amount of minimum investment for trading the expert advisor. Our task is to allocate such an amount of money that, with the configured money management, we can fairly calmly, without unnecessary nerves, withstand at least 1.5 maximum drawdowns. Some professional traders protect themselves by assuming 3 maximum drawdowns.
Number of trades

Each type of trading system has its own statistically meaningful number of trades. For intraday trading this is usually from 200 to several thousand trades per year. For trading on D1, the number of trades per year may be as low as 10. In any case, it is worth remembering that the more trades there are in the statistics, the more reliable the result is considered to be. As a rule, the minimum number of trades for evaluating a system's parameters is considered to be one hundred.
Average profit per trade

When developing a trading system, it is very important to pay attention to this indicator. The higher the average profit per trade, the better. Sometimes it happens that in tests, when trading with a lot of 0.1, the system gives 3-5 dollars of profit per trade. Having evaluated all the other parameters, the trader decides to put the system on a real account. After some time, it turns out that the system is losing money.
When evaluating the statistics of the real account, it turns out that the average profit per trade is in negative territory. How did that happen? It is simply that the testing was carried out with a spread of two pips and without taking reality into account. But the real spread turned out to be 3 pips higher than planned, and as a result only 2 dollars remained from the average profit per trade. And they also forgot to account for slippage, which "ate up" two more pips. Plus the commission, which they forgot about altogether. And in the end the average profit came to minus one dollar.
Average profit per trade is an important parameter and, so as not to frantically search for a broker on which "this" will work profitably, when testing it is worth targeting values no lower than 10 pips (10 dollars per trade with a 0.1 lot), and preferably more.
Percentage of winning trades

I have already written a lot about this, but I will repeat myself once again. Many professionals work with a percentage of profitable trades of 50, 40, and even lower. But this is psychologically very difficult and not everyone can withstand such trading. As a rule, a low percentage (below 50%) is explained by a high ratio of the size of the average winning trade to the average losing one - from 3 to 1 and higher. Such a balance is typical of long-term trend trading systems. For scalping and intraday systems, as a rule, a value of 60-70 percent and even higher is typical, but the profit-to-loss ratio there is usually no higher than 1 to 1. On the other hand, such systems are traded more comfortably, and their equity curves look smoother. Nevertheless, finding such a system while also having stability is extremely difficult - at times trading with a percentage of profitable trades below 50% turns out to be less costly in terms of time.
Profit evaluation

After you have compared the average annual profit of the trading system with other investment instruments you use and have decided whether it makes sense to use the system in this regard, it is time to evaluate the trading system in relation to risk and required capital. An annual profit of 100K $ is cool, but if 2 million on deposit is required to obtain it, that is only 5% per annum, which is no longer so cool. At the same time, if the maximum drawdown is 25%, which corresponds to 500K $ or a return-to-risk ratio of 1 to 5, that is about as bad as it gets.
Conversely, if 100K is required for the same profit with a risk of 10% or 10K, then the return-to-risk ratio is already 10:1. And that is simply a fabulous result.
Return/risk ratio (Risk Adjusted Return - RAR)

The examples above suggest the correct idea that the system's return should be evaluated taking into account the risk required to obtain that return. The return-to-risk ratio (reward to risk ratio) is exactly such an indicator. It compares the maximum annual return with the maximum drawdown that was allowed.
For example, an annual return of 25 000$ with a drawdown of 5 000$ will give a reward to risk ratio equal to 5. As a rule, the higher this ratio, the better. Many trading systems have this indicator from 5 to 10.
Return on capital

In general, profit should be considered as return on investment. It is calculated simply: it is enough to divide the annual profit by the minimum required capital.
Here is an example: we have a system that gives a maximum drawdown of 10 000$ and an annual profit of 40 000$. The return-to-risk ratio is quite good; it equals four. For example, we are ready for drawdowns of 20%, and then we will take the drawdown in the test as 10% (a double safety margin). Then the minimum capital for trading will be 100 000$. By investing 100 000$, we will receive 40 000$ in a year, or a return equal to 40% per annum.
The advantage of considering return in annual terms lies in the ease of comparison. This is a generally accepted standard that also makes it easier to compare a specific trading system with others.
System efficiency ratio

This method of comparing the profits of different systems considers the profit from a system in the context of the current market's opportunities. In different periods, markets have greater or lesser potential for generating profit, and it would be quite logical to pay attention to this when comparing indicators.
Here it is worth introducing one more definition. Potential market profit is the profit that can be obtained by buying every bottom and selling every top over the time segment under consideration (usually a year).
Naturally, no trading system is capable of squeezing everything out of the market. Therefore, we can introduce a special coefficient - the efficiency ratio of the trading system. This is the measure of how effectively the system converts the potential profits offered by the market into real trading profits in the trader's account. For example, suppose that the net profit of the system is 25 000$, and the potential profit is 300 000$. Then the system's efficiency ratio is equal to (25/300) = 8.33%. This is quite good performance. On average, fairly good trading strategies have a ratio of 5% and above.
The efficiency ratio greatly facilitates the comparison of systems for different markets and in different periods. Markets are constantly changing, and the indicators a system had in the past may never be repeated. At the same time, the system efficiency ratio is a fairly reliable indicator. An efficiency ratio that remains at a consistently high level from year to year is an indicator of the stability and high quality of a trading system and suggests that no matter how the market changes, the system continues to extract profit from it on a constant and stable basis.
Profit factor

Instead of judging a system by average annual profit, it is more convenient to consider a parameter such as profit factor. In essence, this coefficient is another attempt to measure the efficiency of a trading system. Profit factor is the quotient obtained by dividing total profit by total losses. For example, a profit factor equal to 1.5 may indicate that the system on average loses 2 for every 3 dollars of profit (3/2 = 1.5). A value above 1 indicates that the system can make money. The higher this parameter is above one, the more efficiently it does so. It is advisable not to consider systems with a profit factor below 1.3 and ideally to strive for a value of 1.6.
Trading stability

Trading stability is the most significant characteristic of a trading system. The more stable a trading system is in all respects, the better. And conversely, the more chaotic and unstable the system is, the more dangerous it is and, consequently, the more doubt it should raise. Agree that when the results are very erratic and it is hard to guess whether you will get a profit of 80% this year or whether in the last month of the year the system will lose everything and go into the red, that is not the best state of affairs. Let us figure out how trading stability can be measured and what indicators are used for this.
Distribution of profits and losses

The uniformity of the distribution of profits and losses in the test and forward sample is the most important indicator of stability. Net profit alone, which the system produced, says nothing about its stability. After all, all the profit could have been obtained in just one month of the year, while the rest of the time the system was losing money. It is precisely the distribution of profits and losses over time that gives a good idea of how much you will have to worry when using the system.
Let us suppose that over five years the system has a profit of 50 000$ with a drawdown of 10 000$. For example, as shown in the table:
| Year | Profit | Drawdown |
| 2013 | 50 000 | 5 000 |
| 2014 | 30 000 | 6 000 |
| 2015 | 10 000 | 7 000 |
| 2016 | - 15 000 | 9 000 |
| 2017 | - 25 000 | 10 000 |
The greatest profit was in the very first year, and the greatest loss was in the last. Moreover, if we plot the equity curve, we will see a declining curve. What is even worse, annual drawdowns are growing. This trading system prospered in the first two years, after which it has clearly been draining capital for several years now.
Or another example:
| Year | Profit | Drawdown |
| 2013 | -15 000 | 5 000 |
| 2014 | 110 000 | 10 000 |
| 2015 | -15 000 | 7 000 |
| 2016 | -15 000 | 6 000 |
| 2017 | -15 000 | 4 000 |
Even at a quick glance at the table, it is clear that all the profit was obtained in 2014. All the rest of the time the system was steadily losing money. This alone is already enough to reject such a strategy.
And the third example:
| Year | Profit | Drawdown |
| 2013 | 10 000 | 7 000 |
| 2014 | 5 000 | 10 000 |
| 2015 | 10 000 | 6 000 |
| 2016 | 10 000 | 5 000 |
| 2017 | 15 000 | 4 000 |
In all three examples, the final profit amounted to 50 000$ with a maximum drawdown of 10 000$. But pay attention to how even the result is in the last case. In addition, the system shows a pleasant upward direction and a reduction in drawdown. Moreover, the system had its maximum drawdown in the most distant period of operation. All this indicates quite satisfactory robustness of the trading system.
Here is another example:
| Year | Profit | Drawdown |
| 2013 | - 25 000 | 10 000 |
| 2014 | - 15 000 | 9 000 |
| 2015 | 10 000 | 7 000 |
| 2016 | 30 000 | 6 000 |
| 2017 | 50 000 | 5 000 |
This example is the inverse of the first one. Such a variant, despite the clearly improved metrics, most likely is not suitable either. But if there is still a strong desire to use it in trading, then first of all it is necessary to find the answer to the question: why did it work so poorly before and work so well now? Perhaps this is a temporary factor and some time after the system is launched it will already have exhausted itself.
In general, one should be guided by the following rule - the more even the results, the better. If profitability has a trend, it should be moderately upward, not the other way around. At the same time, any trend should be justified.
Trade Distribution

Trade distribution is usually calculated in exactly the same way as the distribution of profits and losses over a certain period of time. The more even the distribution, the better, of course.
The best strategy is the one whose profits and losses are distributed evenly across the entire period. But you will never achieve perfect uniformity. Therefore, it is important to make sure at least that the main profit was not obtained as a result of one or several series of successful trades.
By the way, series of winning and losing trades should also be distributed evenly across the entire segment. The smaller the standard deviation, the more predictable and stable the trading result.
So, a stable trading system has the following properties:
- the most even distribution of profits and losses;
- the most even distribution of wins and losses;
- the most even distribution of series of wins and losses.
Maximum Drawdown

Maximum drawdown plays a decisive role in assessing the risk of a trading system. It should be assessed relative to other losing streaks generated by the trading system. By definition, maximum drawdown is the largest losing streak of trades, but it is also important to know how much larger this streak of trades is than the others. For example, if the maximum drawdown is greater than all the other drawdown periods by only 20-40%, this can serve as additional evidence of the system's robustness.
If your maximum drawdown is 300% of the average drawdown, that is a rather bad sign. Unless, of course, something like this was caused by objective reasons such as a stock market crash or other force majeure events. Such events are practically impossible to predict and they often lead to significant losses, so one should at least try to protect against force majeure. This is done by implementing special algorithms in the strategy that limit maximum losses.
Largest Winning Streak

It should be assessed in the same way as the largest losing streak. It should be compared with the average winning streak. In addition, the largest winning streak should not provide a disproportionately large share of the strategy's total profit.
Additional Statistical Tools for Evaluating Trading Performance

To evaluate the trading performance of systems, various coefficients are often used. They allow you to look at the trading result through the lens of certain factors. Many of these coefficients have already been discussed, so I will give only a brief description of them. Some have not yet been discussed and I will dwell on them in a bit more detail.
Sharpe Ratio

Investment efficiency is often assessed from the point of view of the dispersion of returns. One such indicator is the Sharpe Ratio. This ratio shows how the arithmetic mean AHPR, reduced by the risk-free rate, and the standard deviation SD from the HPR series are related. The value of the risk-free rate RFR (Risk Free Rate) is usually taken to be equal to the interest rate on a bank deposit or the rate of return on treasury obligations.
You can get acquainted with this ratio in more detail here.
Profit for the Holding Period of a Trade (HPR)

In his book "The Mathematics of Money Management," Ralph Vince uses the concept of HPR (holding period returns) - profit for the holding period of a trade. A trade that brought 10% profit corresponds to HPR=1+0.10=1.10. A trade that brought a loss of 10% corresponds to HPR=1-0.10=0.90. Another way to obtain the HPR value for a trade is to divide the balance value after the trade is closed (Balance Close) by the balance value at the moment the trade is opened (Balance Open):
HPR=BalanceClose/BalanceOpen
Thus, each position corresponds not only to the result of the trade in monetary terms, but also to HPR. This makes it possible to compare systems regardless of the money management used in each specific case. One indicator of such a comparison is the arithmetic mean - AHPR (average holding period returns).
Along with the arithmetic mean, Ralph Vince introduces the concept of the geometric mean, which we denote as GHPR (geometric holding period returns), which is almost always less than the arithmetic mean AHPR.
A system with the highest geometric mean will bring the greatest profit if you trade on the basis of reinvestment. A geometric mean of less than one means that the system will lose money if you trade on the basis of reinvestment.
Expectancy

The mean can be calculated not only for a sample, but also for a random variable if its distribution is known. In this case, the mean has a special name - Expectancy. Expectancy characterizes the "central" or average value of a random variable.
For profitable trading, expectancy should be higher than zero plus all overhead costs per trade (such as the spread, swaps, slippage, commissions, and so on). You can read more about expectancy here.
Standard Deviation

We already discussed standard deviation above when we talked about the stability of a trading system. This value shows the dispersion of values relative to the mean. The smaller the value of the standard deviation, the more stable the result will be; the higher the value, the lower the probability that you will get a return close to the mean. Now that we understand what standard deviation is, let us move on to a more detailed consideration of this characteristic.
For trading accounts, three mean values are often used: average return for a certain period, average profit, and average loss. Then it is logical to calculate three standard deviations for each mean as well: the standard deviation for average return, the standard deviation for average profit, and the standard deviation for average loss.
Average return is defined as the sum of profits and losses divided by their number; this value shows the most probable return value that an account can bring over a certain period of time. The standard deviation for average return generalizes profits and losses. If we assume that the return distribution of the system follows a normal distribution, then with a probability of 95% the value of potential return will be within the range of two standard deviations from the mean result.
By analyzing the standard deviation from average profit, you will be able to know what spread of profit there is relative to the mean. The smaller the standard deviation, the closer the expected result is to the mean, and the more stable it is.
MAE and MFE Parameters

Looking at the final trading result, which shows the outcomes of trading operations, we cannot draw any conclusions about the presence of protective stops (Stop Loss) or about the effectiveness of taking profits. We see only the position opening date, the closing date, and the final result - profit or loss.
Without information about floating profit over the lifetime of each trading position and across all positions as a whole, we cannot judge the nature of a trading system. How risky is it, how was the profit achieved, was paper profit left on the table? The MAE (Maximum Adverse Excursion) and MFE (Maximum Favorable Excursion) parameters can give us sufficiently complete answers to these questions.
Each open position experiences constant profit fluctuations until it is closed. Every trade reaches a maximum profit and a maximum loss between opening and closing. MFE shows the maximum price movement in a favorable direction. Accordingly, MAE shows the maximum unfavorable price movement. It would be logical to measure both indicators in points, but if trading was conducted on different currency pairs, then a monetary value can be used to bring them to a common denominator.
Each closed trade corresponds to the result of that trade and two indicators: MFE and MAE. If a trade yielded a profit of $100, but its MAE (the maximum floating loss during the life of the position) reached -$1000, that does not reflect well on the trade. The presence of many trades with a positive result but large negative MAE values for each trade tells us that the system sits through losing positions, and sooner or later such trading is doomed.
Likewise, information can be obtained from MFE values. If a position was opened in the correct direction, MFE (the unrealized maximum profit) for the trade reached $3000, but the trade was ultimately closed with a result of only +$500, we can say that the unrealized profit protection system should be improved. This could be some kind of trailing stop (Trailing Stop) that we can pull up behind the price when it moves favorably in our direction. If undercaptured profit is systematic, then the trading system can be significantly improved. MFE will tell us this.
The Technique for Calculating an Assessment by the Van Tharp Method

Van Tharp proposes measuring the quality of the evaluated system as the ratio of mathematical expectation to the standard deviation of trade results:
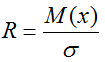
where M(x) is the mathematical expectation,
σ is the standard deviation.
The resulting R value is classified as follows:
less than 0.16 means very low quality,
from 0.16 to 0.20 means low,
from 0.20 to 0.25 means average,
from 0.25 to 0.30 means good,
from 0.30 to 0.50 means excellent,
from 0.50 to 0.70 means outstanding,
0.70 and above means a holy grail.
Thus, the greater the mathematical expectation of the system and the smaller its standard deviation, the higher the quality of the system.
In our case, the mathematical expectation is the simple average of all trades:
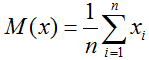
where xi is the result of the i-th trade,
n is the number of trades made by the trading system.
The standard deviation is the square root of the variance:

And as for how to find the variance, we have already gone over that a hundred times.
The Technique for Calculating an Assessment by the Sortino Ratio

The Sortino ratio is the ratio of mathematical expectation to the standard deviation of trade results with negative returns:
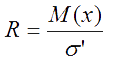
where M(x) is the mathematical expectation,
σ' is the standard deviation for negative returns.
The resulting value is classified as follows:
less than 0.24 means very low quality,
from 0.24 to 0.30 means low,
from 0.30 to 0.38 means average,
from 0.38 to 0.45 means good,
from 0.45 to 0.75 means excellent,
from 0.75 to 1.00 means outstanding,
1.00 and above means a holy grail.
The standard deviation for negative returns is the square root of the average value of the sum of squares of losing trades:
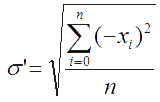
When calculating the deviation value, one important point should be taken into account: profitable trades are not excluded from the calculation; their values are replaced with zeros. This affects the number of trades (n) in the formula.
So how can you tell that the system no longer works?

Understanding that the system no longer works is very important for a trader. What should you do if the account is experiencing a prolonged drawdown? Has the system stopped working and is it time to take it off the account? Or is the drawdown period about to end? Many traders, especially beginners, have absolutely no plan of action for such a case.
Many experienced traders will say that they plan to wait for some period of time, and if the system does not begin to come out of the drawdown, then decide that it no longer works. Another popular approach is to wait for a drawdown twice as large as the one shown in the tests. But how correct are both of these approaches? Are they supported by statistical data? How long exactly should one wait? Why exactly a double drawdown and not, say, a triple one? There are no statistics on this, it is simply customary to do so.
And still, how can you understand that the system is broken? With the help of old methods that have not been statistically verified, or is it still worth thinking a little? For a change, let us try the second option.
And we will begin by thinking about what it actually means when a system stops working. Well, it means that it no longer works, it does not work the way it was designed to. All we need is simply to compare whether the system works the same way as it did in the tests.
But which parameter should be compared? We have considered quite a lot of characteristics, but to assess whether the system is working, one main one should be singled out: the distribution of our trades on the real account compared with this distribution in the test. All you need to check is whether the sample of live trading trades is part of the sample from the tests. If you can reject the hypothesis that this is so with a certain confidence level (usually 95%), then your system is no longer trading the way it was intended. This means it is broken and you can safely remove it from the account.
Using this criterion is a very powerful tool. After all, in this case you rely on a science such as statistics. And it is a trader's best friend. And there is no need to wait another 1.5 months, wondering whether the system will come out of the drawdown. There is no need to wait for two test drawdowns while losing money. Simple calculations in Excel (which we literally performed in 10 minutes in one of the lessons of the ExcelTrader course) and you already have a clear, statistically confirmed, scientifically grounded decision as to whether it is worth removing the system from the account.
So, what will you need for this?
First, you need to test the system on historical data. To do this, you can simply use any strategy tester and then transfer the tester data, for example, into Excel for further analysis. The most important thing is to obtain the results of the trades themselves: profits and losses.
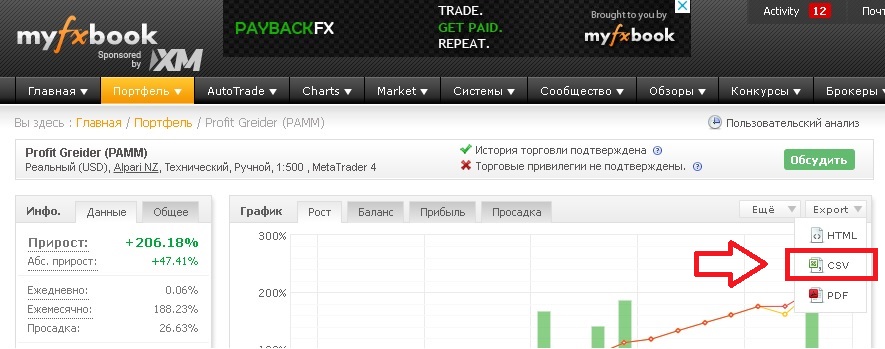
Second, you need the data that you will be checking. Many of you probably have account statistics on myfxbook. In the upper right corner of the account growth chart there is an "export" button. By clicking it, you will see a drop-down menu where you need to choose the format of the data to be saved. For our purposes, the csv format will do:
Open the resulting file and prepare the data:
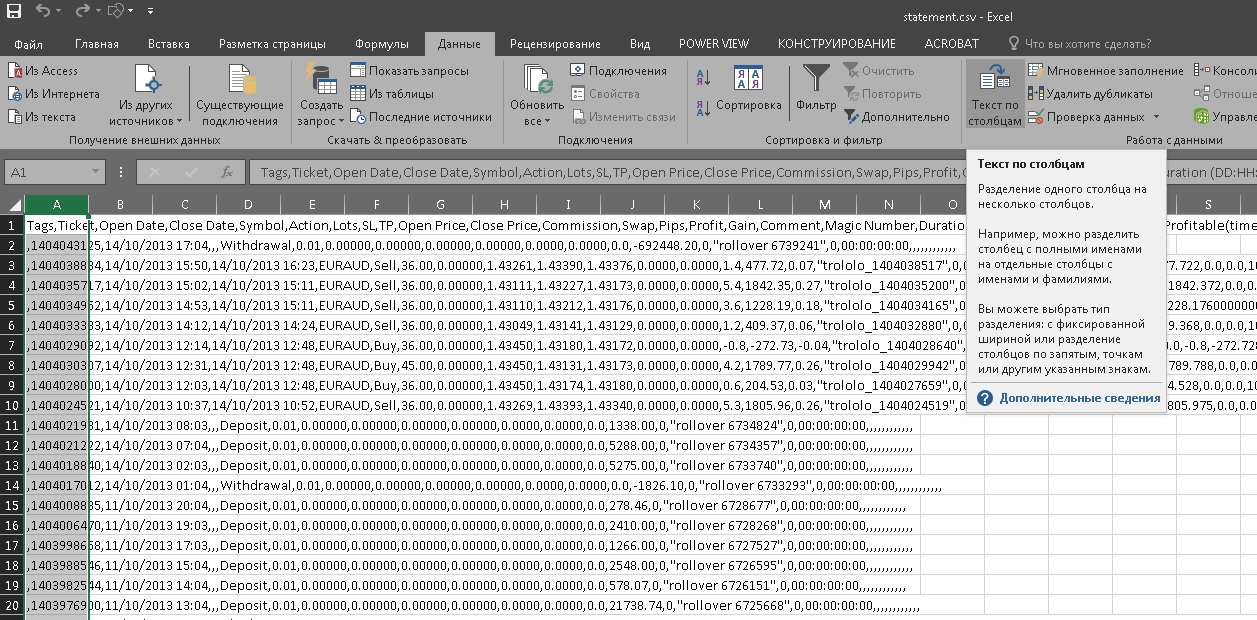
By clicking "Text to Columns", we get into the text parsing wizard. Let us choose the delimiter option:
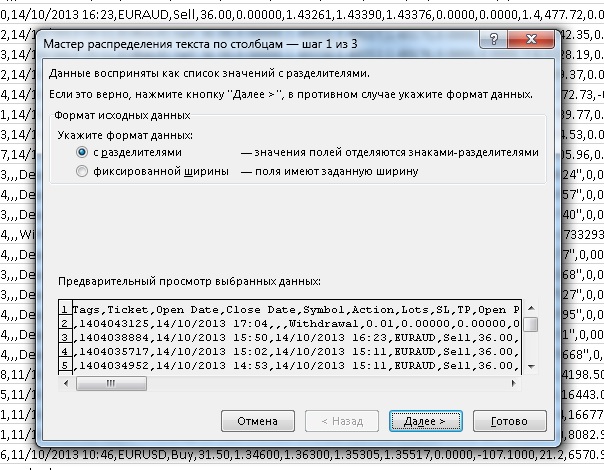
The myfxbook service uses a comma as the delimiter:
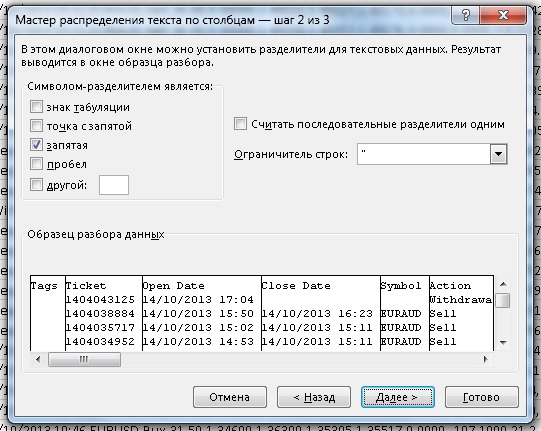
Next, finish the wizard and convert the resulting data into a table:
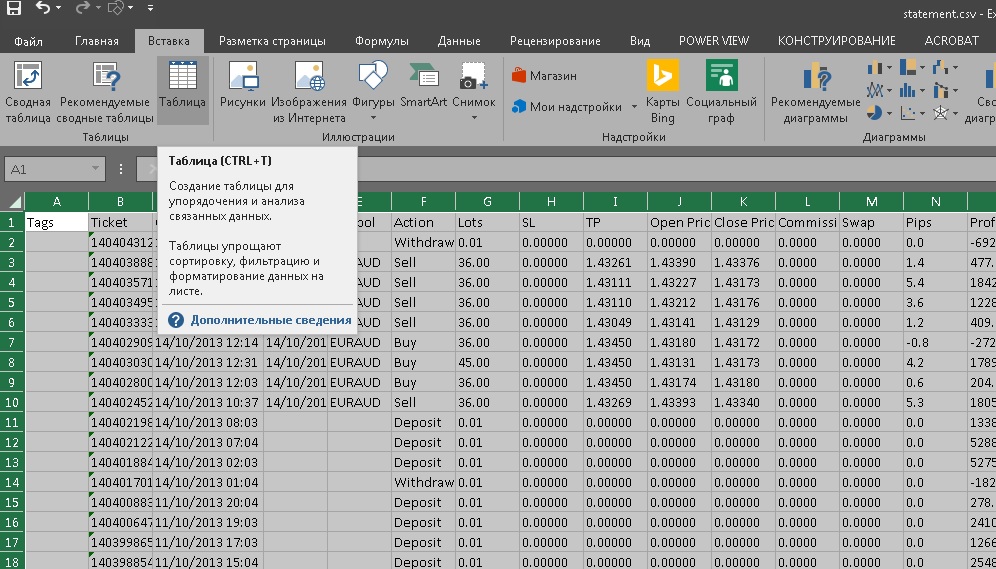
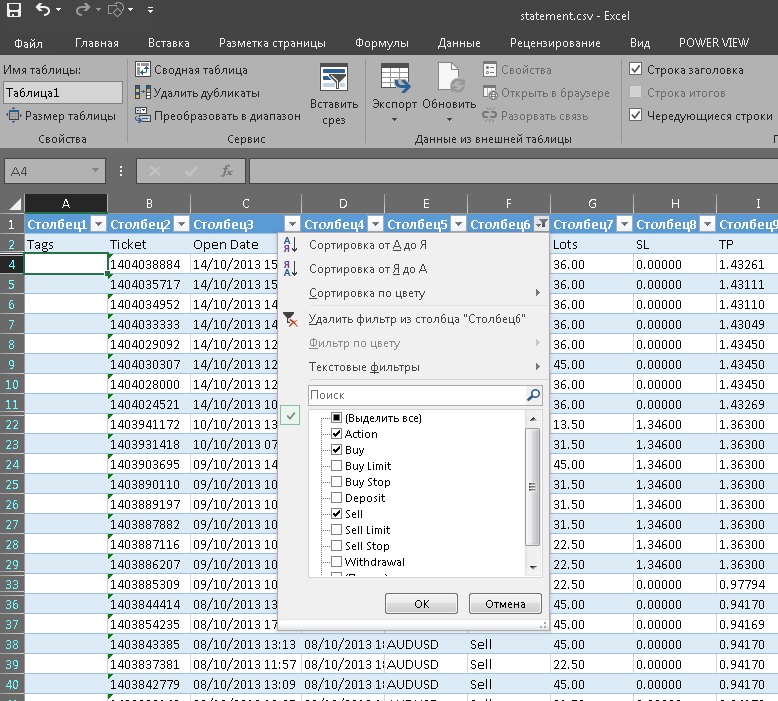
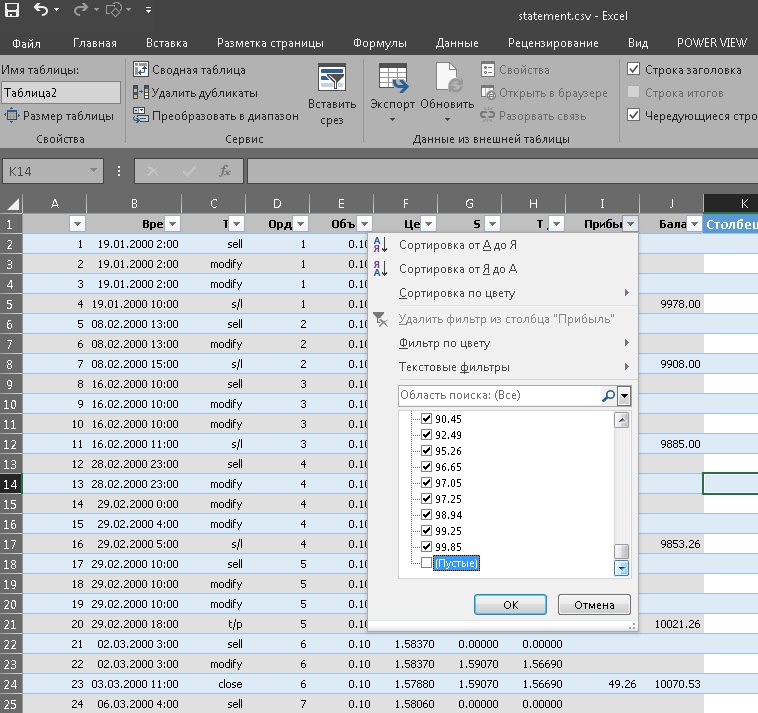
Now we will be able to sort the data by values and hide the rows we do not need. Find the "action" column and set the checkmarks in the filter as follows:
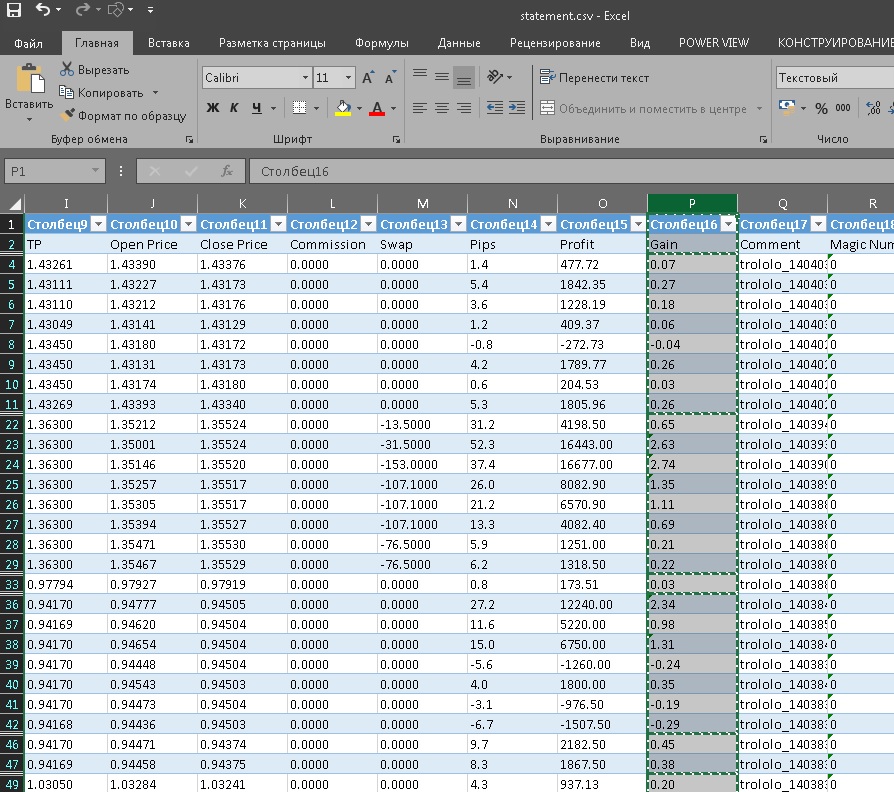
Now find the "gain" column, copy it, and move it to a new sheet:
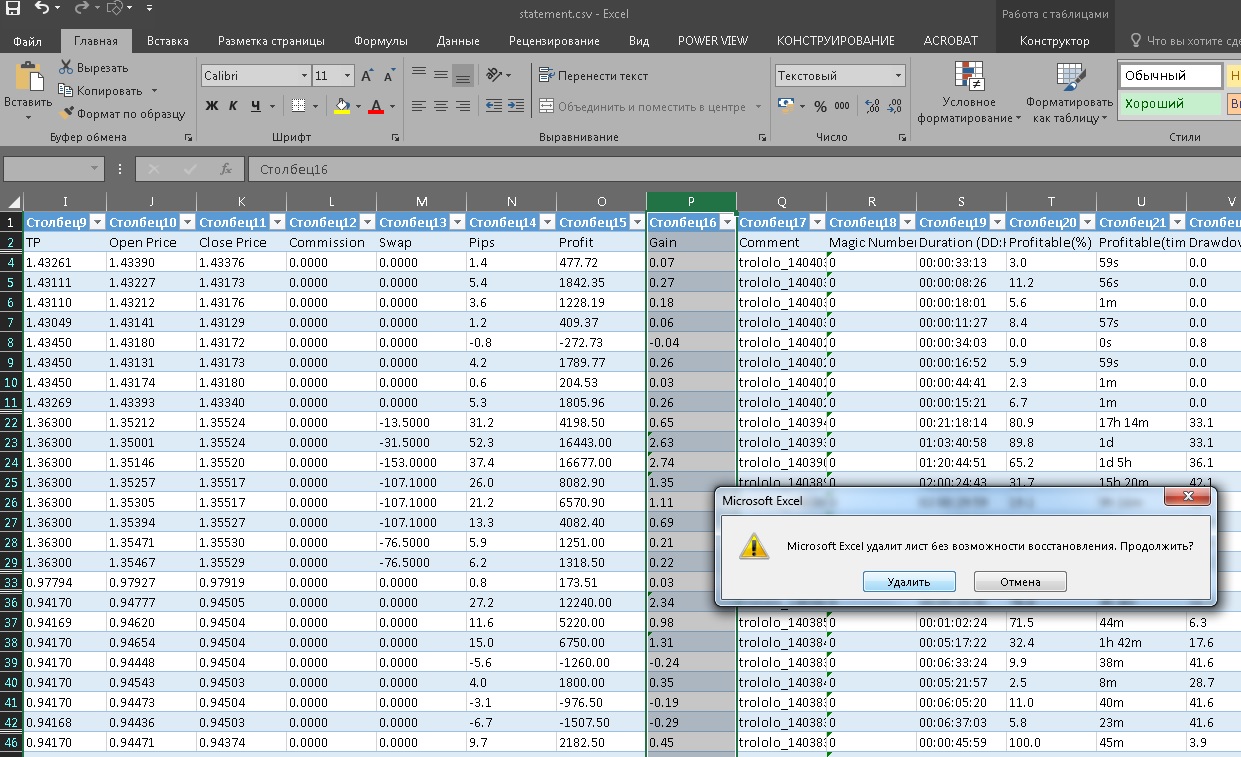
We no longer need the statement sheet, so let us delete it:
Now open the file with the test results from the MetaTrader terminal:
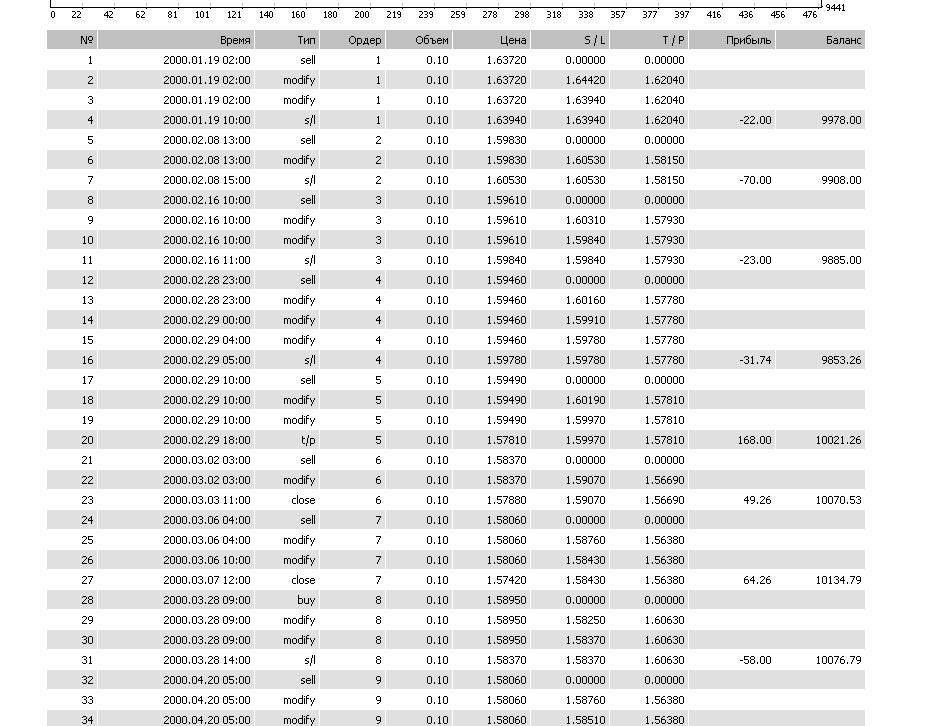
Press ctrl+a and ctrl+c to select all the lines in the file, then ctrl+v on a new sheet in Excel:
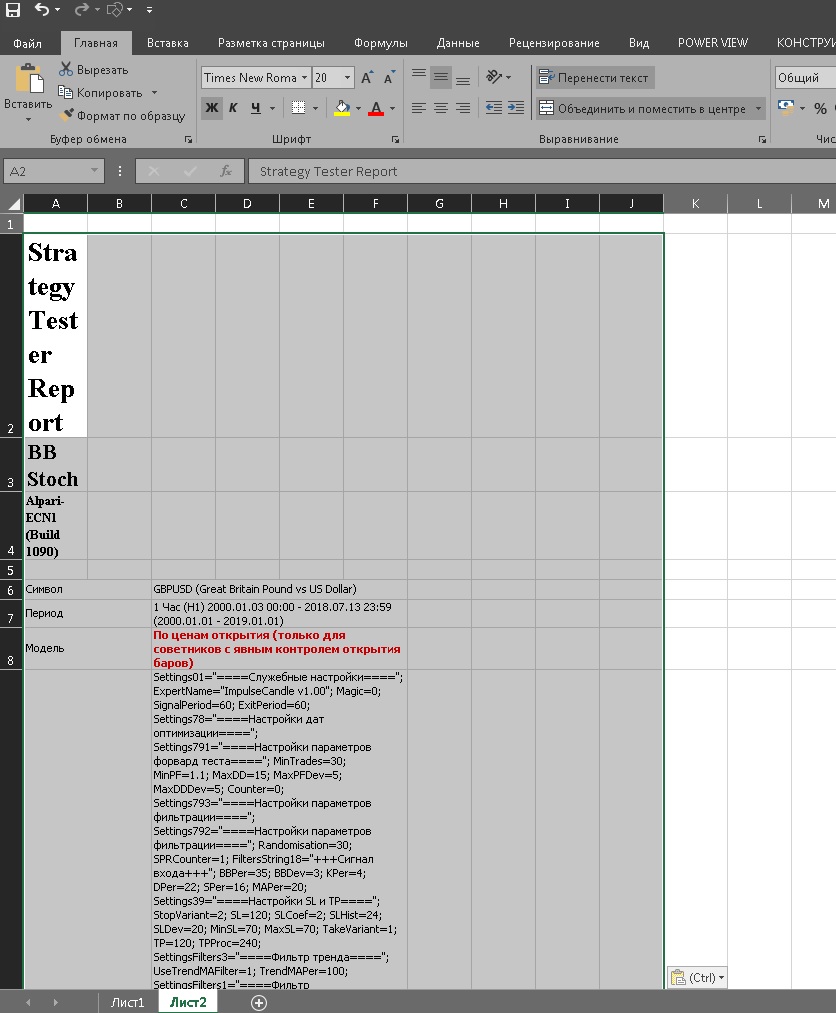
Delete the header, leaving only the rows with trades:
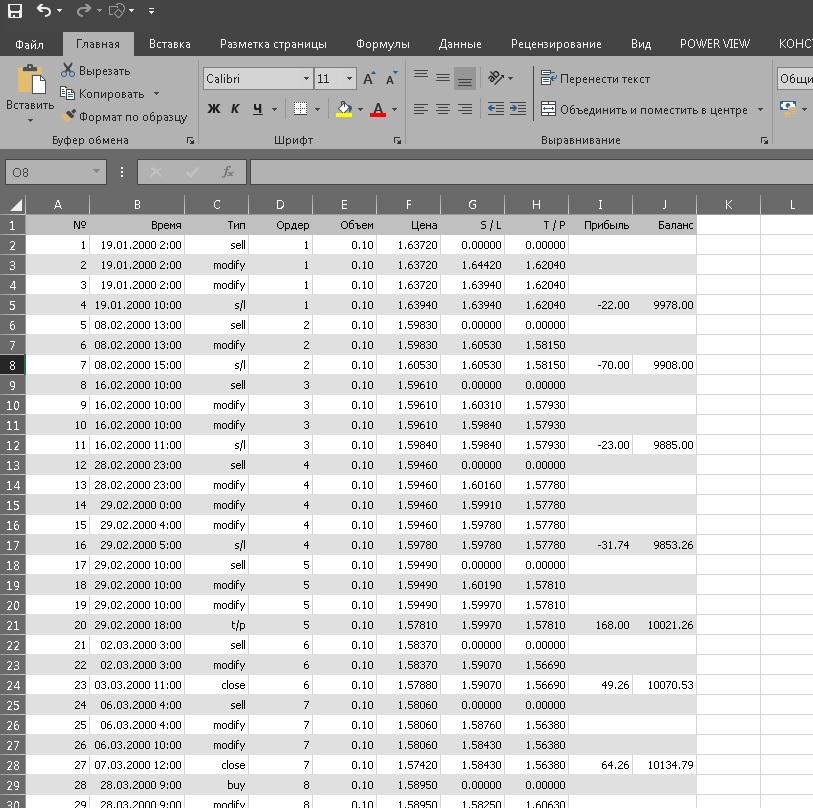
Convert the data into a table:
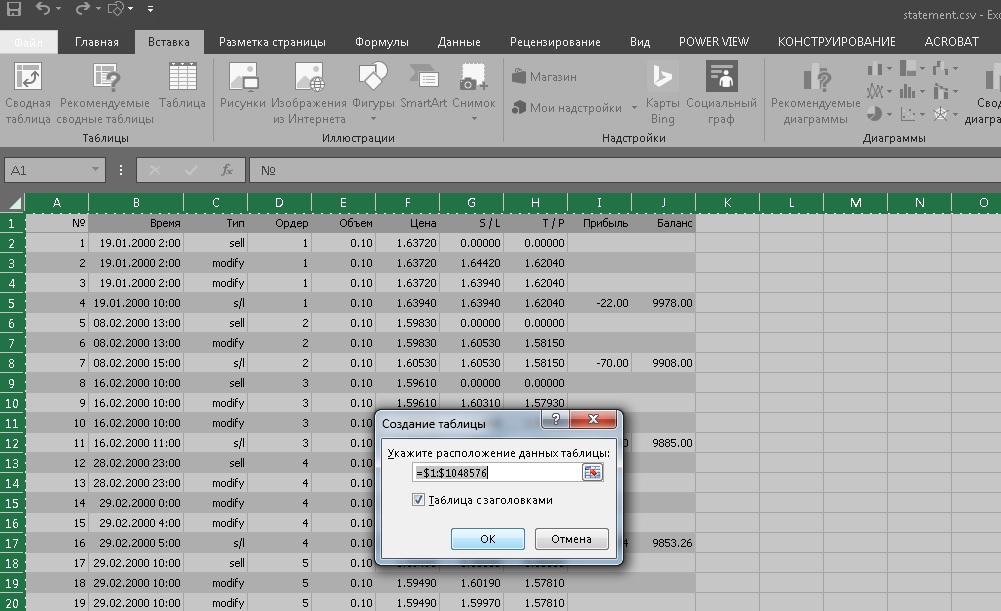
In the filter of the "Profit" column, remove the checkmark from the empty rows:
Copy the "Profit" column:
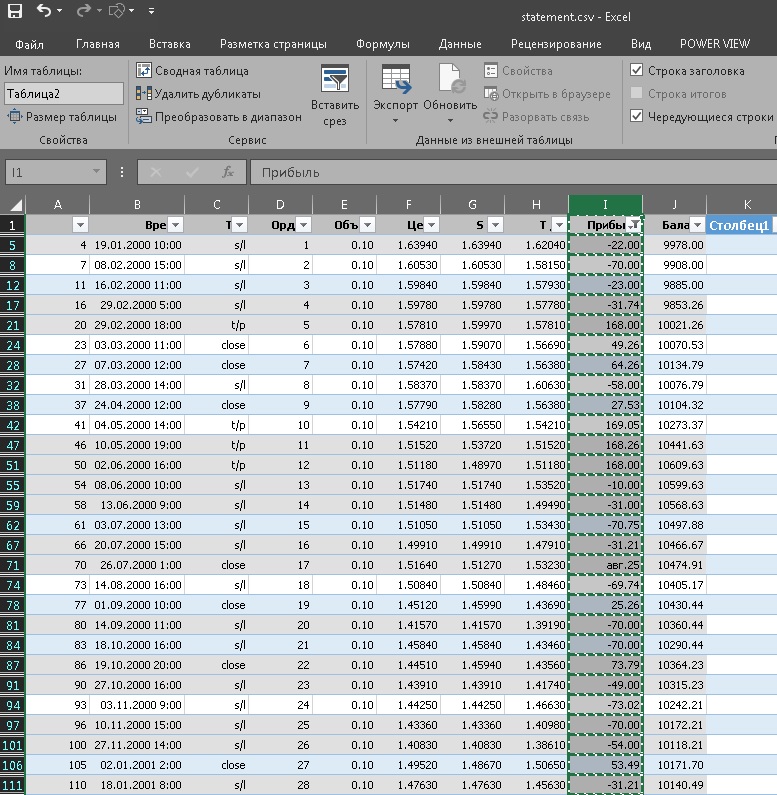
And move it to the sheet where the prepared column with trades from the real account is already located:
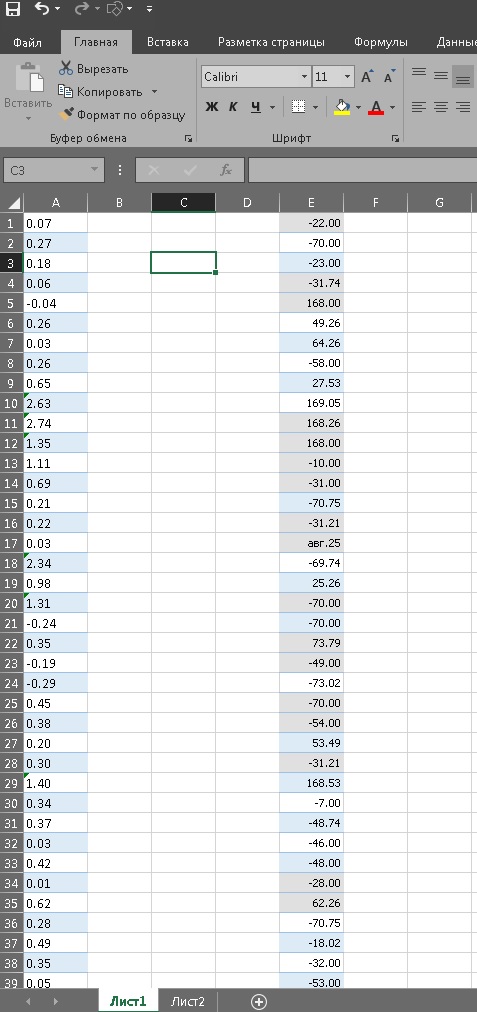
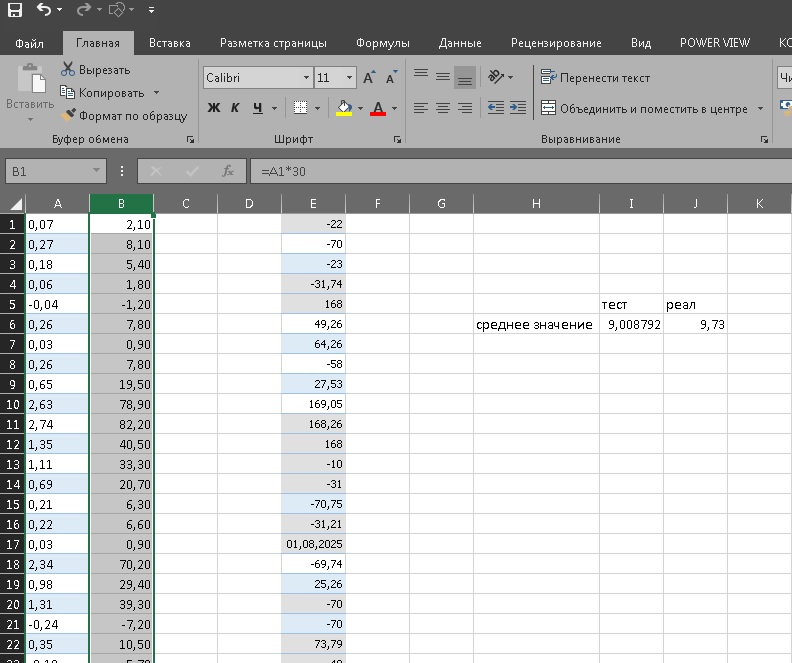
So, these are the two columns we will compare. First, calculate the average value for the test values:
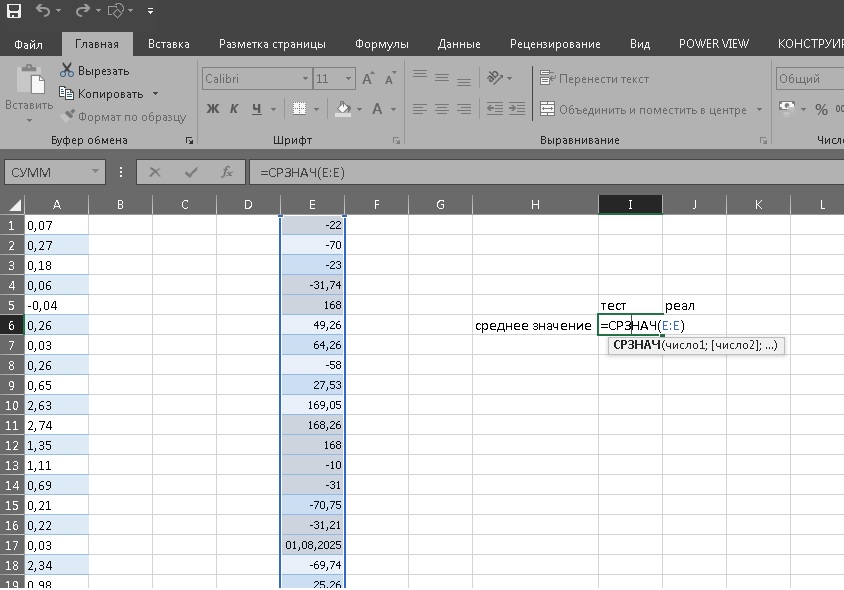
And for the real ones:
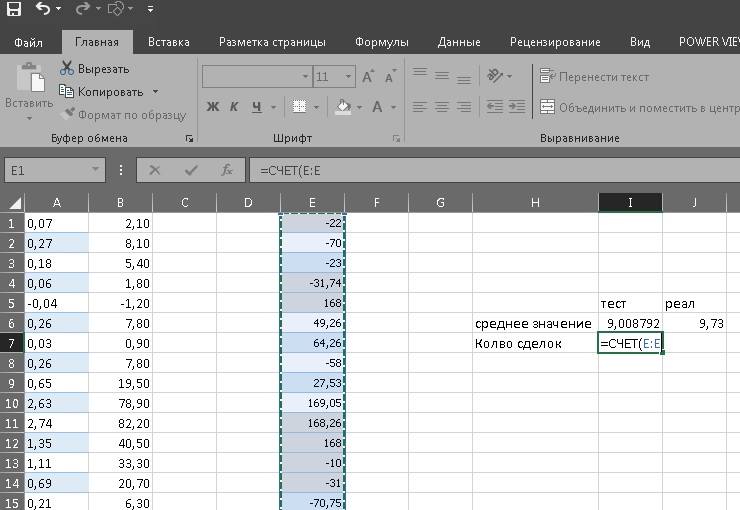
Also calculate the number of trades:
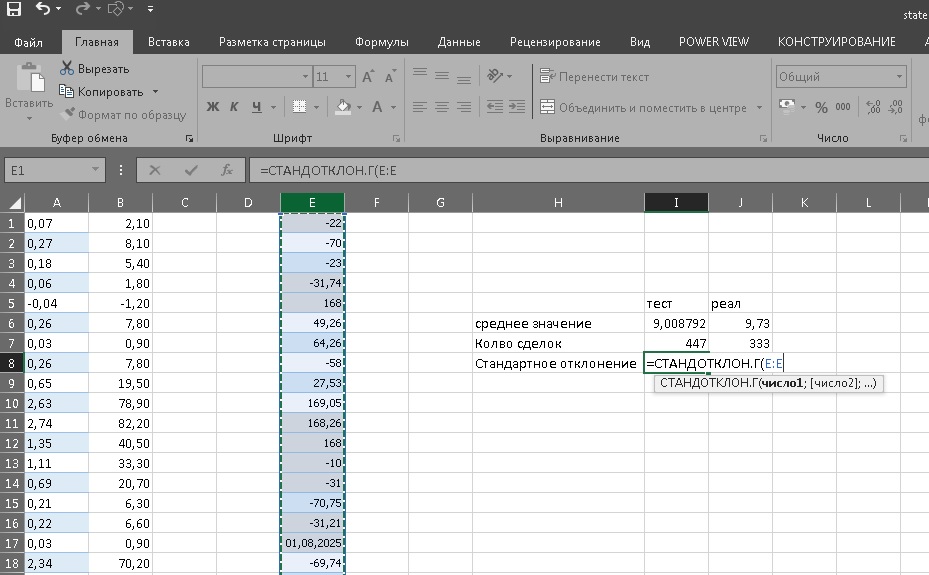
Then determine the standard deviation for the population (what was obtained in the test):
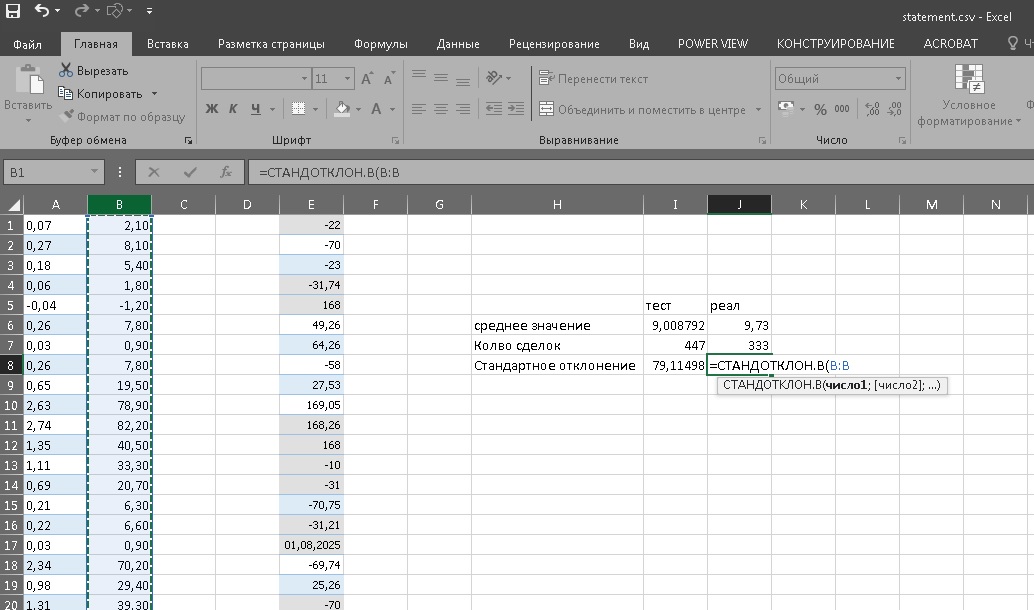
And the standard deviation for the sample (from the real account):
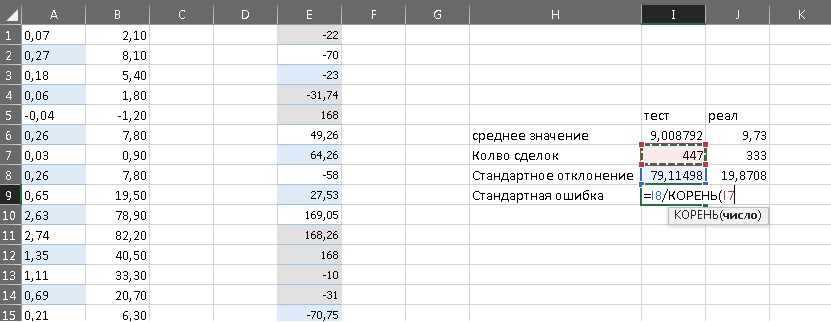
Next, we need to calculate the standard error:
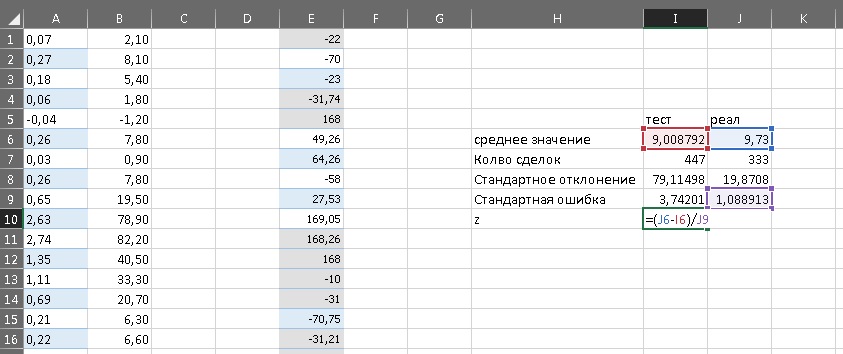
And finally, the z-transformation:
Find a standard distribution calculator on the internet or use the site shown in the screenshot:
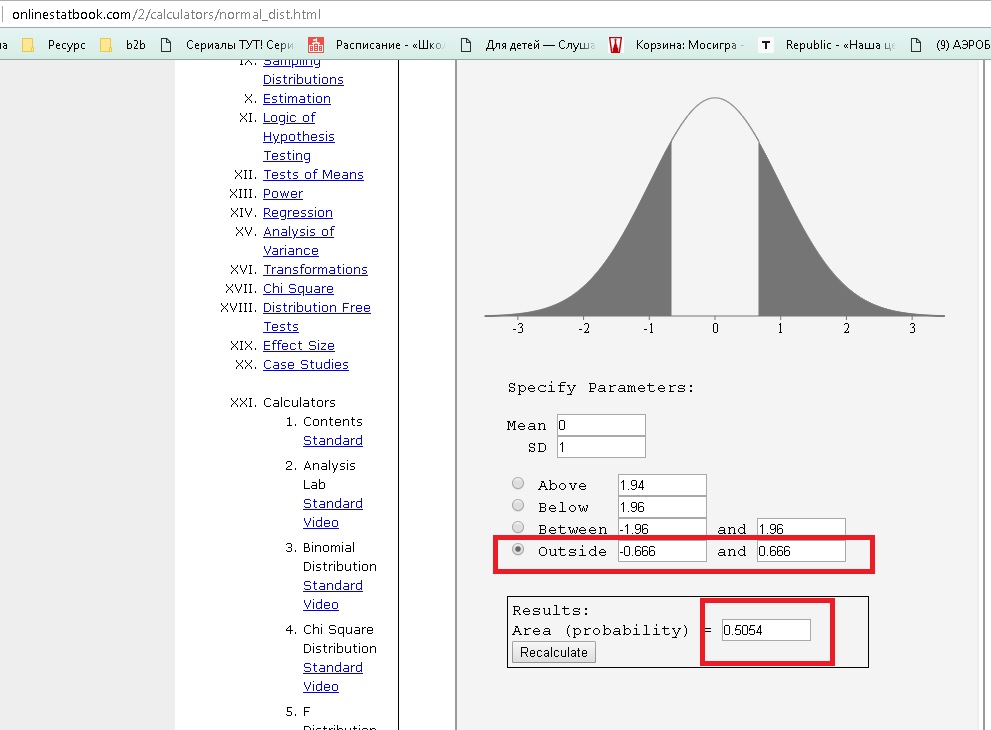
Fill in the z-transformation value as shown in the figure above and click calculate. As a result, we will get the value P:
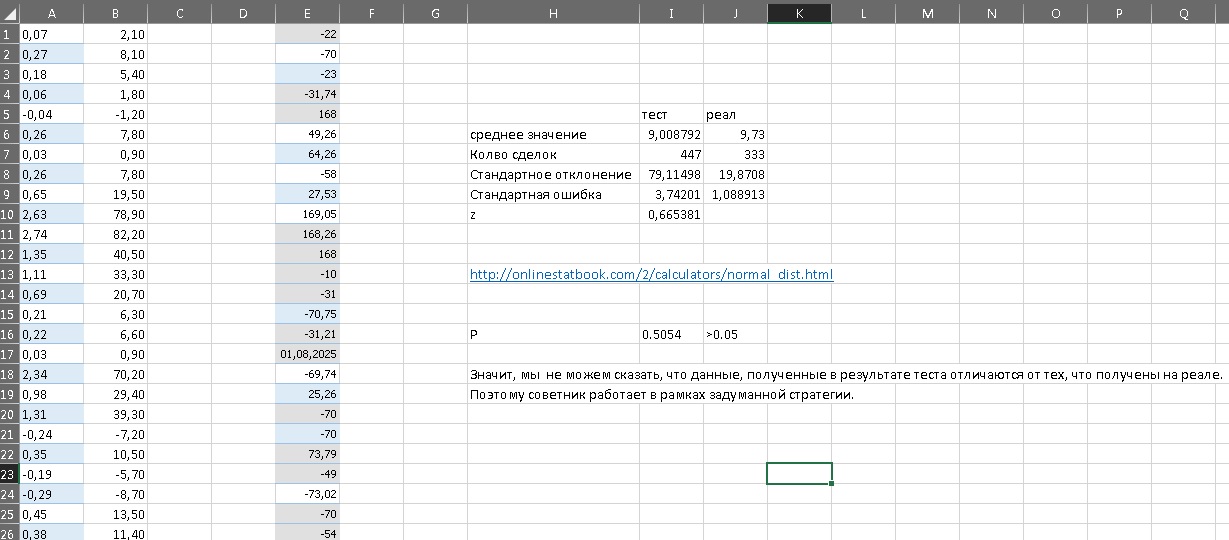
In our example, P turned out to be 0.5054. This is much greater than 0.05, so we cannot say that the account data differ from the test data. Therefore, we can conclude that the strategy works within the intended algorithm.
You can also watch a video describing this methodology (one of the lessons from the ExcelTrader course):
As you can see, the idea is very simple. We have a long chunk of data obtained while testing a trading strategy, and we have a small piece obtained while working on a real account. And there is a methodology that allows us to determine whether this small piece resembles the data obtained during the test. Of course, with a certain probability of 95%. But in most cases, this will be enough.
So when should you remove a system from the account?

For some people, a drawdown of half the account will become the signal to check the system. Some will simply ignore the scientific approach to this issue and continue using the old-fashioned methods. And those with especially weak nerves will start checking their systems at every drawdown exceeding 10%.
In reality, the fact that a system is currently trading profitably also does not mean at all that it is trading exactly as intended. In other words, even a profitable system may be trading differently from how it was designed at creation. Most likely, the reaction to this idea will be: if it is making money, there is no need to touch anything. But a system that is working "differently" also carries danger, because one fine day it will likewise start operating at a loss. In my view, systems should be checked once a month, and if a money-losing trading system does not pass the test, it should be removed from the account without mercy. Systems that are still profitable can simply be flagged and monitored more carefully.
Conclusion

Trading is, above all, statistics. And today we have examined a great many indicators that in one way or another characterize the quality of a trading system. Of course, there is also a huge number of various ratios such as the Calmar, Jensen, Sterling, and Sortino ratios, which were also invented to evaluate trading. However, the characteristics presented in this article are quite sufficient for evaluation in most cases.
I would also like to single out the method for evaluating the operability of trading systems that I mentioned above and that is discussed in the video course about the Excel program. It is truly a powerful, scientifically grounded way to make decisions about removing a system from the account or continuing to trade it. I hope it will help you more than once.
Sincerely, Dmitry aka Silentspec TradeLikeaPro.ru
