
How Broker Choice Affects Expert Advisor Results and What to Do About It
 Surely each of you knows that advisors trade differently for different brokers. Just go to forum and look at popular expert threads, where several monitoring of trading accounts of the same robot in different DCs are presented, and you will find differences in the results. These differences are sometimes very significant and profits can sometimes differ significantly. Why does this happen, what is behind it and how to choose a “profitable” Forex broker?
This is what we will deal with today.
How big is the problem?

Forex differs greatly from other financial markets. And among all those differences, the biggest one is probably its decentralization. People often underestimate the enormous importance of exchange centralization and how much it helps with regulation, successful development, and trading of various systems. Because the Forex market is decentralized, it is only weakly regulated, and every broker has its own stream of quotes that differs from everyone else's.
Quite often, when people talk about broker dependence, they consider it some rare factor that has virtually no effect on the overall result. However, this factor is by no means as rare as it seems, and its influence can be very significant - up to directly opposite results on two different accounts.
So what's wrong with differing quote streams? I propose to conduct a small experiment. Write down the high and low values of 5 candles periods M5, H1 and D1 with three different brokers of your choice. Record your readings RSI 20 and SMA 50 for each of these candles. Organize this data into a table, for example Excel, and then compare. Think about how price readings differ between different periods for different brokers and at what periods these differences are less significant; how do the readings differ?indicators; whether broker dependence increases or decreases when using indicators; how the period of the selected indicator affects trading with different brokers.
If the readings of a given value differ by more than 10% from broker to broker, how will the settings of an optimized expert advisor behave when it trades with a different broker? I hope you will do this simple exercise and draw some preliminary conclusions. And now that you have gained a general idea of this very real problem, we will examine its impact on trading in more detail and also think about how to minimize the broker dependence of trading strategies.
The difference in the shape of the candles

This creates a number of problems, some of which are minor, while others have a major impact on trade. One of the minor problems is that with different brokers we have different price levels for high/low candles. This leads to the fact that some orders from some brokers are closed at levels SL or TP, but others do not. Sometimes a difference of one pip is enough, and with one broker the transaction is closed at a loss, and with the other at a profit. Or, for example, with one broker pending order activated, but the other did not. However, this happens quite rarely and therefore does not greatly affect the overall result.
On the other hand, such differences in quote flows (data feeds) lead to the fact that many candles, especially in lower periods, look different for different brokers and the opening, closing levels, minimum and maximum values of candles are different. This leads to some differences in the readings of indicators that use such price levels in their calculations. For example, you have a strategy, one of the conditions for entering purchases for which is to find an indicator RSI below level 30. As a result of inaccuracies in quoting, the Close prices of the candles used to calculate the RSI indicator differ slightly, literally by a couple of pips. As a result, with one broker you will get an RSI value of 29.99999 on the current candle, and with another broker it will be 30.00001. As a result, one broker will be able to enter, but the second will not. Also, strategies for crossing lines, for example, moving averages, will work differently for different brokers - somewhere the crossing of lines will occur earlier, somewhere later. But this, of course, only applies to advisors - there are no such problems with manual entry.

Therefore, it would be quite logical to conclude that the shorter the period for the operation of your vehicle, the lower the SL and TP levels, the more broker-dependent your system will be.
To better understand the impact of this effect and the importance of making the right choice timeframe, think about this. A difference of 2 points on an hourly chart could mean a 5-10% difference between candles, while on a five-minute period it could be as much as 30-50%. This example is quite conditional, because everything depends on the general volatility currency pair, but you still need to be very careful and always remember this. Especially installing a new scalper for M1 on a real account.
The difference in scalper trading between different brokers can really be huge, and it’s not just about different spread, but also in the above problem. Therefore, in order to develop an advisor that will give more similar trading results with different brokers, it is worth using higher periods, at least M15, and better yet H1. In addition, for periods of an hour and above, the strategy develop much easier. Well, if you really want to trade in low periods, first test the work of your advisors with several preferred brokers, and based on the results, decide where the advisor behaves more confidently. By the way, this test needs to be done exactly on the type of account on which you intend to trade in the future - many brokers have different quote flows for different servers.
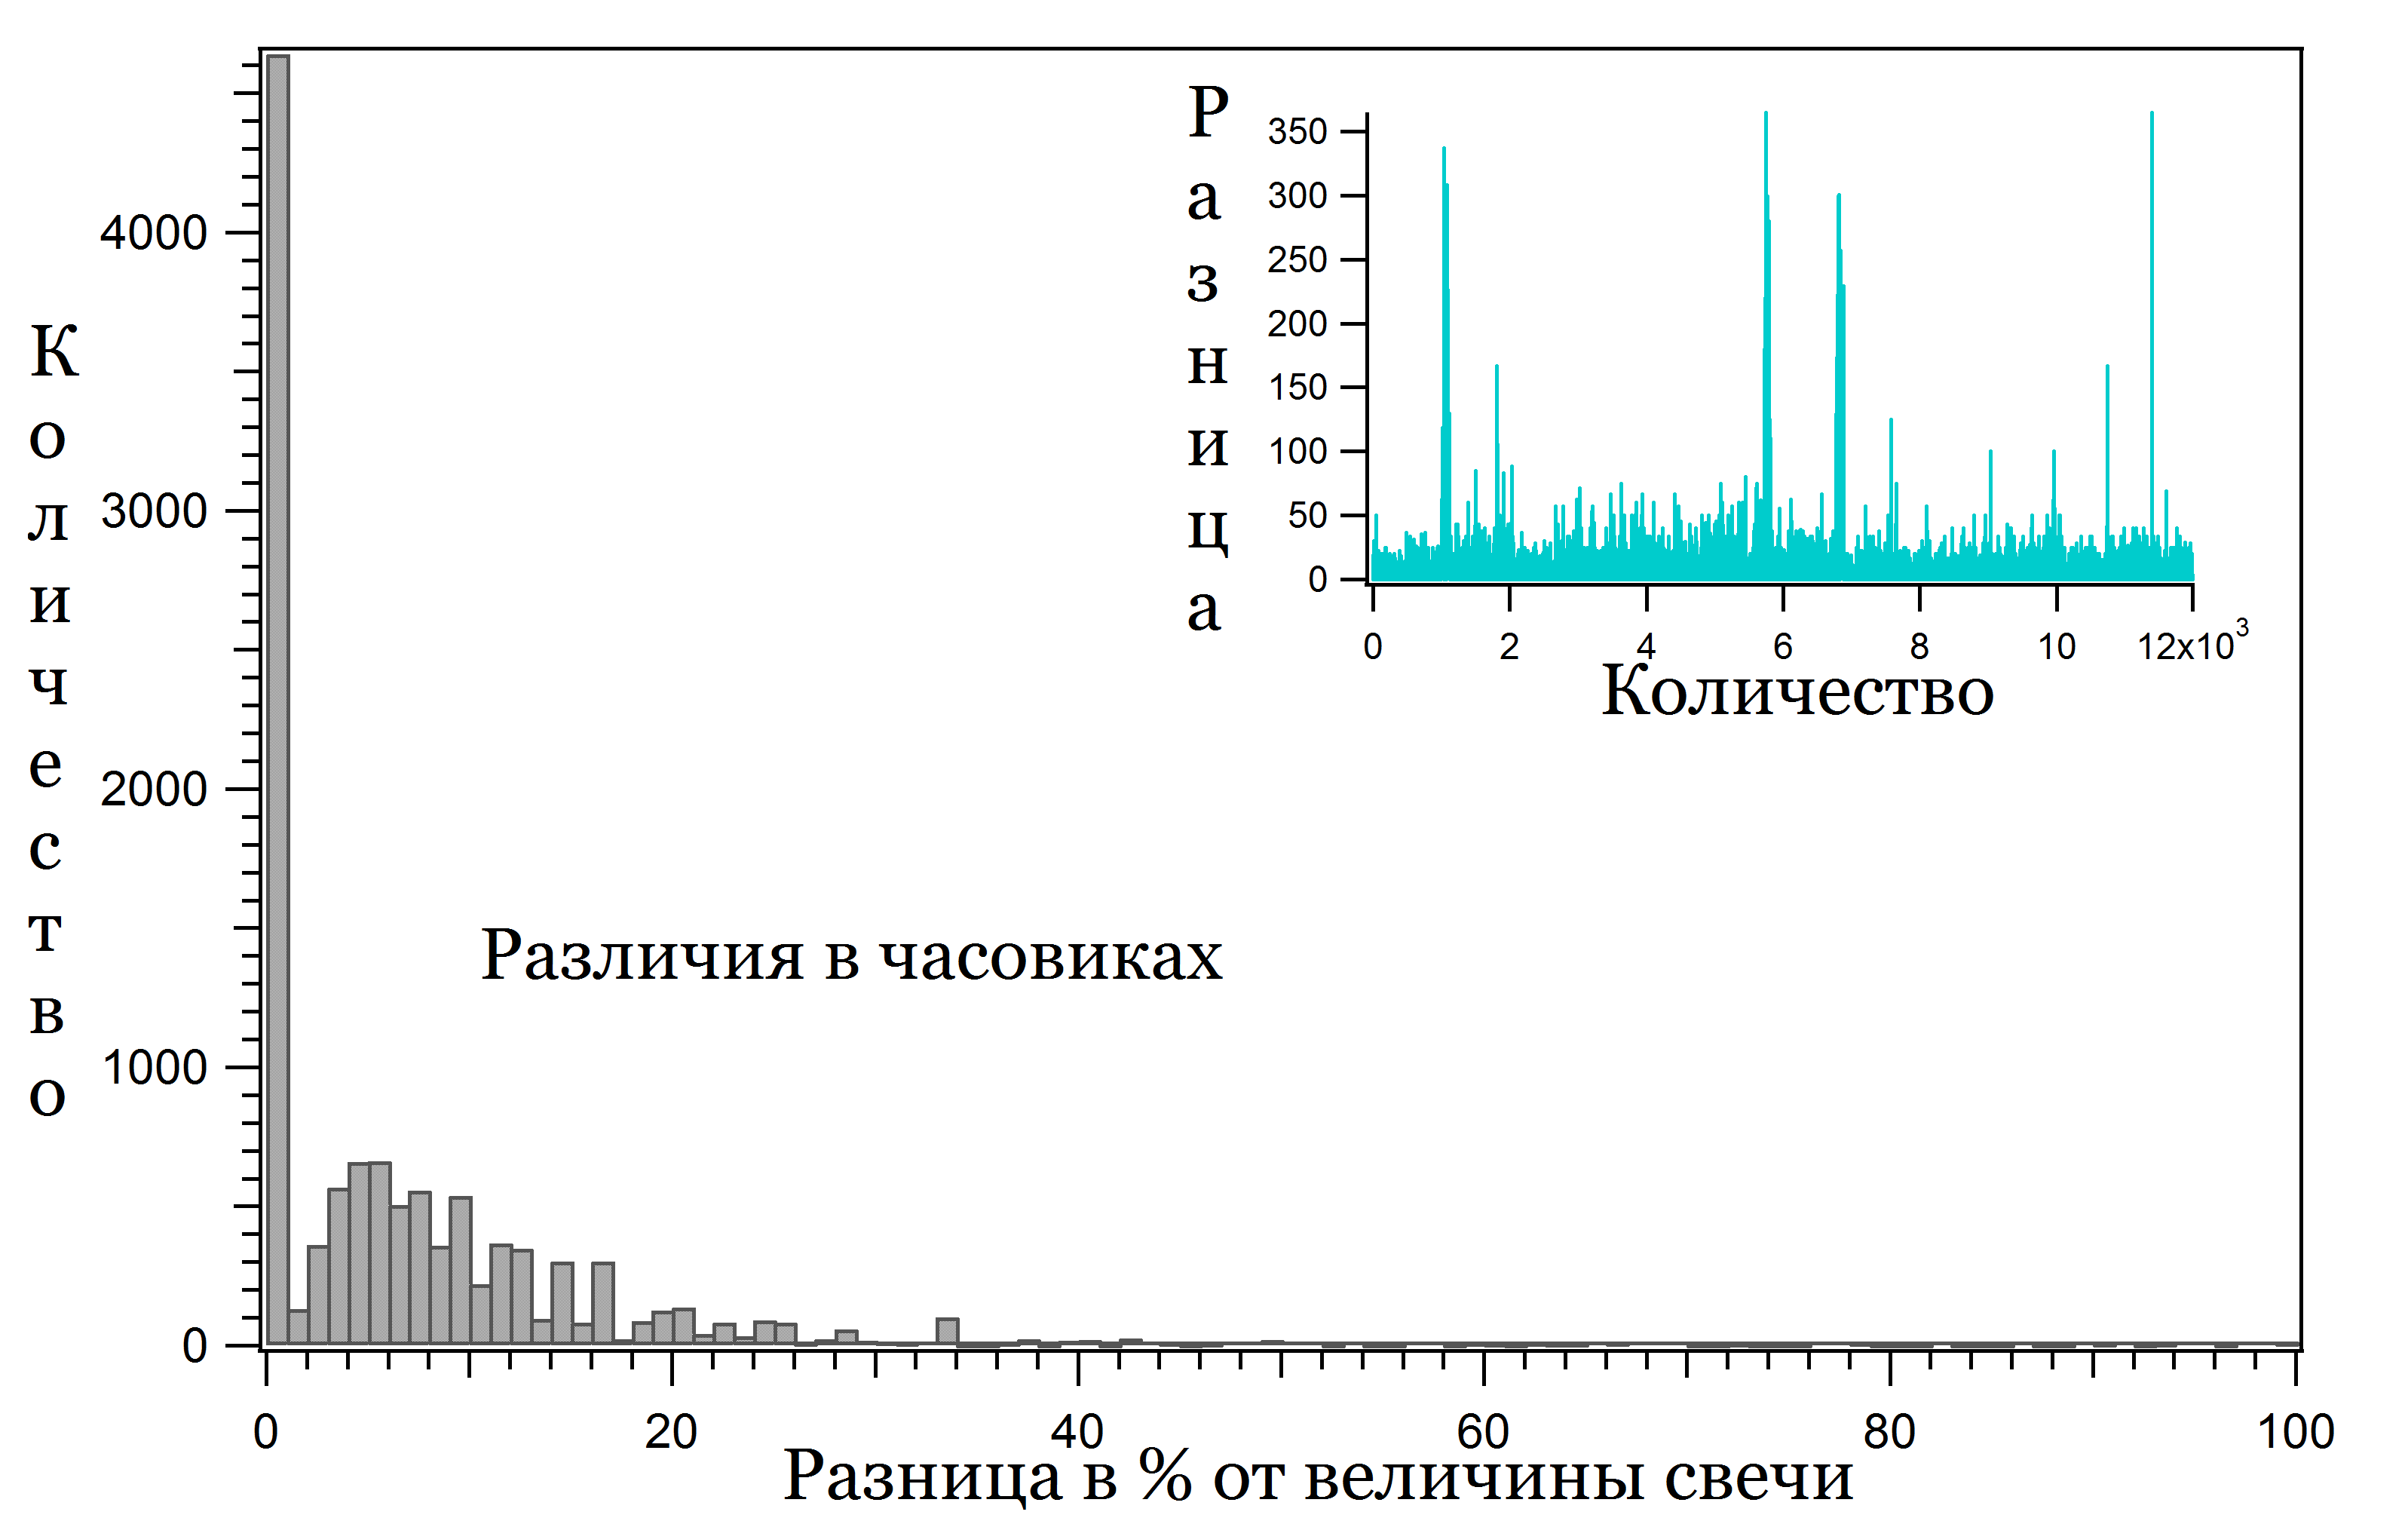
There is also a special case when trading differs on several accounts on the same server of the same broker. This behavior is also not uncommon and means a problem on the side of the broker itself, imperfection of its quotation algorithm, equipment, or incorrect server settings. In any case, trading with such a broker becomes quite complicated and if there are backup options, it is better to use them. The figure below shows the difference between 10 different brokers in the form of H1 candles:
 The figure below shows the difference between 10 different brokers in the form of D1 candles:
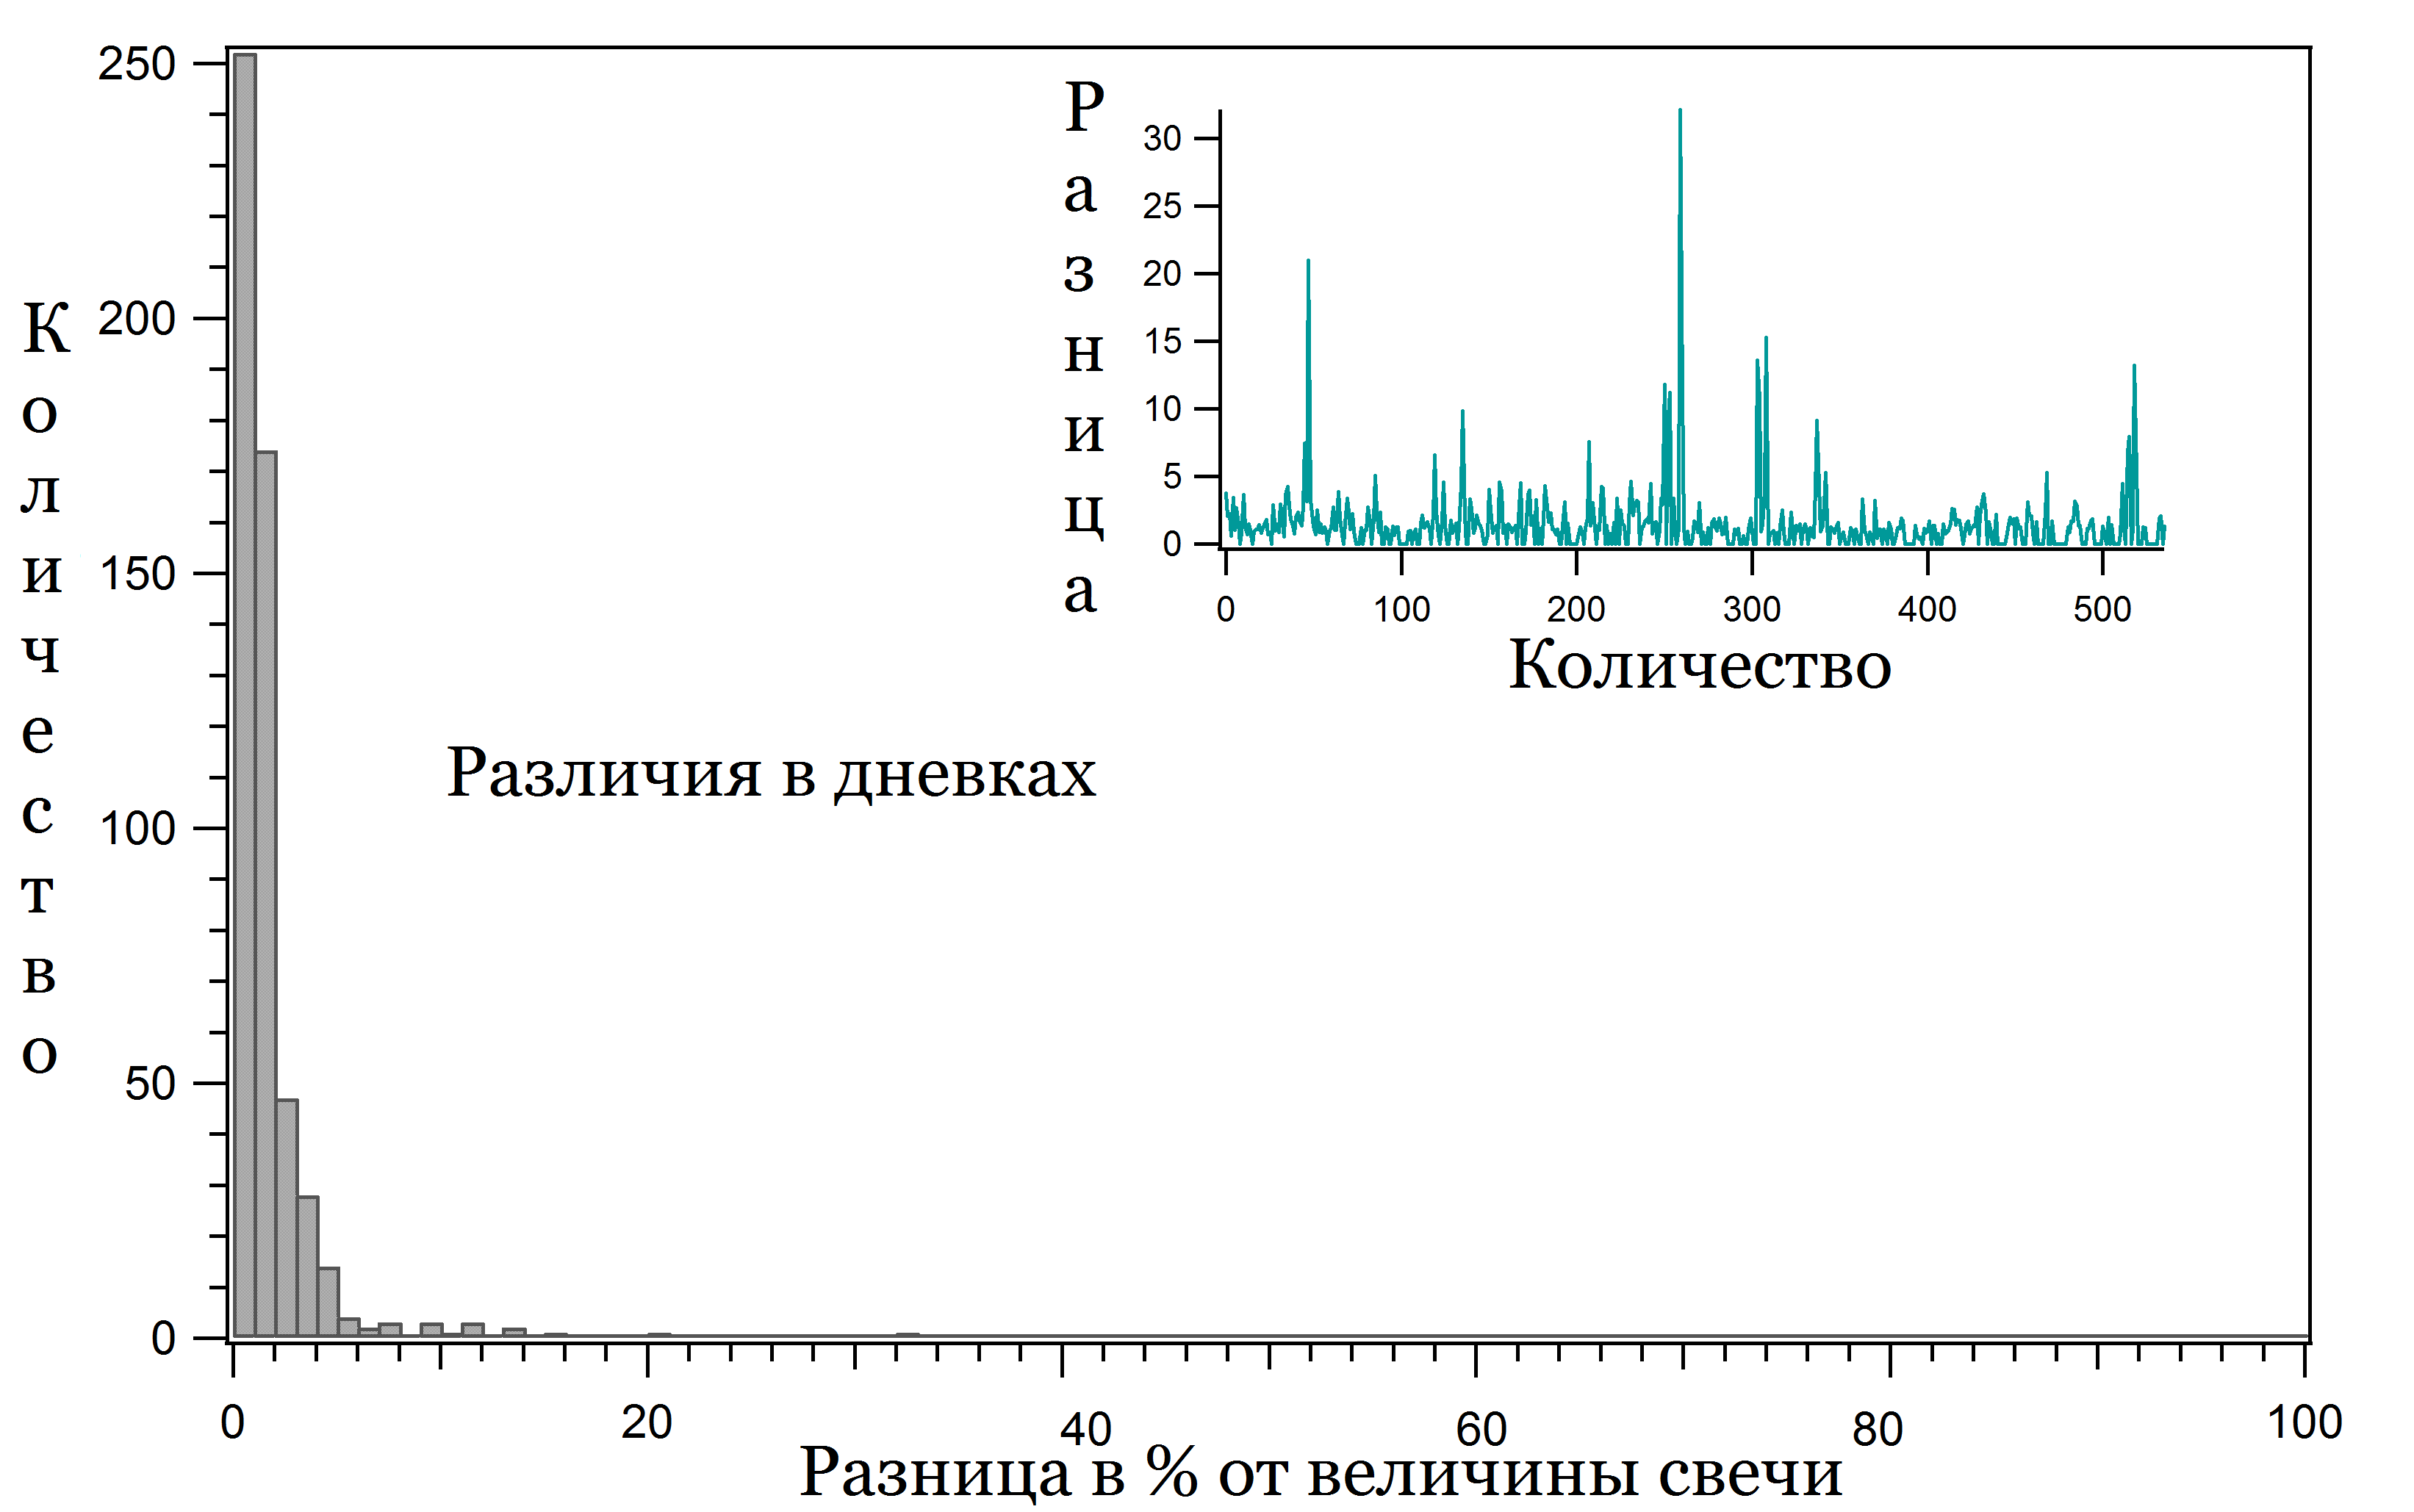 As you can see, the differences for daily charts are mostly within 5% of the candle size, occasionally reaching 15%, while for H1 the difference is 5-15% with a peak of up to 40%. The difference in the M15 period is on average 15-25% and for M1 – 30-40%. Please think about these numbers - the M1 period charts of one broker are almost half different from the charts of another broker. It's almost like trading another currency pair.
Difference in time of arrival of a new tick

Ticks do not arrive on a schedule; they arrive when a trade is executed in the real market, in the liquidity pool from which the broker takes quotes. A tick reaches the trader's terminal, and at that moment the trader can perform an action by sending a trading order to the broker's server. Naturally, that order goes no farther than the broker's server, and you will not be able to see it in the order book. Accordingly, your trade does not generate any new tick and has no effect on the market. Unless, of course, you trade in such large volumes that your broker is forced to route all your orders to the market.
The number of ticks that arrive in each time interval is uneven. This means that in one minute as few as 10 ticks may arrive or as many as 200, depending on how active the market is. At night, for example, few ticks arrive, while during the release of news there are many. In other words, we have a tick stream that is unevenly distributed over time and is then artificially split into fixed segments: one-minute, five-minute, hourly, and so on. How correct that is, and what follows from it, could be the subject of an entire separate article. We will focus on the facts themselves:
- timeframes exist in exactly the forms we use simply because that is the convention;
- a candle on any timeframe can contain a different number of ticks;
- ticks do not arrive on a schedule, but randomly.
It follows that at the opening of a new candle, say at 00:00:00, there may not be a suitable price. The tick may appear, for example, at 00:00:15. The same goes for closing a candle. All this also leads to inaccuracy when testing advisors and the appearance of differences between different brokers.Liquidity providers Different brokers have different ones and ticks come at different times.
Unscrupulousness of brokers

There are many legends claiming that brokers themselves help traders blow up their accounts. Ask a dozen people who trade Forex what they think about brokers, and they will tell you that they really cannot earn as much as they would like precisely because the broker is “playing games” with them. Is that really the case, or is it all just trader folklore and the vivid imagination of habitual losers?
So, you have created your first super-profitable scalping system, the tests show excellent results, your demo account shows thousands of percent in profit, and you have opened a real account and are already making plans for how to spend your millions. And then you discover that the results on your demo account and your live one are not just very different: the live account is blowing up! You open the terminal and find that because of constant spread widening, requotes, and slippage, your advisor cannot make money. The first thought, naturally, is that your broker does not want you to make real money. You can take the idea further: your broker has already spent your money and has no intention of giving it back. Such thoughts are understandable; any normal person would have them. You just need to study how brokers work in more detail to understand what is really going on.

And in general, put yourself in the shoes of the management of a more or less respectable broker, and you will understand that it is not in their interest to harm traders and wipe out their accounts. At the moment there is at least some competition in the brokerage-services market, and most traders go to the brokers they consider the most reliable. On the internet you can find a great many reviews and ratings of different brokers. But you should be careful with them, since many ratings may well be paid PR. Nevertheless, our forum has an entire section devoted to brokers, where forum members write about problems, conflicts, and questions that arise while working with a given broker. It is enough to read the thread for the broker you are interested in to get a general idea of it.
To be fair, I should say that not all brokers are equally useful. From time to time, news appears that yet another “scam” broker has gone out of business after taking traders' deposits with it. Reports of various outrageous violations on the part of dealing centers are also not uncommon. With direct access to the liquidity pool, most of the problems described in this article simply would not exist. But we work through brokers, and brokers in turn use the MT4 and/or MT5 platforms, or some other trading platform. How does it all work? In a nutshell, the broker receives quote streams from providers to its server, and then sends that stream from the server to the trader's terminal. And what can it do with the quotes that arrived from the provider but have not yet been sent to the trader? Exactly: anything it wants. MT4, for instance, gives a broker a lot of room to maneuver: it can set automatic requotes and slippage, define spread-widening algorithms, alter quotes at its own discretion, and draw any candles it likes in the history.
In the past, one of brokers' favorite tricks was injecting a non-market quote, the so-called “spike,” when the price suddenly became dozens of times higher or lower in a fraction of a second and wiped out half the traders in the market. The other half usually had their profitable trades canceled because of a supposedly non-market quote that allegedly “came from the providers.” As for the first half, the wiped-out one, their trades would be canceled only if they contacted support. If you did not file a complaint, then apparently you did not need the deposit, and the profit stayed with the broker.
There are plenty of such examples. You can read more about the “capabilities” of the MT4 terminal in the hands of a broker in the diary of our forum member Gustavo Abeladgio. He collected a lot of useful information. So the stories about brokers helping traders lose money are not really just stories. Nevertheless, only unscrupulous brokers that do not value their reputation resort to such dirty tricks. Therefore, when choosing a broker, think about whom you are trusting with your deposit: a company with ten years of experience and a name in the market, or a fly-by-night operation. Also think about which system is harder to sabotage: one that works on M1 candles and for which even a small random slippage can exceed the size of the stop, or one that works, say, on H1 candles. Which system would be easier to manipulate through slippage, poor execution, and spread widening?
Time difference

I have already studied the problem of different broker GMT settings very thoroughly in a separate article. The point is that if a broker starts the week just one hour earlier, the trader will already get completely different candle shapes on H4, D1, W1, and MN1. This is especially true for H4, because in that case the candle consists of only four H1 candles, and if even one of them drops out of the calculation, that already means a potential 25% difference.
In addition, most brokers use DST, shifting time for summer and winter. Some brokers do not do this. On top of that, the exact transition dates vary from year to year. Moreover, there are several schedules for those time changes, chiefly the European and American ones. All of this adds a great deal of confusion and chaos.
The picture is further complicated by differences in the day's closing and opening times. For example, some brokers end the session not at 00:00 but at 23:55, and start again at 00:05. The difference ranges from 5 to 30 minutes. And although that may not seem like much, it still contributes to the final result.
Spread difference

Each broker puts its markup into the price flow - the difference between the Ask and Bid prices that it expects to receive from the trader making a deal at the moment. At different times, the spread either widens or narrows - all brokers have their own algorithms. This difference can significantly affect the trading results of scalping systems. At the same time, limiting the maximum spread when entering a transaction cannot always help.
The point is that, for example, when trading night scalpers, it may turn out that most of the profitable trades were made precisely during periods when the spread widened, and filtering out those trades will make the system less profitable or even unprofitable. One possible solution is to set the spread filter at three times the normal spread during the period when the system is used. You can also make the maximum acceptable spread depend on the probability of entry, say exponentially: the higher the spread, the lower the probability that a trade will be taken. That way we will filter out fewer trades, while trades entered with a high spread will occur only with low probability.
As a further development of this idea, you can vary the lot size based on the current spread. For example, risk one-fifth of a standard lot if the spread is five times higher than the usual average value. It is very useful to study a chart of how the spread changes over time for your broker. There are quite a few indicators that let you do this, and they can be found in this topic. After analyzing such a chart, you will easily understand during which periods it is better not to get involved in trading.
In any case, filtering trades by spread will lead to the loss of some trades, which means that historical backtests will differ greatly from real trading, and real trading itself will differ across brokers, which automatically increases broker sensitivity. Therefore, the most reliable option is to develop systems for which differences in spread have only an insignificant effect.
Each broker is a separate market

Due to the above reasons (lack of regulation and centralization and differences in the flow of quotes due to different liquidity providers), each broker can be considered as a separate market. Due to the fact that the final “cocktail” of the quote flow is collected from a whole “mix” of various popular liquidity providers, the whole thing is then smoothed out by various algorithms and markups, and topped with various algorithms for widening spreads, generating slippages and requotes, each quote flow turns out to be truly unique.
When you test the system you created on ten years of data, you expect that drawdowns, profit factors and other trading statistics in real trading will correspond to the readings obtained in the tests (provided that the optimization of the parameters was carried out correctly). Unfortunately, few brokers are so trader-friendly that they provide their own historical database. Therefore, such bases of fairly high quality are usually worth their weight in gold.
Among the well-known sources, the most popular broker with its own historical database is Alpari. With this broker you can find M1 quotes for major currency pairs going back to 2000, which is quite enough to test almost any type of trading system. Therefore, expert advisors are most often tested on this history. But it often happens that trading is then done with another broker. And, as we already know, quotes differ from broker to broker, sometimes significantly.
But what if we trade on the same account whose data we used for testing? Logically, there should be no discrepancies. Let's see:
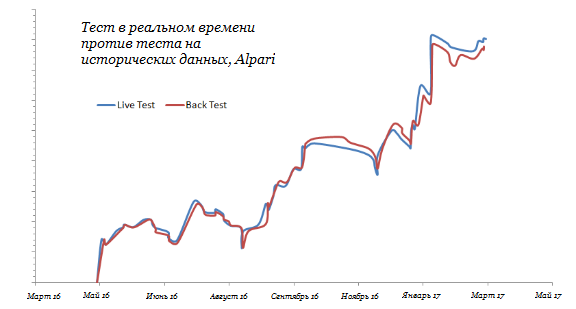 The differences are insignificant, but they do exist. It is very important to understand how much the data from a real test differs from the statistics obtained in a historical backtest. Knowing this difference, you can always adjust the calculated risks, the expected maximum drawdown, and other values. This is a comparison between a test of an EA's real profitability and a test on historical data from the same broker and the same account type over the same period of time. The platform itself introduces this error. As you can see, for a trading system on H1 it is small and amounts to only 1-2%. Therefore, testing on data from the same account and the same broker with which you plan to trade is a good idea.
But let's see what happens if we test the system on the data of one broker and trade with another. Maybe it's not so bad after all?
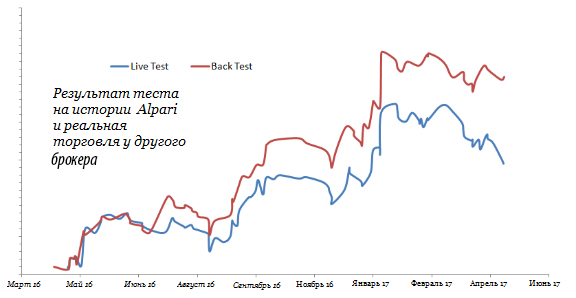 As you can see, over time the differences in returns increase and after just one year the returns differ by more than 30%. What can we say about, say, a ten-year period? In this example, the deviation is negative, but this is not a rule at all. You may well get significantly better results when trading live with a broker different from the one used for tests. There are also many such examples. But nevertheless, the main problem here is different: having tested the trading system on the data of one broker, you can no longer be confident in the obtained statistical characteristics of the system when trading with another broker. They will be different, which means you will overestimate or underestimate the risks and, as a result, you will risk too much or, conversely, receive less potential profit (by overestimating the maximum drawdown).
How to compare two brokers

In connection with the above, you probably already have the idea of comparing several brokers with each other. We, of course, can compare the levels of high, low, close, open candles or indicator readings, spread width, average slippage, but what will all this give us to assess the quality of the quotes themselves? Yes, by comparing the last two of the listed characteristics, we can judge the performance and “greed” of the selected brokers, but this will not tell us anything at all about the quotes. Comparing levels and readings will give us an idea of the difference between the quotes of these brokers, but again not an ounce of information about the quality itself. So what criterion should you use so that you can compare the quality of the quotes themselves?
Tick volume, in my opinion, may be the answer to this question. By comparing the number of ticks received in a selected unit of time, for example, per minute or hour, we can judge how the quote flows of two brokers differ from each other, what liquidity the brokers have, and whether there is any manipulation of the tick flow. In just a few minutes you can write a simple script and measure tick volumes per unit of time for two different brokers.
Most brokers list their liquidity providers on their website, so it is worth comparing brokers with similar providers. For example, if, with the same suppliers, the number of ticks per hour for one broker was 7000, and for another it was 1000, then don’t go to a fortune teller - the second one is clearly working magic on his quotes. Well, of course, it is preferable to use a broker with the maximum number of ticks per unit of time. That being said, if you build a simple moving average of the number of ticks received from different brokers, you can learn quite a lot about their final price feed provided to the trader. In general, this is a topic for a whole separate study, so we’ll leave it for now.
How to evaluate system tests using historical data

Monte Carlo analysis will help you evaluate the impact of broker dependence on test results. The essence of the analysis is to make life as difficult as possible for the trading system:
- Start trading from a different point in time;
- Mix up pieces of historical data (for example, put the last year in the middle, and the first at the end, and so on);
- Change the very shape of the candles by a few percent of its height;
- Change the spread and emulate its expansion/compression within specified limits;
- Emulate slippage and other difficulties in execution;
- Selectively “accidentally miss” a given portion of trades at random;
- Or for those who like extreme extremes, mix in candles from the history of quotes of another currency pair;
Usually the strength of all these brutal factors can be adjusted, and with proper configuration of the software used to conduct such a test, you can estimate the chance that the system will be wiped out if everything goes “very badly.” As a rule, people single out the “worst case,” or the worst scenario in plain language. This worst-case scenario is treated as a fully plausible outcome, and based on how bad it is, the trader decides whether the system should be allowed to trade. Usually, if the “worst-case scenario” at least does not blow the deposit, the system can be allowed to trade, because you can be sure that even in the worst situation you will at least not lose the deposit. Such tests can be run with certain software, but unfortunately you will not find this in the MetaTrader terminal. Nevertheless, for example, this program allows some basic tests, although its capabilities are very limited. But that is still much better than nothing at all.
Number of degrees of freedom

In simple terms, degrees of freedom are the number of variations of the same rule. For example, we have a rule for entering long trades when RSI crosses level 30. There can be quite a few variants of that crossing: RSI may stay below that level for a very long time, or it may dip below it for only one bar. It may fall almost to 0, or it may touch the level by only one point, and so on. Such a rule has many degrees of freedom. At the same time, every new rule limits the system's degrees of freedom. As a result, with a large number of rules there may end up being only one single pattern of price behavior under which the system will enter a trade.
The problem is that the fewer degrees of freedom a system has, the greater the risk of over-optimization, in other words fitting the system to specific data. This does not mean that the system will necessarily lose money on the same data in the future. But it definitely means that the system will behave differently on other data, for example from another broker. If you are not sure whether your system has a sufficient number of degrees of freedom, run a test on another broker's historical data and compare the differences.
And one more point - a small number of rules does not guarantee a large number of degrees of freedom of the system. The specificity of the rules themselves also plays an important role. For example, a simple crossing of a level by an oscillator is one thing, but an oscillator crossing a level by a certain amount, not higher than the maximum and not lower than the minimum, is completely different. Obviously, the second rule will have significantly fewer degrees of freedom. And all this can lead, at a minimum, to increased broker dependence, and at maximum to over-optimization.
Fuzzy logic

When using indicators, the situations discussed above often arise, when you are short by a couple of tenths of a point in the indicator reading needed to enter a trade. The same problems can arise when using TP, SL, pending orders, levels, and just about anything else. Here so-called fuzzy logic can come to the rescue, making your strategy rules less rigid. By analogy with manual trading, when a trader judges indicator levels “by eye,” fuzzy logic uses the same principles. For example, if the same RSI indicator missed level 30 by only 1.3 points and then reversed, why not still take that trade if all the other rules are satisfied? At the same time, the greater the deviation from the standard, level 30 in our example, the more risk the trader is essentially taking. Therefore, it would be quite logical to introduce a certain coefficient that would account for the size of the deviation from the “norm” and build it into the system's risk. That is, if RSI reverses at 31, we would risk the same as on a crossing of level 30. But if it reverses at RSI 35, we would risk only 60% of the normal lot.
According to this logic, the strict black-and-white distinction disappears, the rules become somewhat blurred, and the system becomes much less dependent on the quote stream, indicator readings, and other such things. If the current situation only weakly resembles the “reference conditions,” we will risk a small volume. If the conditions are ideal, we will enter with the calculated lot. Of course, fuzzy logic is not such a simple tool, and it is not easy to integrate into trading systems. It requires reworking both the entry/exit condition itself and the money management.
Tips for reducing broker dependence

As a rule, the greatest difference between the candles of two different brokers is observed during periods of the lowest volatility. In the Forex market, that is of course the Asian session. So what should we do now, throw away night scalpers? Of course not. Quite often, volatility during the Asian session is sufficient for trading. You just need a special filter that will prohibit trading if the current volatility falls below the specified minimum level.
You should also avoid building systems that use high and low candlestick prices in price calculations, including for calculating indicators. If you cannot do without using these values, use a moving average at high prices + 10% of the volatility indicator readings ATR for high prices and SMA(Low)-0.1*ATR for low prices. I took the ATR coefficient “offhand”; in fact, of course, you need to select it individually.
And as we became convinced at the very beginning of the article, it is worth avoiding low timeframes. The lower the working period, the higher the broker dependence. Therefore, ideally, systems should be written for H1 and above. To avoid disagreements caused by GMT on higher periods, especially H4, which is the most sensitive to GMT, you can use your own candle builder inside the advisor. This means simply assembling your own H4 candles from the hourly timeframe, which is not affected by GMT differences. I do not think anyone will have trouble assembling H4 candles from H1 candles. The indicators will be a bit more difficult, because they too will have to be recalculated inside the advisor so that they can be fed the correct prices.
Conclusion

Today we got acquainted with one of the most global and serious problems in Forex, arising from the decentralized nature of this market. I tried to cover this issue as widely as possible and consider the problem from different angles. I hope this information will encourage you to do further research, or at least make you be more careful when testing advisors on various historical data, as well as when using various brokers in real trading. The solutions I have proposed, of course, will not completely rid you of the problem of broker dependence, but many of them will significantly reduce the impact of this negative factor on your final result.
It is also worth paying attention to the “Recommended brokers” item, which we fill out in reviews of advisors and strategies.
Best regards, Dmitry aka Silentspec
TradeLikeaPro.ru