
Forex Money Management Fundamentals: From 2% Rule to Optimal F
Forex traders’ wealth depends on how they manage their money, not some magical, mysterious grail system. Successful trading makes money. Successful trading with proper risk management can create enormous wealth. Until you use risk management techniques, you will make a little money here, lose a little there, but never win big. When it comes to risk management, it’s amazing how few people want to hear about it or learn the proper techniques.
Inexperienced traders think there’s a magic approach to trading that correctly informs market behavior and allows them to almost always make profitable trades. Nothing could be further from the truth. Money is made by having an advantage in trading, working with that advantage on a regular basis, and combining it with a consistent approach to how much of your money you risk on each trade. Today, we’re going to talk about the entire variety of money management tools that are known and used by traders around the world.
What is risk management?

Running a search on the internet using these keywords, we got services on personal finance management, how to manage other people’s money, how to control risk, how to set stop losses properly, how to diversify your portfolio and the like.
In reality, risk management is none of the following:
- it’s not the part of the system that dictates how much you will lose on a given trade;
- it’s not how to exit a profitable trade;
- it’s not diversification;
- it’s not risk control;
- it’s not risk avoidance;
- it’s not part of a system that maximizes performance;
- it is not part of a system that tells you which trading tools to choose.
Risk management is the part of the trading system that tells you exactly how many lots to hold at a given moment and how much risk to take. In other words, risk management is about managing the size of the bet. The most radical definition we know of was given by Ryan Jones: risk management is limiting how much of your account to risk on the next trade. Note that this definition does not include managing the size of an already open position as risk management, whereas Van Tharp does.
Today, there are many more or less correct definitions of money management, as well as the very methods of calculating the risk per transaction. There are two categories of money management: good money management and bad money management. Proper management takes into account two factors: risk and reward. Improper looks at each factor separately: either risk or reward. Proper money management considers the full range of opportunities available. Wrong – evaluates only certain features or characteristics of an account, such as the percentage of profitable trades or the profit/loss ratio.

Risk management is 90% of the game. Larry Williams turned $10,000 dollars into $1.1 million dollars in just one year. In his book, The Definitive Guide to Trading Futures, he says, “Money management is the most important chapter in this book.” Indeed, many successful traders view money management as the most important tool to ensure complete success in the market. If money management is such an influential factor, it is important to know exactly what money management is from an objective point of view.
Probability and mathematical expectation
Beginners often don’t understand the fundamental concept of probability. They have to struggle with the horrors of the random process and invent various prejudices and myths about it, such as when the broker draws them wrong candles or the “puppet” hunts specifically for their stops.
An interesting book, “Mathematical Illiteracy” by Allen Paulos can be a great introduction to probability issues. Paulos writes how a seemingly educated man told him at a party, “If the probability of rain on Saturday is 50 percent and also 50 percent on Sunday, then the probability of rain on the weekend is 100 percent.” Of course, this is a complete absurdity for a more or less adequate person, although there are such cases. It’s like that bearded joke about the probability of meeting a dinosaur – 50/50, or meeting or not meeting. Someone who knows so little about probability is bound to lose money in the stock market game. It is your duty to yourself to acquire a basic knowledge of the mathematical concepts involved in the stock market game.
Ralph Wiens begins his famous book “Portfolio Management Formulas” with the paragraph: “Flip a coin in the air. For a moment, you will observe one of nature’s most amazing paradoxes: a random process. While the coin is in the air, there is no way to say with certainty whether it will fall eagle up or eagle down. Although the outcome of a series of many throws may well be predictable.”

For players, the concept of mathematical expectation is important. It is called the player’s stake (positive expectation) or the house’s stake (negative expectation), depending on which side has the better odds. If you and I flip a coin, no one has an advantage, our odds of winning are 50 percent each. But if you flip a coin at a casino that keeps 10 percent of every bet, you’ll win only 90 cents for every dollar you lose. The establishment’s share makes your mathematical expectation negative. No money management system can stand up to a negative mathematical expectation indefinitely.
If you know how to count cards on point, you may have an advantage over the casino if they don’t notice it and throw you out. Casinos love drunken players and can’t stand card counting players. Having an advantage will allow you to win more times over time than you lose. Good money management can help you capitalize more on your advantage and cut your losses. Without an advantage, you are better off giving your money to charity or squandering it on beer. In trading, an advantage is a system of play that creates more profit than losses, price differences, and commissions. No amount of money management will save a bad trading system.

You can only win when you have a positive mathematical expectation, a sensible trading system. Playing by intuition leads to loss of deposit. I am very interested in people who test their systems on the last three months of historical data and then wonder why they lost their deposit. Many are not even surprised, but simply find a rational explanation from their point of view, like the myth about the “doll”, which we have already mentioned above. They are interested, of course, in a clinical sense – it is very interesting what is going on in their heads. Many novice traders behave like drunks in a casino, moving from table to table, jumping from system to system, having had a couple of “losers” in a row. All this also comes from insufficient testing of systems and ignorance of the basics.
The best systems of play are rigid and practical. They consist of a small number of elements. The more complex the system, the more of its elements can fail. “Keep it simple stupid” is the main motto when designing a new system. Another important factor is to have a “stress test” of the system. The simplest one is to optimize the system parameters. If most of the parameter sets produce profits, then the system is good. The point is that you cannot know for sure whether the market will behave the same way as in the past, on which your system showed a good result.
That’s why you look at all the results in the aggregate – to see what happens if the system’s parameters become sub-optimal in relation to the future market. Another way is to eliminate rigid system settings as much as possible, to make them floating, depending on some market values, for example, on volatility. These basic approaches are quite realizable in the MetaTrader terminal and will allow you to find stable systems that are not sensitive to market changes.
Finally, if you have developed a good system, do not dabble with it. Develop another one if you like variety. Robert Pritcher puts it this way, “Most players take a good system of play and break it down trying to make it perfect.” I would have paid dearly now to know this about 5 years ago. If you already have a system of play, it’s time to establish money management rules.
I often mention in my articles the impact of various factors on the end result of trading – spreads, swaps, quote quality, and the like. Most beginners think that these factors can be ignored. They think they are smarter than most of us. Brokers diligently support this misconception, claiming that the winners get the money of the losers. They try to hide the fact that trading in financial markets has a negative mathematical expectation. The stray amateurs take frenzied risks, providing commissions to brokers and profits to the rest of the traders. When they are flushed out of the market, new ones come in, as hope never dies.


Extensive research has shown that the maximum amount that a player can risk in a single trade without impairing his long-term prospects is 2% of his deposit. We are not talking about overclocking, when a trader tries to increase his deposit by thousands of percent in one to two months, but about long-term profitable trading.
Most amateurs shake their heads when they are told this. Many have small accounts and the 2% rule crushes the dream of big profits. Most successful professionals, on the other hand, consider the 2% limit to be overstated. They don’t allow themselves to risk more than 1% or even 0.5% in a single trade.
The 2% rule reliably limits the damage the market can do to your account. Even a sequence of five or six losing trades is not capable of significantly worsening your prospects. In any case, if you are playing to have good stats to attract investors, you are unlikely to want to show 6% or 8% monthly losses. If you’re near that limit, stop playing for the rest of the month. Use this time off to reassess yourself, your methods and the market.

The first task of money management is to ensure survival. You need to avoid taking risks that can put you out of business. The second objective is to ensure a steady stream of profits and the third is to generate super profits, but survival comes first. “Don’t risk your entire fortune” is the first commandment of risk management. Losers violate it by betting too much on a single trade. They continue to play with the same or even a larger position when it yields a loss. Most losers finally go broke while trying to recover from the blow. Good money management will keep you from getting hit in the first place. This includes a heart attack.
If you lose 10%, you need to make 11% to recover, and if you lose 20%, you already need to make 25% to get yours back. If you lost 40% you need to make a blistering 67%, and if you lost 50% you need to profit 100% just to get back to your baseline. When losses grow arithmetically, the profits needed to recover them grow geometrically.
You need to know in advance how much you can lose when and at what level you will limit your losses. To do this, you can take the maximum drawdown from your tests and multiply it by 1.5 – 2. If the actual drawdown exceeds this value, it is time to stop. It is also important to determine how much you are willing to lose as a percentage of the deposit. For example, your system gives a drawdown of 20%, then you should stop trading when you reach 40% of the drawdown. But this is almost half of your account and you would not want to risk more than 10% of it. In this case, you just need to reduce the risks on the system by 4 times, which if you reach a drawdown of 10% would be equivalent to a test drawdown of 40%.
Get rich slowly

Traders working for a firm are usually more successful as a group than individual traders. They owe this to their supervisors who enforce discipline. If a trader loses more than his limit in a single trade, he is kicked out for insubordination. If he loses his monthly limit, he is disqualified from playing for the rest of the month, and becomes the boy who brings the rest of us coffee. If he loses his monthly limit several times in a row, the firm fires or transfers him. This system forces corporate traders to avoid losses. Individual traders act on their own discretion.
A trader who opens a $20,000 account and hopes to turn it into two million in two years is like a man who came to Moscow to become a successful showman. He may succeed, but exceptions only prove the rule. Newcomers want to get rich quickly, but ruin themselves when they take high risks. They may succeed for a while, but a series of failures will find them sooner or later.


Performance is the very first thing to look at when considering a particular system or method. How much money does the method create and over what period of time, what is the ratio of winning and losing trades compared to the percentage of wins, what is the maximum loss the system allowed and is it realistic.
There are several other indicators that are worth paying attention to in individual cases. The reason why you should pay attention to the indicators first and then to the logic is that, for example, I have developed and tested many logical methods that proved to be ineffective. I have built hundreds of trading systems according to the laws of logic, but all of them were not successful. Quite often our subconscious ideas about what works and what doesn’t work are wrong. It is never a good idea to use any idea without proper testing in practice.
Some metrics are worth paying more attention to than others. Statistics from some areas may be more valuable than others. Therefore, it is better to look at a range of data rather than two or three indicators. Now let us familiarize ourselves with the statistics that are worth using to evaluate the quality of trading systems. They are not given in ascending order of importance, because it is difficult to rank them outside of any connection with other data.

There are many traders who have found a system by doing complete and comprehensive testing and found that they can make, for example, 7% a year with it. Good money management can often make such a system quite good.
Recognizing the fact that good trading systems are hard to find, effective use of money management techniques becomes essential to improve the profitability of suitable systems as much as possible. Utilizing solid money management principles allows traders to squeeze more out of the oldest systems, often with less risk. Traders can rest assured that because of the ever-increasing power of the computer in the marketplace, people will be quicker to spot market features and utilize them in profitable trading systems. But finding a trading system is a small part of the problem. Managing account risk is the main difference between regular traders and institutional traders, winners and losers.
The above formula does not take into account various costs such as commission, slippage and others. When they are included in the above formula, a profitable system can become unprofitable – this is something to keep in mind.

This figure is calculated as gross profit minus gross loss. It will give you the broadest picture of what a system or method can give you. Total net profit is of little use unless it is broken down by year or by the time periods in which it was earned. There are other arguments to consider before making a final decision.

Here is the correct definition of the term: it is the distance between the maximum and minimum point reached after the amount of capital has reached a new maximum. In other words, if the capital size is currently $5,000, but a few weeks ago it was at $6,000, the current drawdown is $1,000. This amount of decline will continue until the previous high of $6,000 is overcome. If the capital does not fall below 5000, say to 4000 dollars before the account reaches the new high, then the decline will be considered to be 2000 dollars. If the system had previously recorded a high of $2,000 and then the capital fell to $800 before going higher, the maximum drop would already be $1,200.
The benefit of this figure is not very great. First of all, the capital value may fall four or five more times to near $1,000, thus proving the likelihood of larger declines as well. Or if on another occasion the account may fall below $300, it shows that the $1,000 drop was more of an exception to the general rule. Beyond that, if a $1,000 drop was once recorded, it doesn’t mean that somehow that level won’t magically be overcome in the future. Falling capital does not know that it has to stop at any particular level. Losses don’t realize that they have to be $1,000 or $10,000. Nevertheless, these statistics help in understanding what to expect when assessing the overall risk of the method.

Trading stability can be measured as the ratio of profits made to the maximum drawdown experienced during the trading period. Another common name for this ratio is the Recovery Factor.
If the result is less than 10 percent of net profit, it is likely to be a very good system. But in general, if you think logically, it seems to me that this indicator is not quite correct. If the system was tested for 2 years with a net profit of 2000 dollars, and the loss amounted to 1000 dollars, then, following this logic, such a system should not be used. However, if the system was tested for 10 years and created a profit of 10000 dollars and the maximum capital loss was 1000 dollars, then the system is considered effective.
The problem here is that I can stretch out as long as I want, building up profits, to bring the numbers in line with this criterion. The system will not get better from 10 years of testing. What if the price drop happens right after you start trading? What is the ratio then? If you have not earned any profits, it equals infinity. The best ratio to use is the average price drop to average annual profit, that is simply put do tests for each year and calculate the ratio of one year’s profit to the landing and then find the average of all years. It will be more correct.
The average deal is simply the total net profit divided by the number of deals made. So every time you make a deal, your result will be the average deal. This is best used to measure your margin for error. If the system yields $10,000 over five years and it takes 1000 trades to do so, the average trade is defined by a value of $10.
This roughly corresponds to a profit of 10 pips. You can go to the store for half an hour to buy ice cream, and in the meantime the market will change by just 10 pips. Subtract the spread, the impact of slippage, swap costs and you will be left with 5 pips at best. This is a very small margin for error. Thus, the higher the average trade, the greater the margin for error. The best solution is not to even consider a method or system that gives less than 10-15 pips in an average trade.
Average win/loss ratio and percentage of profitable trades



Probability of Ruin (POR) is the “statistical probability” that a trading system will ruin an account before reaching a dollar level that is considered successful. Ruin is determined by the level of the account when traders stop trading. Knowing this value can be very important to traders. The POR illustrates to traders the statistical possibility that their trading systems will shift toward success or ruin, as would be expected by probability theory. To calculate the Probability of Ruin traders must persevere through an awfully long equation. In short, what follows are some of the basic building blocks of the equation:

POR is a value that should pique the curiosity of all traders, but it usually carries little additional information since most of the time its values are below 5%. However, in some circumstances, it can show traders that they are at high risk of account ruin. When traders are faced with this reality, it means that they are taking too much risk on every single trade. Knowing this, traders should limit the risk of each trade to try and reduce the POR to an appropriate level. By trading small portions of their account, traders are essentially giving themselves a better chance of winning.

Last but not least, the last metric I would like to look at is the Profit Factor. The Profit Factor is equal to the quotient of the gross profit divided by the gross loss. If the gross amount of winning trades yielded $1,000 while the gross amount of losses was $500, then the Profit Factor is 2. This ratio is a confirmatory ratio. This indicator is closely related to the relationship between the average win/loss ratio and the win rate. For example, at 50% profit with a win/loss ratio of 2.0, the profit factor is also 2.0.
Many other ratios can be generated and analyzed. However, at some point, further research becomes simply unnecessary and even harmful. It is best to choose a few indicators that speak to both risk and reward, as well as some relationship between the two. You can use other indicators in addition to these. It doesn’t matter how many metrics you look at and how many of them meet your requirements, it won’t change the results of the system in any way. Using statistical indicators to estimate how much money you can make using any particular system is not quite right. Statistical metrics are used to evaluate when a system should be used and when it should be abandoned.
I have talked a lot about the characteristics of trading systems and identifying good or at least usable ones. In fact, it is not easy to find a good system, but if you have succeeded, it is time to talk about the direct methods of determining the volume of a trade. I will not go into each of the methods, but at this point I would like to introduce you to the main ones.
The method prescribes to put all available capital on one trade with the maximum leverage or so. Regardless of the result, close the account and walk away with either a loss of 100% or a large profit, usually less than 100%, as beginners usually tend to close positions too early. Why is this strategy used?
The logic is very simple. Beginners tend to get rich quickly, and their deposits are small. Let’s say there is a deposit of 100$ and in each deal we either lose everything or win 100% of profit. Then for 10 successful trades on the account will be about 100 000 dollars. The most important thing in this method is to understand that the strategy is played only once, as luck is exploited, not statistical advantage, which, according to the law of large numbers, is realized as a result of a large sequence of wins and losses.
This is not really a technique at all – it is the method most often used to test strategies. It consists in entering the market with one lot unit each time the system gives an entry signal. For example, always use lot 0.1.


In this case, one minimum lot is taken for every certain amount in the account. For example, you take a 0.01 lot for every 100$. Then with a deposit of $735, you will risk 0.07 lot in each trade. This method is good when the distribution of profits and losses on deals do not deviate much from the average values. Simply put, when all, for example, losses on trades are approximately similar to the average loss. If your maximum loss is four or more times higher than the average, this approach is not very good.
The thing is that this approach does not take into account the value of stop-loss and if they can differ several times from one trade to another, the curve of deposit growth will be quite uneven and often there will be big profits or big losses. On the plus side, there are smaller drawdowns on the account compared to fixed percentage of deposit risk methods and smoother capital growth.
- Chem bolshe razmer srednikh vyigryshey, tem menshe POR;
- Chem vyshe sredniy risk sdelki, tem bolshe POR;
- Chem bolshe iskhodnyy razmer scheta, tem nizhe POR;
- Chem vyshe protsentnaya dolya vyigryshnykh sdelok, tem menshe POR;
- Chem menshe schet, tem bolshe POR.



This is simply a safer mode of optimal f, one attempt to solve one of the problems of optimal f. Despite the name, safe f is still never safe. Leo Zamansky and David Stendahl tried to overcome large drawdowns by imposing an additional constraint on the maximum allowable drawdown. They partially succeeded, but the method is still very risky.

Murray Ruggiero suggested adapting the position size calculated using optimal f to the current market volatility. The idea is based on the hypothesis that at low market volatility the chances of getting a large loss are lower than at high volatility. In fact, the problem of huge drawdown in this approach has not gone anywhere, just the risks have been slightly reduced.
Volatility Percentage

- Torgovlya iz rascheta odin lot na kazhdye "kh" dollarov scheta;
- Risk v razmere opredelennogo kolichestva protsentov ot depozita v kazhdoy sdelke;
- Optimalnaya i bezopasnaya f;
- Kriteriy Kelli ;
- Protsent volatilnosti.
Drawdown management

This method is also somewhat similar to the fixed percentage method. But here we have the opportunity to set the maximum drawdown acceptable for us. The lot is determined by the formula:
% Risk * (Capital – (1 – Max_%_Drawdown) * Maximum_Capital)/SL
If we set a maximum drawdown of 30%, our current deposit is $1000, and the maximum was $1230, and we risk 5% of our drawdown in each trade, and the stop loss is 20 pips, then:
0.05*(1000-(1-0.3)*1230)/200 = 0.0348 or 0.03 lots.
If the lots could be split to infinity, then by this formula we would guarantee that we would never reach a drawdown of 30%. But since the minimum lot is finite, eventually (in case of an infinitely long series of failures) we will move to 0.01 lot. Then, as we get out of the drawdown the lot will increase up to:
0,05*(1230-(1-0,3)*1230)/200 = 0,09.
Then only when the previous peak of profitability is overcome, the lot will be increased. The big plus of this formula is that the risk is automatically adjusted based on the set preferences for maximum drawdown. The disadvantage is that at the very beginning of trading we start working with too high risk (5%), and to use the risk of, say, 1%, we need a rather large deposit (we are limited by the minimum allowable lot).
Another variant of this method is to use the maximum historical drawdown in pips instead of the SL value in the fixed percentage formula:
Lot = % Risk * Capital / Max Drawdown in pips
This method also takes drawdown into account, but unfortunately it tends to underestimate the lot.
Kelly method

This method determines the optimal percentage of risk that should be applied to maximize the “utility” function represented as the logarithm of capital. We have already discussed Kelly’s method in detail here. The method is used mainly for deposit acceleration and you should be very careful with it.

A common problem with all methods that use a fixed fraction of capital is that different variants of the methods either solve for maximizing capital growth without regard to risk (e.g., optimal f) or minimizing risk (e.g., risk no more than X % of capital). In trying to resolve this contradiction, Ryan Jones concludes that the ratio of the number of lots traded to the increment of capital required to increase the number of lots by one (or by the minimum increment of lots) should be a constant value.
This is actually a pretty fun method promoted by Ryan Jones and there are some interesting stories associated with it. This is a topic for a separate article, but their essence boils down to the fact that the method turned out to be no better than other methods of money management, with its own shortcomings.


As experience shows, it is much more important for an investor not to lose a small part of his initial capital than a significant part of the profit gained. The point of the method is to take a smaller risk on the initial capital, but more aggressively risk the profit received.
Pyramiding

All of the above methods determine the initial risk of opening a position. The current, or effective risk of an open position, generally speaking, is not equal to the initial risk. As long as the trade has no unrealized (paper) profit, the effective risk is positive. A trade protected by a stop order at the breakeven level has zero effective risk.
As soon as the stop moves beyond the breakeven level, the effective risk becomes negative. This means that the position has a guaranteed, stop-locked profit. Capital is no longer at risk, so we can risk the guaranteed profit, increasing the position size accordingly.
Averaging

Averaging is a strategy of work when you either made a mistake or just made any deal (the first one that came to your mind) and the price went against you, and you make a similar operation at a more favorable price. The main disadvantage of averaging is the fact that you do not know in advance to what price the market will go against you. But if you have a lot of money, you can afford a movement of 500, 1000 or more points.
Although such market movements do not happen very often, it is still not the best strategy, especially if you see that you are wrong about the direction of the trend. Nevertheless, if averaging is used with a stop-loss, the risks are calculated, the number of averages is strictly defined, then, if it is justified, it is quite possible to use this method for money management.
According to this method, traders determine the volume of trading after successful wins or losses. For example, after a losing trade, they may decide to double the trading volume after the next trading signal to recoup the losses. A simple example of such a system would be the Martingale method. The Martingale system has one catastrophic flaw: bets increase when you lose, and only the size of the original bet will win.
As a result, the bets grow exponentially, and the winnings tend to zero. After the first loss in the system of games with equal odds, the player finds himself in the position of the eternally wagering. In general, to build a more or less adequate system of capital management, which even under some conditions can really make a profitable system from a losing one, is closely related to the concept of z-account. Within the framework of this article we will not delve into this topic.
Among the methods of money management, this method is often found, although few people take advantage of the benefits it can give. Strictly speaking, there is only the following variant: we build a moving average according to the profit chart, trade when the profit is above the moving average, and trade “on paper”, i.e. virtually, when the balance chart is below the moving average.
At the same time, for some reason no one dares to build a full-fledged trend system on such a chart, but it is possible to use the intersection of two moving averages moving averages or even combine this approach – to enter the “profitable trend” on pullbacks on oscillators, using the same or channel indicators to identify this very trend. This will allow us to avoid drawdowns, trading during them virtually, “on paper”, and enter real trades only when the system feels good.


The methods of money management presented above are basic methods, on the basis of which you can develop other, more specific and complex strategies of money management. Remember that money management is first and foremost a numbers game, so you should not apply new risk management techniques without proper testing. Sometimes a money management system that has worked well for one system will have the opposite results for another.
Nevertheless, you should pay as much attention to money management issues as possible, because no matter what different approaches to trading famous and successful traders have, they all agree on one thing: a competent approach to money management is 90% of success. This article is very long, but it is only an introduction to the variety of money management tools that are known and used by all traders around the world. If you would like to get acquainted with the world of money management in more detail, please write comments, and I will try to describe the above mentioned methods in detail in subsequent articles.
Na samom dele eto dovolno veselyy metod, kotoryy prodvigal Rayan Dzhons i s etim svyazano neskolko interesnykh istoriy. Eto tema dlya otdelnoy stati, no vsya ikh sut svoditsya k tomu, chto metod poluchilsya nichem ne luchshe drugikh sposobov upravleniya kapitalom, so svoimi nedostatkami.
Metod Larri Vilyamsa

Pri ustanovlenii rekorda Larri Vilyams ispolzoval formulu Kelli, v kachestve nachalnogo riska ispolzuya velichinu marzhi na fyuchersnyy kontrakt. Dinamika kapitala byla tozhe pouchitelnaya: snachala kapital vyros s $10,000 do $2,100,000, zatem opustilsya do $700,000 (prosadka 67%), i zavershil god na otmetke $1,100,000. Kstati, v to vremya Ralf Vins rabotal u nego programmistom.
Igra «rynochnymi dengami»

Kak pokazyvaet opyt, investoru gorazdo vazhnee ne poteryat nebolshuyu chast svoego nachalnogo kapitala, chem znachitelnuyu chast poluchennoy pribyli. Smysl metoda zaklyuchaetsya v tom, chtoby brat menshiy risk na nachalnyy kapital, no bolee agressivno riskovat poluchennoy pribylyu.
Piramiding

Vse vysheizlozhennye metody opredelyayut nachalnyy risk pri otkrytii pozitsii. Tekushchiy, ili effektivnyy risk otkrytoy pozitsii, voobshche govorya, ne raven nachalnomu risku. Do tekh por, poka sdelka ne imeet nerealizovannoy (bumazhnoy) pribyli, effektivnyy risk polozhitelen. Sdelka, zashchishchennaya stop-prikazom na urovne bezubytochnosti (breakeven), imeet nulevoy effektivnyy risk.
Kak tolko stop peredvigaetsya za uroven bezubytochnosti, effektivnyy risk stanovitsya otritsatelnym. Eto oznachaet, chto pozitsiya imeet garantirovannuyu, zapertuyu stopom pribyl. Kapital pri etom bolshe ne podverzhen risku, poetomu my mozhem riskovat garantirovannoy pribylyu, sootvetstvenno uvelichivaya razmer pozitsii.
Usrednenie

Usredneniem nazyvaetsya takaya strategiya raboty, kogda vy ili oshiblis, ili prosto sovershili lyubuyu sdelku (pervaya, prishedshaya vam v golovu) i tsena poshla protiv vas, i vy proizvodite odnotipnuyu operatsiyu po bolee vygodnoy uzhe tsene. Osnovnym minusom usredneniya yavlyaetsya tot fakt, chto vy zaranee ne znaete, do kakoy tseny budet idti protiv vas rynok. No esli u vas mnogo deneg - vy mozhete sebe pozvolit dvizhenie v 500, 1000 i bolee punktov.
Khotya takie podvizhki na rynke sluchayutsya nechasto, - vse-taki eto ne luchshaya strategiya, osobenno esli vy vidite, chto oshiblis s opredeleniem napravleniya trenda. Tem ne menee, esli usrednenie primenyaetsya so stop-lossom, riski proschitany, kolichestvo usredneniy strogo opredeleno, to, esli eto opravdano, vpolne mozhno ispolzovat i takoy metod dlya upravleniya sredstvami.
Soglasovanie vyigryshey i proigryshey pri torgovle

Po etoy metodike treydery opredelyayut obem torgovli posle uspeshnykh vyigryshey ili proigryshey. Naprimer, posle proigrannoy sdelki, oni mogut reshit udvoit obem torgovli posle sleduyushchego signala k torgovle, chtoby vozmestit ubytki. Prostym primerom podobnoy sistemy mozhet byt metod Martingeyla. U sistemy Martingeyl est odin katastroficheskiy nedostatok: stavki pri proigryshe uvelichivayutsya, a vyigryshem budet tolko razmer pervonachalnoy stavki.
V itoge stavki rastut v geometricheskoy progressii, a vyigrysh stremitsya k nulyu. Posle pervogo zhe proigrysha v sisteme igr s ravnymi shansami igrok popadaet v polozhenie vechno otygryvayushchegosya. Voobshche zhe dlya postroeniya bolee-menee adekvatnoy sistemy upravleniya kapitalom, kotoraya dazhe mozhet pri nekotorykh usloviyakh deystvitelno sdelat iz ubytochnoy sistemy pribylnuyu, tesno svyazana s ponyatiem z-scheta. V ramkakh konkretno etoy stati my uglublyatsya v etu temu takzhe ne budem.
Torgovlya v sootvetstvii s grafikom balansa

Sredi metodov upravleniya kapitalom chasto vstrechaetsya etot sposob, khotya malo kto polzuetsya preimushchestvami, kotorye on sposoben dat. Strogo govorya, vstrechaetsya tolko sleduyushchiy variant: stroim skolzyashchuyu srednyuyu po grafiku pribyli, torguem, kogda pribyl vyshe skolzyashchey sredney, torguem «na bumage», to est virtualno, kogda grafik balansa pod skolzyashchey sredney.
Pri etom nikto pochemu-to ne reshaetsya postroit polnotsennuyu trendovuyu sistemu po takomu grafiku, a ved mozhno ispolzovat peresechenie dvukh skolzyashchikh srednikh ili dazhe kombinirovat etot podkhod – vkhodit v «pribylnyy trend» na otkatakh po ostsillyatoram, ispolzuya te zhe skolzyashchie srednie ili kanalnye indikatory dlya identifikatsii etogo samogo trenda. Eto nam dast vozmozhnost izbegat prosadok, torguya vo vremya nikh virtualno, «na bumage», i vkhodit v realnye sdelki tolko kogda sistema chuvstvuet sebya khorosho.
Krivaya bezopasnosti

Etot metod takzhe obedinyaet sredniy koeffitsient vyigrysh/proigrysh i protsent pribylnykh sdelok, kotorye my obsuzhdali vyshe. Delo v tom, chto eto otnoshenie nelineyno izmenyaetsya vo vremeni, eto ne postoyannaya velichina.
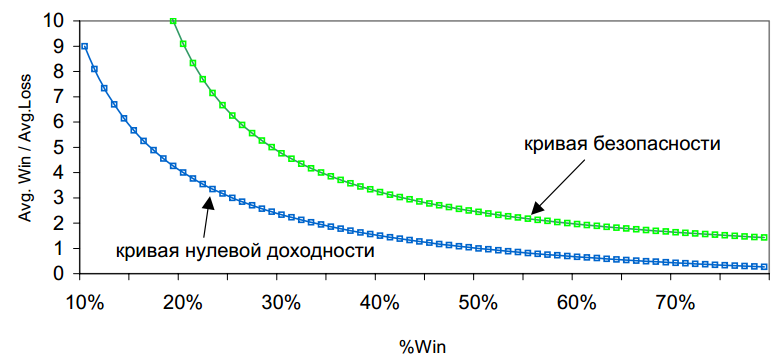 Na krivoy nulevoy dokhodnosti (KND) sistema rabotaet v nol, nizhe nee – v minus. V predelakh mezhdu KND i krivoy bezopasnosti (KB) sistema budet rabotat s pereboyami, prosadkami, no vse zhe prinosit pribyl. Vyshe KB nakhoditsya zona ustoychivoy pribyli. Ideya tut v tom, chto kak tolko kharakteristiki TS ukhodyat nizhe KB, stoit perekhodit na umenshennyy lot ili zhe sovsem na «torgovlyu na bumage». Takim obrazom my smozhem perezhdat ubytochnye periody i torgovat po sisteme tolko togda, kogda ona pokazyvaet luchshie rezultaty. A znachit v periody prosadok my ne budem sovershat realnykh sdelok, chto znachitelno uluchshit nashu itogovuyu statistiku.
Zaklyuchenie

Predstavlennye vyshe sposoby upravleniya sredstvami yavlyayutsya bazovymi metodami, na osnove kotorykh mozhno razrabotat drugie, bolee spetsifichnye i kompleksnye strategii upravleniya kapitalom. Pomnite, chto upravlenie kapitalom – eto prezhde vsego igra s chislami, poetomu ne stoit primenyat novye sposoby risk-menedzhmenta bez nadlezhashchego testirovaniya. Podchas sistema upravleniya kapitalom, proyavivshaya sebya khorosho dlya odnoy sistemy, pokazyvaet protivopolozhnye rezultaty primenitelno k drugoy.
Tem ne menee, voprosam upravleniya kapitalom stoit udelit maksimalno mnogo vnimaniya, ved kakie by raznye podkhody k torgovle ni byli u znamenitykh i uspeshnykh treyderov, vse oni soglasny v odnom: gramotnyy podkhod k upravleniyu kapitalom – eto 90% uspekha. Dannaya statya poluchilas ochen dlinnoy, no ona neset v sebe tolko oznakomitelnye svedeniya obo vsem raznoobrazii sredstv po upravleniyu dengami, kotorye izvestny i ispolzuyutsya vsemi treyderami vo vsem mire. Esli vam khotelos by poznakomitsya s mirom upravleniya kapitalom bolee detalno, pishite kommentarii, a ya postarayus podrobno izlozhit vyshe perechislennye metody v posleduyushchikh statyakh.
S uvazheniem, Dmitriy aka Silentspec TradeLikeaPro.ru
