
Secrets of EURJPY, or How to Trade the "Beast"
 Good day, fellow forex traders!
Today we will talk about how to trade EURJPY, one of the most dangerous but also one of the most popular cross-currency pairs on the forex market. Quite a large percentage of profitable traders include it in their trading arsenal. About the features of this pair, which is sometimes called the "beast," the most appropriate strategies, the macroeconomic background, and other nuances, in this material.
The Economies of Japan and the Eurozone

In earlier reviews, speaking about trading the USDJPY pair, we already mentioned the peculiarities of Japan's economy. And since then the long-term perspective has only slightly changed its slope, but the character of the trend itself has by no means changed. Nevertheless, let us briefly refresh our memory by noting the most notable factors affecting the dynamics of JPY and EUR rates.
Japan has the 3rd largest GDP, behind only China and the United States. The country is a producer and exporter of automobiles and high technology and is therefore very sensitive to energy prices.
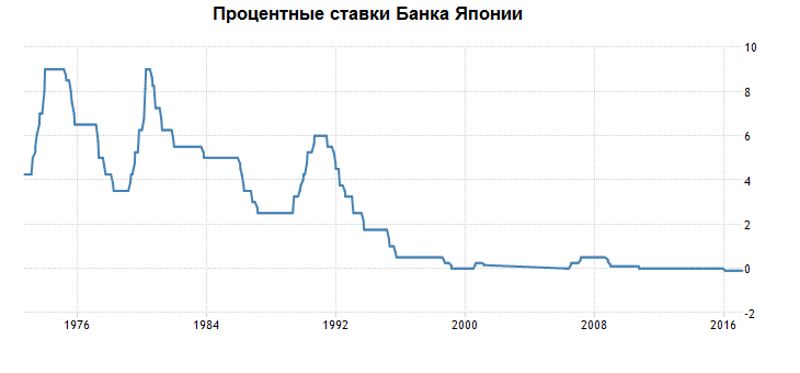
The central bank, the Bank of Japan, is a joint-stock company in which 45% of the shares belong to private and institutional shareholders. Interest rates alternate between negative and very low, from -0.1% to 0.1%, which makes borrowing in yen exceptionally popular.
The state traditionally fights the high yen rate and low inflation in order to make Japanese exports more competitive. Previously this was achieved through so-called currency interventions, and many traders had the opportunity to earn well by anticipating the moment of the next sales by the Japanese central bank, but today inflation growth is achieved through stimulus programs: purchases of long-term government bonds and other financial assets by the central bank.
 The euro is the official currency of the Eurozone, which consists of 28 EU member states, and at one time replaced another European monetary unit, the ECU, used in the monetary system of the EEC and the EU in 1979-1998.
Together, these 28 Union states form a single market whose economy accounted for 21% of global output as early as 2010, which puts it in first place by nominal GDP and makes it the largest exporter and the largest importer of goods and services.
The main governing bank, the European Central Bank, regulates the monetary policy of the countries within the eurozone while maintaining overall price stability. In the long term, the ECB's policy pursues goals similar to those of the Bank of Japan: accelerating inflation through stimulus programs.
Global Trend
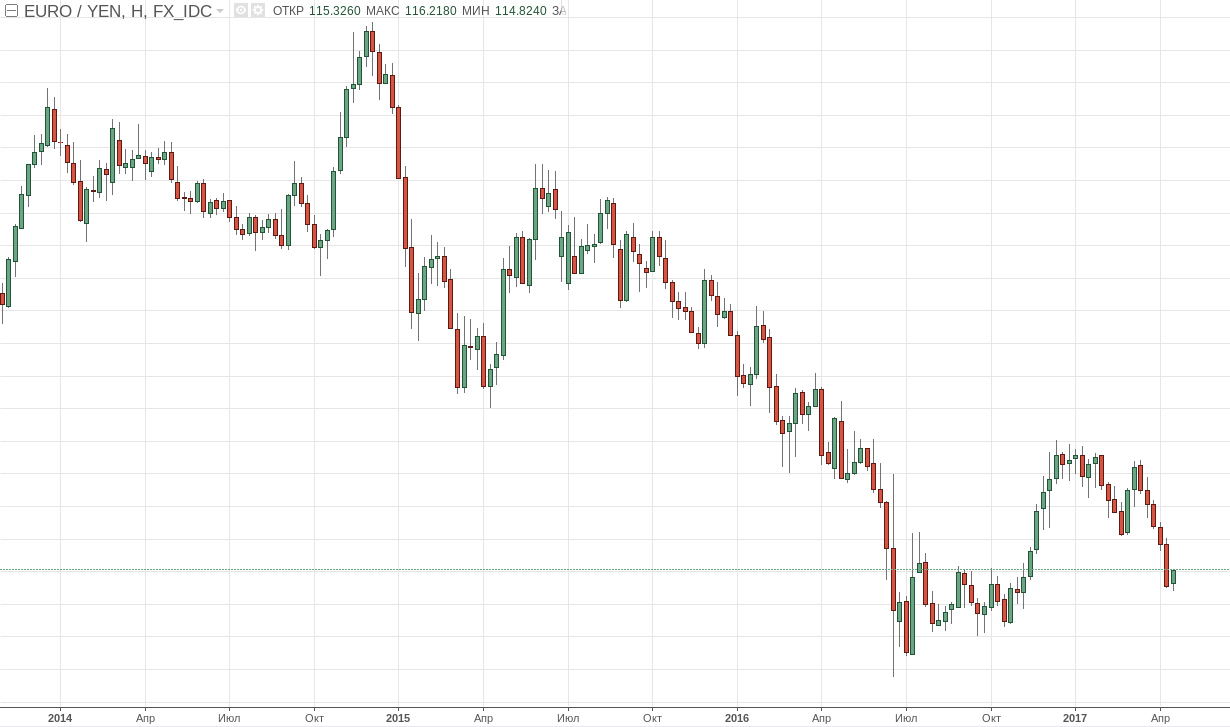 A downward trend has been observed since the end of 2014. It was then that the eurozone consumer price index moved into negative territory, from 0.9% in 2013 to -0.2% by the end of 2014, because of prolonged downturns in France and Italy. No significant recovery has followed since then, and the situation has only worsened due to the escalation of Eurosceptic sentiment in certain Union countries, which ultimately led to Brexit, the split with the United Kingdom, followed by the mobilization of similar initiatives in the political circles of France and Italy.
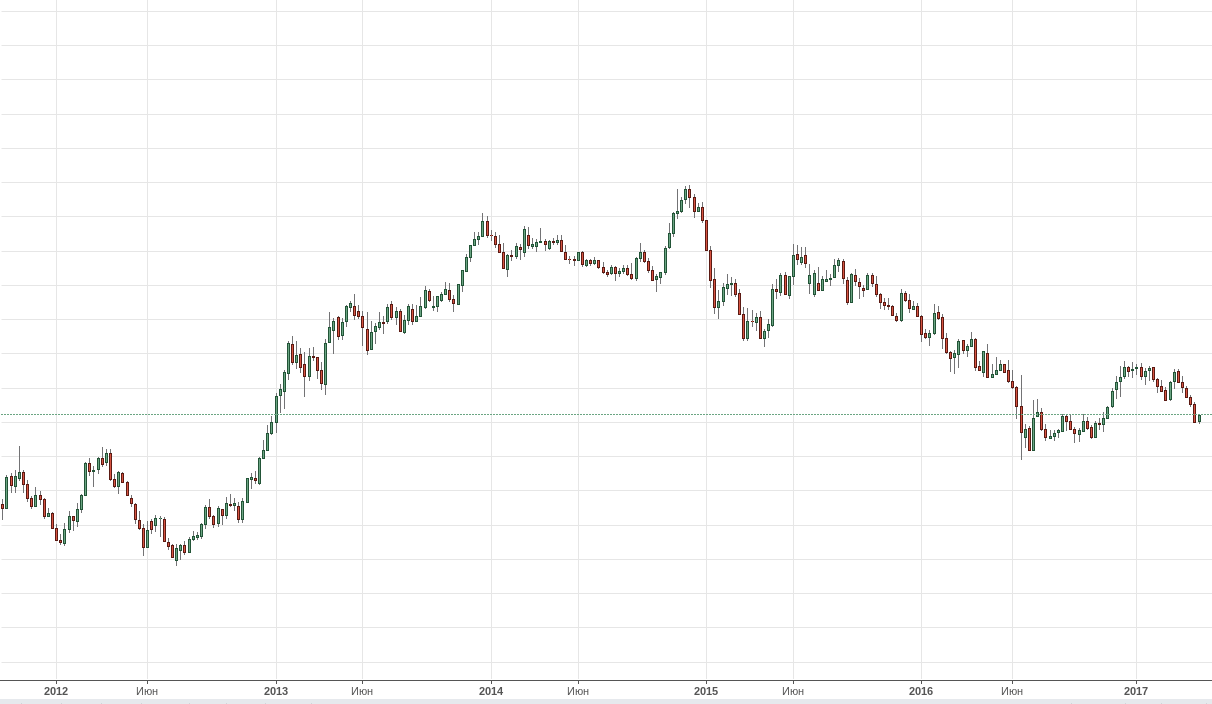 From a greater distance, it is clear that this was not always the case, and the strongest upward trend in the post-crisis 2012 confirms that. As for the prospects of the EU and the euro as a whole, let us leave that question to all kinds of political technologists. But the risks of the Union's collapse, or at least of its exceptional transformation, are visible to the naked eye and are already being taken into account by global investors today.
Based on these observations, it is worth assuming that the downward trend will continue over the next few years, and therefore when trading on daily charts the advantage remains with downward-directed signals. Of course, the situation may change, but based on the data available today and the dynamics of recent years, the global trend points to downward prospects.
Swaps
Swaps on this pair are insignificant, and therefore it will not be possible to earn or lose much on them, so we will leave this issue without detailed attention.
Pip Value
Pip value differs somewhat from standard pairs, at the time of writing with a 0.1 lot a pip is worth 0.9$, and this should be taken into account when calculating risk. Pips are slightly cheaper than on pairs such as EURUSD or GBPUSD.
Pair Volatility
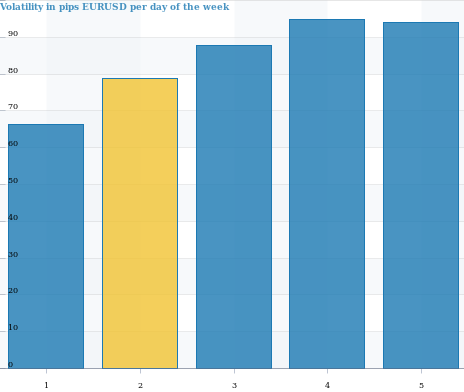
The average daily volatility of EURJPY over the last two years is approximately 115.44 pips. At the same time, the most volatile days are Thursday and Friday.
 The greatest intraday volatility is observed during the American session at 17:00 GMT and slightly less during the European and Pacific sessions. But it is worth noting that there is no such strong dependence on sessions as with EUR and GBP, and therefore activity can be expected at any time of day.
Correlations
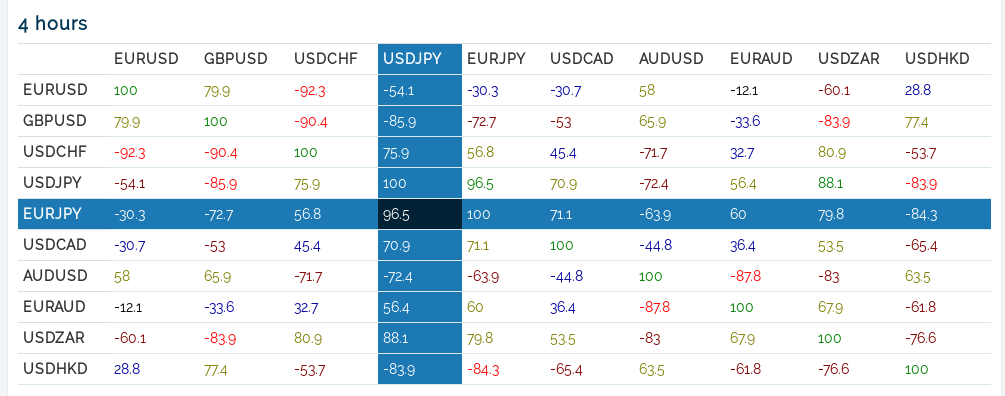
The most stable correlation is observed with the USDJPY pair on 4-hour charts. Therefore, if you have found some signal on that pair that has not yet played out on EURJPY, it may be worth preparing to enter a position.
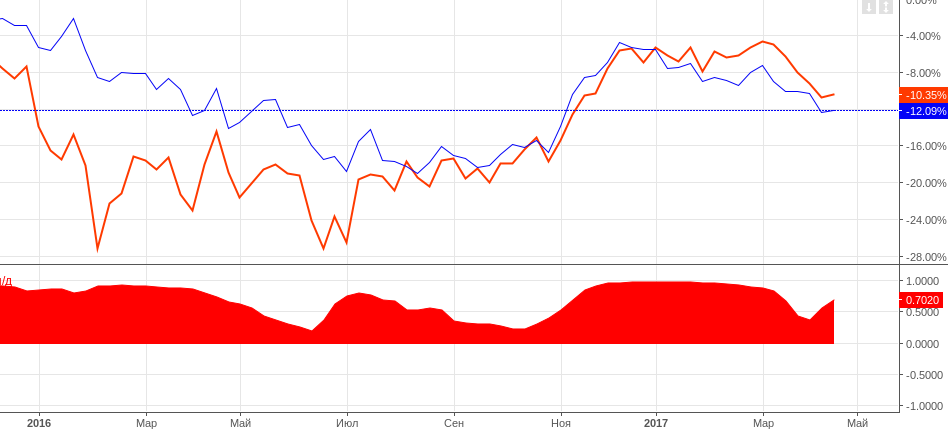
 In turn, USDJPY, as we remember, correlates well with the Japanese stock market, namely the Nikkei 225 index:
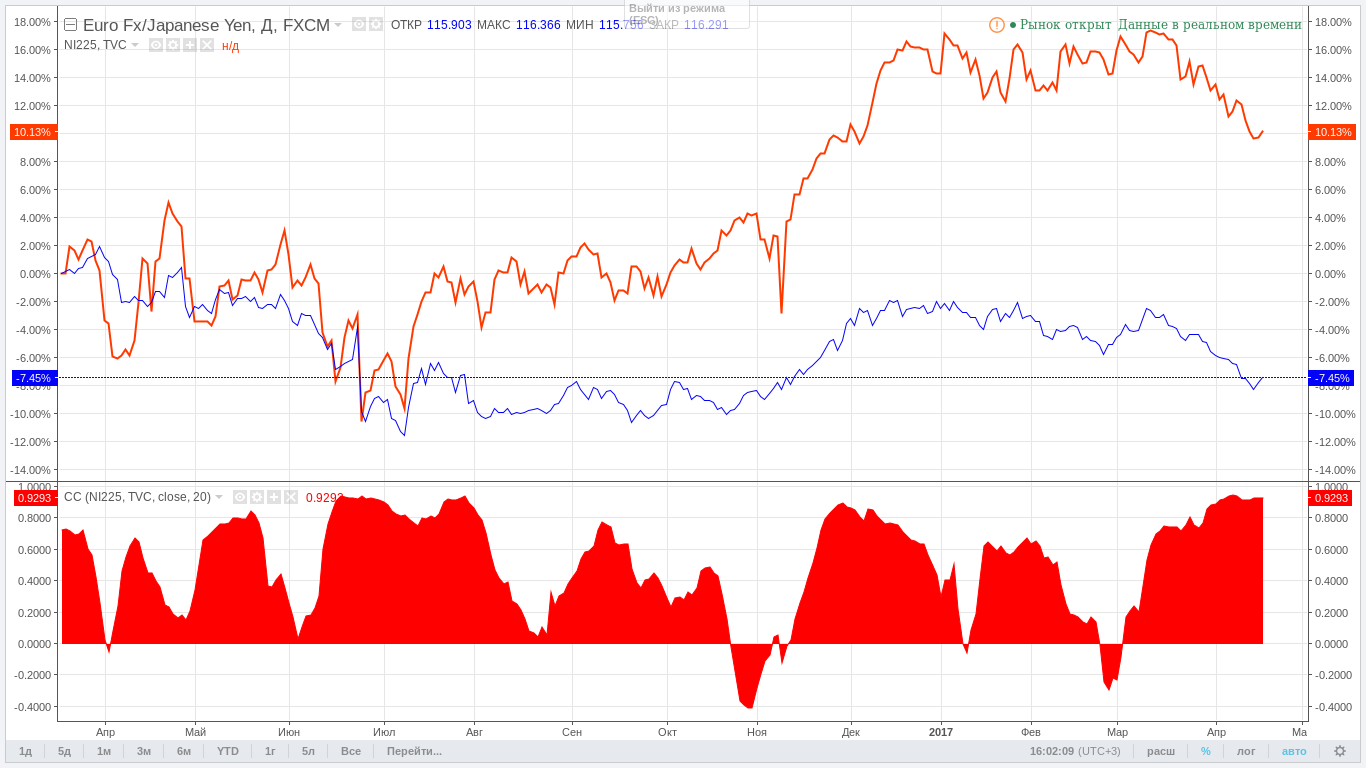
 Accordingly, EURJPY will have similar correlations with Nikkei 225 because of its close correlation with USDJPY. This is what we observe below:
 Moderate correlations of USDJPY with oil are also observed and, accordingly, slightly less moderate ones between EURJPY and oil, which you can also try to take into account in your strategy.
Economic Calendar
When working with the economic calendar, it is important to track news related to the European currency and Japan, as well as the US dollar, paying attention to the most volatile ones, which are marked with three red dashes.
Speaking of the news backdrop, it is also important to note that cross pairs such as EURJPY or GBPJPY react more smoothly to USD news, since they are less popular among traders and investors who prefer to take risks during such hours by trading EURUSD or, say, USDCAD. There are noticeably fewer false spikes.
Features of Trading the EURJPY Pair

We have already covered correlation strategies, and it remains to add a few more notable nuances that will help you better understand the specifics of trading EURJPY.
The pair is versatile and is excellent both for scalpers and for those who trade trends, both on long timeframes and on short ones. But speaking from the point of view of practical popularity, let us say that intraday trading undoubtedly prevails over trading on daily charts.
Those who casually looked through EURJPY hourly charts might have thought that stable trends do not form, in particular because of the abundance of "spikes." However, if you open the daily charts, it becomes clear that such an assessment of the situation is a significant oversimplification. Strong trends are clearly visible on daily charts, which opens up acceptable conditions for long-term trading.
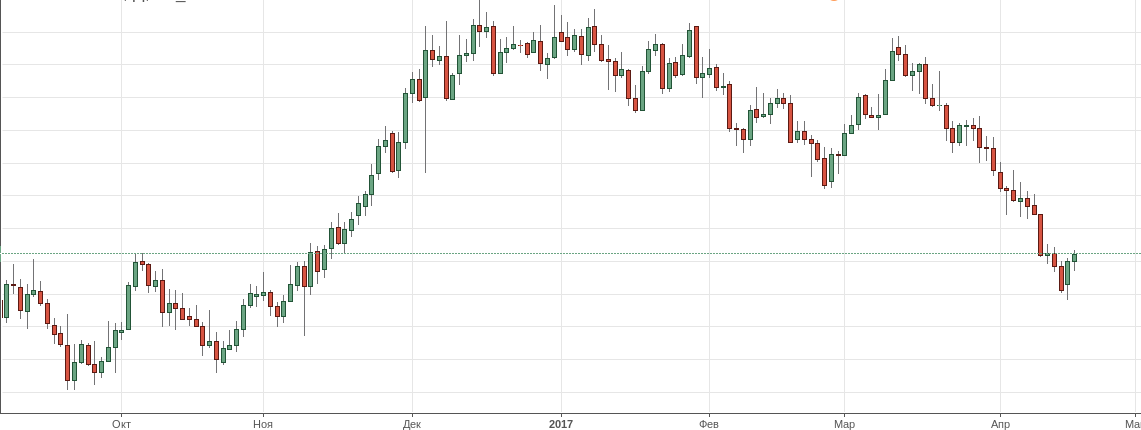 There is also an opinion that technical indicators are especially good at recognizing emerging trends on this pair. Precisely because of the sharp movements characteristic of EURJPY, indicators that usually lag begin to trigger faster. Therefore, if you have an indicator strategy that did not work on EURUSD or GBPUSD, it is worth trying it on this pair.
In addition, thanks to the relatively higher volatility of the pair compared with the same EURUSD, and with exactly the same characteristic sharp movements, EURJPY trends are more clearly expressed and longer-lasting.
It is worth considering that for this pair you may also need to increase the stop loss because of the "spikes," where on lower timeframes it simply needs to be placed farther away, otherwise there is a risk that it will be knocked out. Such patterns are typical up to H4, but on D1 the picture is no longer so intimidating.
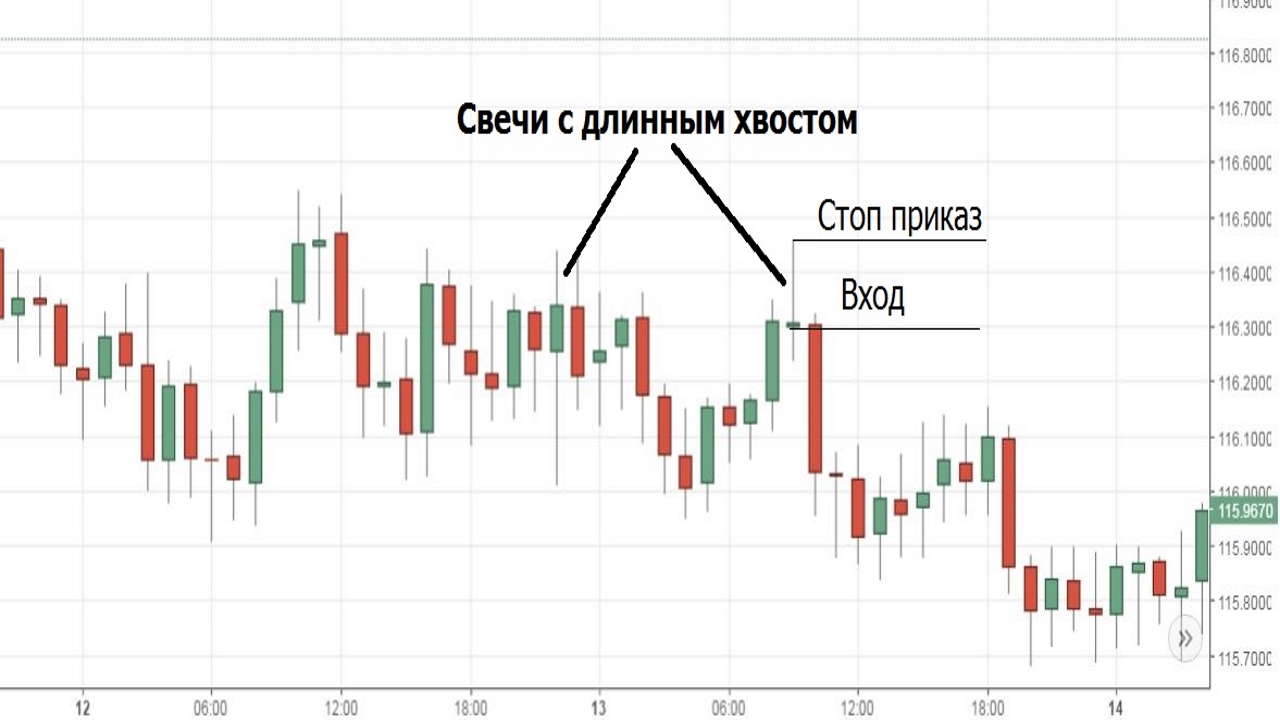
For those who are interested in the possibility of trading on "spikes," one can recommend opening opposite small-target positions after each long tail and shadow. These work excellently both intraday and on daily charts.
 Breakout trading systems also perform excellently on the same strategies of exiting consolidation, allowing you to capture good profits. Boxes are visible to the naked eye, but here too it is worth adjusting the indicators properly so that they take these tails and shadows into account.
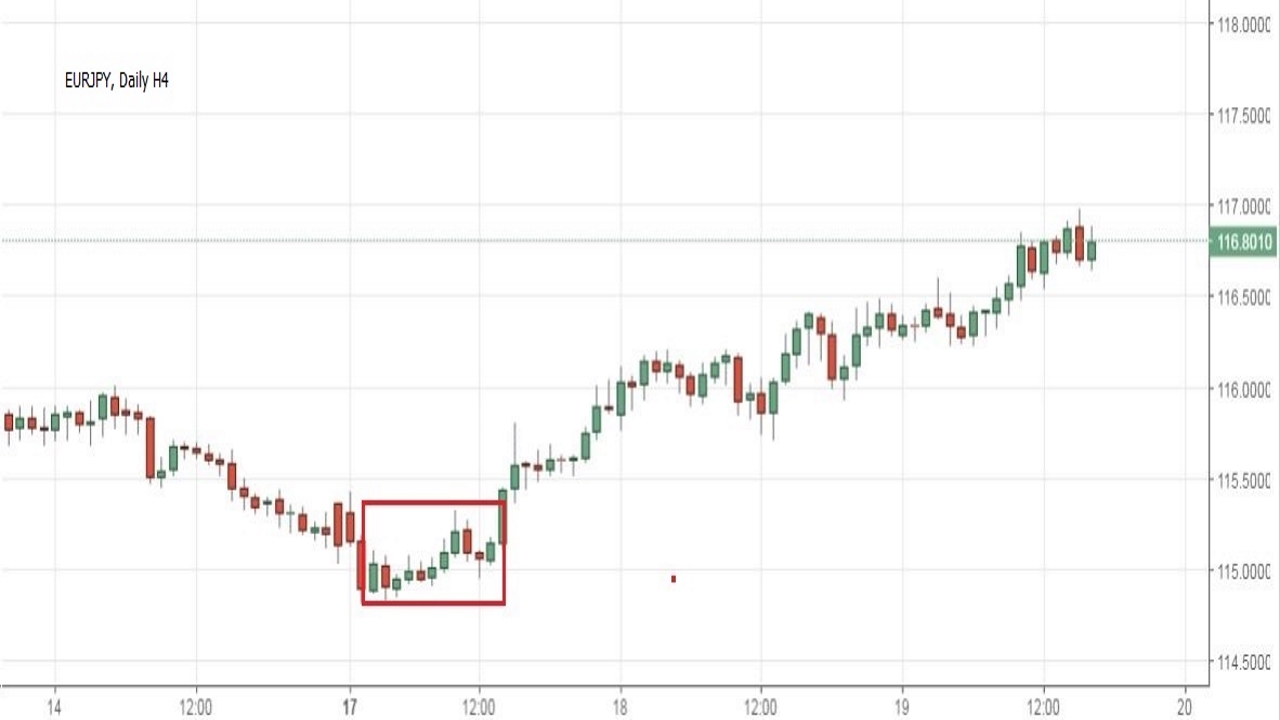 Patterns such as the bullish and bearish flag are clearly visible and work well, so you can confidently look for them on the EURJPY chart.
Let Us Sum Up

- The EURJPY pair is traded excellently and universally both intraday and on daily timeframes;
- It is worth taking surges and tails into account, as they can easily knock out your stop loss. Therefore, the latter should be calculated with an appropriate adjustment for higher volatility;
- Those same candle tails can be used to your advantage by opening opposite small-target positions after long tails;
- Breakout strategies work well, in particular the "bullish flag" and "bearish flag" patterns;
- More clearly expressed trends than in classic pairs such as EURUSD;
- There are correlations with USDJPY, as well as with the Nikkei 225 stock market.
Sincerely, Pavel Vlasov TradeLikeaPro.ru
